Say goodbye to OOM crashes
What guarantees system stability in large data query tasks? It is an effective memory allocation and monitoring mechanism. It is how you speed up computation, avoid memory hotspots, promptly respond to insufficient memory, and minimize OOM errors.

From a database user's perspective, how do they suffer from bad memory management? This is a list of things that used to bother our users:
- OOM errors cause backend processes to crash. To quote one of our community members: Hi, Apache Doris, it's okay to slow things down or fail a few tasks when you are short of memory, but throwing a downtime is just not cool.
- Backend processes consume too much memory space, but there is no way to find the exact task to blame or limit the memory usage for a single query.
- It is hard to set a proper memory size for each query, so chances are that a query gets canceled even when there is plenty of memory space.
- High-concurrency queries are disproportionately slow, and memory hotspots are hard to locate.
- Intermediate data during HashTable creation cannot be flushed to disks, so join queries between two large tables often fail due to OOM.
Luckily, those dark days are behind us, because we have improved our memory management mechanism from the bottom up. Now get ready, things are going to be intensive.
Memory Allocation
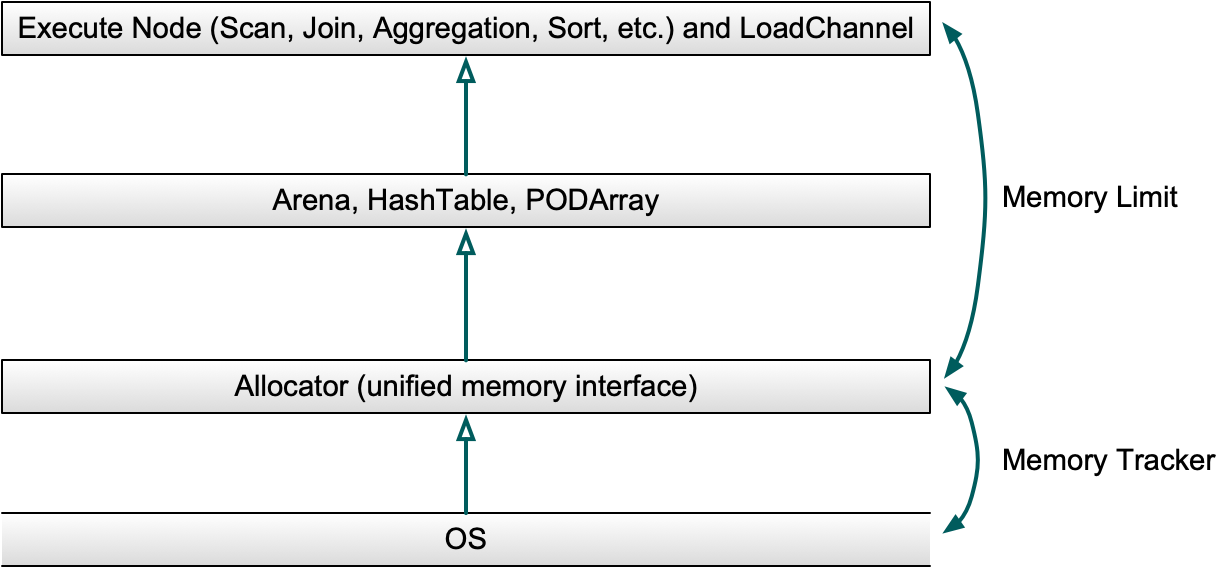
In Apache Doris, we have a one-and-only interface for memory allocation: Allocator. It will make adjustments as it sees appropriate to keep memory usage efficient and under control. Also, MemTrackers are in place to track the allocated or released memory size, and three different data structures are responsible for large memory allocation in operator execution (we will get to them immediately).
Data Structures in Memory
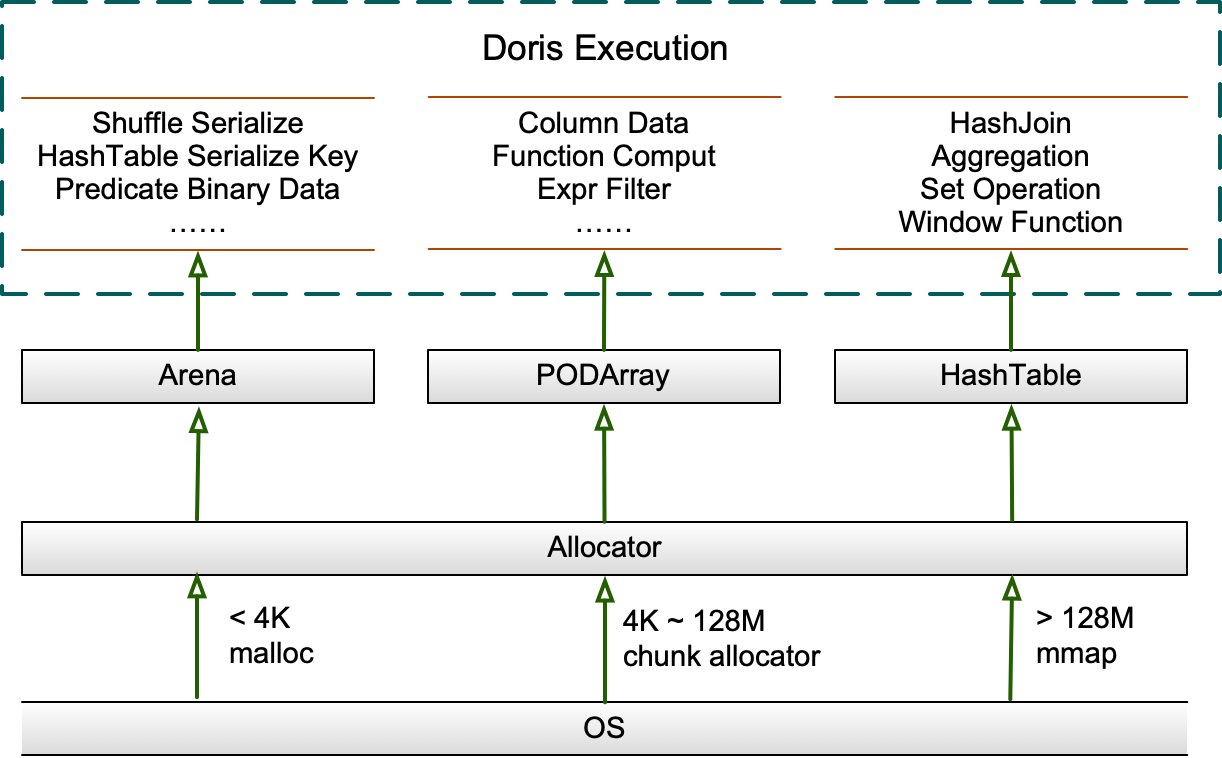
As different queries have different memory hotspot patterns in execution, Apache Doris provides three different in-memory data structures: Arena, HashTable, and PODArray. They are all under the reign of the Allocator.
1. Arena
The Arena is a memory pool that maintains a list of chunks, which are to be allocated upon request from the Allocator. The chunks support memory alignment. They exist throughout the lifespan of the Arena, and will be freed up upon destruction (usually when the query is completed). Chunks are mainly used to store the serialized or deserialized data during Shuffle, or the serialized Keys in HashTables.
The initial size of a chunk is 4096 bytes. If the current chunk is smaller than the requested memory, a new chunk will be added to the list. If the current chunk is smaller than 128M, the new chunk will double its size; if it is larger than 128M, the new chunk will, at most, be 128M larger than what is required. The old small chunk will not be allocated for new requests. There is a cursor to mark the dividing line of chunks allocated and those unallocated.
2. HashTable
HashTables are applicable for Hash Joins, aggregations, set operations, and window functions. The PartitionedHashTable structure supports no more than 16 sub-HashTables. It also supports the parallel merging of HashTables and each sub-Hash Join can be scaled independently. These can reduce overall memory usage and the latency caused by scaling.
If the current HashTable is smaller than 8M, it will be scaled by a factor of 4;
If it is larger than 8M, it will be scaled by a factor of 2;
If it is smaller than 2G, it will be scaled when it is 50% full;
And if it is larger than 2G, it will be scaled when it is 75% full.
The newly created HashTables will be pre-scaled based on how much data it is going to have. We also provide different types of HashTables for different scenarios. For example, for aggregations, you can apply PHmap.
3. PODArray
PODArray, as the name suggests, is a dynamic array of POD. The difference between it and std::vector is that PODArray does not initialize elements. It supports memory alignment and some interfaces of std::vector. It is scaled by a factor of 2. In destruction, instead of calling the destructor function for each element, it releases memory of the whole PODArray. PODArray is mainly used to save strings in columns and is applicable in many function computation and expression filtering.
Memory Interface
As the only interface that coordinates Arena, PODArray, and HashTable, the Allocator executes memory mapping (MMAP) allocation for requests larger than 64M. Those smaller than 4K will be directly allocated from the system via malloc/free; and those in between will be accelerated by a general-purpose caching ChunkAllocator, which brings a 10% performance increase according to our benchmarking results. The ChunkAllocator will try and retrieve a chunk of the specified size from the FreeList of the current core in a lock-free manner; if such a chunk doesn't exist, it will try from other cores in a lock-based manner; if that still fails, it will request the specified memory size from the system and encapsulate it into a chunk.
We chose Jemalloc over TCMalloc after experience with both of them. We tried TCMalloc in our high-concurrency tests and noticed that Spin Lock in CentralFreeList took up 40% of the total query time. Disabling "aggressive memory decommit" made things better, but that brought much more memory usage, so we had to use an individual thread to regularly recycle cache. Jemalloc, on the other hand, was more performant and stable in high-concurrency queries. After fine-tuning for other scenarios, it delivered the same performance as TCMalloc but consumed less memory.
Memory Reuse
Memory reuse is widely executed on the execution layer of Apache Doris. For example, data blocks will be reused throughout the execution of a query. During Shuffle, there will be two blocks at the Sender end and they work alternately, one receiving data and the other in RPC transport. When reading a tablet, Doris will reuse the predicate column, implement cyclic reading, filter, copy filtered data to the upper block, and then clear. When ingesting data into an Aggregate Key table, once the MemTable that caches data reaches a certain size, it will be pre-aggregated and then more data will be written in.
Memory reuse is executed in data scanning, too. Before the scanning starts, a number of free blocks (depending on the number of scanners and threads) will be allocated to the scanning task. During each scanner scheduling, one of the free blocks will be passed to the storage layer for data reading. After data reading, the block will be put into the producer queue for consumption of the upper operators in subsequent computation. Once an upper operator has copied the computation data from the block, the block will go back in the free blocks for next scanner scheduling. The thread the preallocates the free blocks will also be responsible for freeing them up after data scanning, so there won't be extra overheads. The number of free blocks somehow determines the concurrency of data scanning.
Memory Tracking
Apache Doris uses MemTrackers to follow up on the allocation and releasing of memory while analyzing memory hotspots. The MemTrackers keep records of each data query, data ingestion, data compaction task, and the memory size of each global object, such as Cache and TabletMeta. It supports both manual counting and MemHook auto-tracking. Users can view the real-time memory usage in Doris backend on a Web page.
Structure of MemTrackers
The MemTracker system before Apache Doris 1.2.0 was in a hierarchical tree structure, consisting of process_mem_tracker, query_pool_mem_tracker, query_mem_tracker, instance_mem_tracker, ExecNode_mem_tracker and so on. MemTrackers of two neighbouring layers are of parent-child relationship. Hence, any calculation mistakes in a child MemTracker will be accumulated all the way up and result in a larger scale of incredibility.

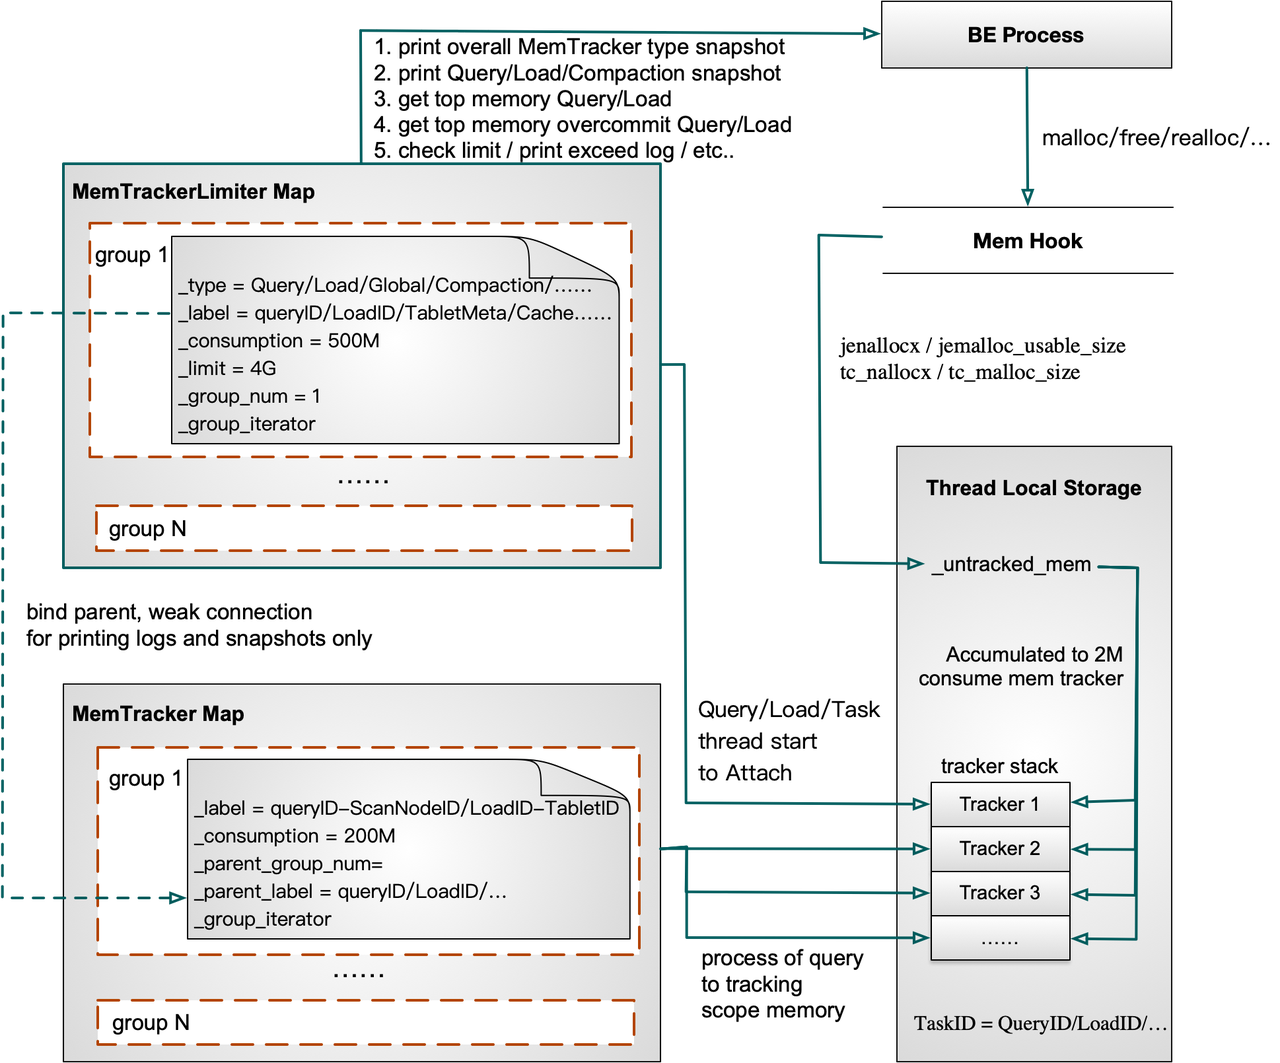
In Apache Doris 1.2.0 and newer, we made the structure of MemTrackers much simpler. MemTrackers are only divided into two types based on their roles: MemTracker Limiter and the others. MemTracker Limiter, monitoring memory usage, is unique in every query/ingestion/compaction task and global object; while the other MemTrackers traces the memory hotspots in query execution, such as HashTables in Join/Aggregation/Sort/Window functions and intermediate data in serialization, to give a picture of how memory is used in different operators or provide reference for memory control in data flushing.
The parent-child relationship between MemTracker Limiter and other MemTrackers is only manifested in snapshot printing. You can think of such a relationship as a symbolic link. They are not consumed at the same time, and the lifecycle of one does not affect that of the other. This makes it much easier for developers to understand and use them.
MemTrackers (including MemTracker Limiter and the others) are put into a group of Maps. They allow users to print overall MemTracker type snapshot, Query/Load/Compaction task snapshot, and find out the Query/Load with the most memory usage or the most memory overusage.
How MemTracker Works
To calculate memory usage of a certain execution, a MemTracker is added to a stack in Thread Local of the current thread. By reloading the malloc/free/realloc in Jemalloc or TCMalloc, MemHook obtains the actual size of the memory allocated or released, and records it in Thread Local of the current thread. When an execution is done, the relevant MemTracker will be removed from the stack. At the bottom of the stack is the MemTracker that records memory usage during the whole query/load execution process.
Now let me explain with a simplified query execution process.
- After a Doris backend node starts, the memory usage of all threads will be recorded in the Process MemTracker.
- When a query is submitted, a Query MemTracker will be added to the Thread Local Storage(TLS) Stack in the fragment execution thread.
- Once a ScanNode is scheduled, a ScanNode MemTracker will be added to Thread Local Storage(TLS) Stack in the fragment execution thread. Then, any memory allocated or released in this thread will be recorded into both the Query MemTracker and the ScanNode MemTracker.
- After a Scanner is scheduled, a Query MemTracker and a Scanner MemTracker will be added to the TLS Stack of the Scanner thread.
- When the scanning is done, all MemTrackers in the Scanner Thread TLS Stack will be removed. When the ScanNode scheduling is done, the ScanNode MemTracker will be removed from the fragment execution thread. Then, similarly, when an aggregation node is scheduled, an AggregationNode MemTracker will be added to the fragment execution thread TLS Stack, and get removed after the scheduling is done.
- If the query is completed, the Query MemTracker will be removed from the fragment execution thread TLS Stack. At this point, this stack should be empty. Then, from the QueryProfile, you can view the peak memory usage during the whole query execution as well as each phase (scanning, aggregation, etc.).

How to Use MemTracker
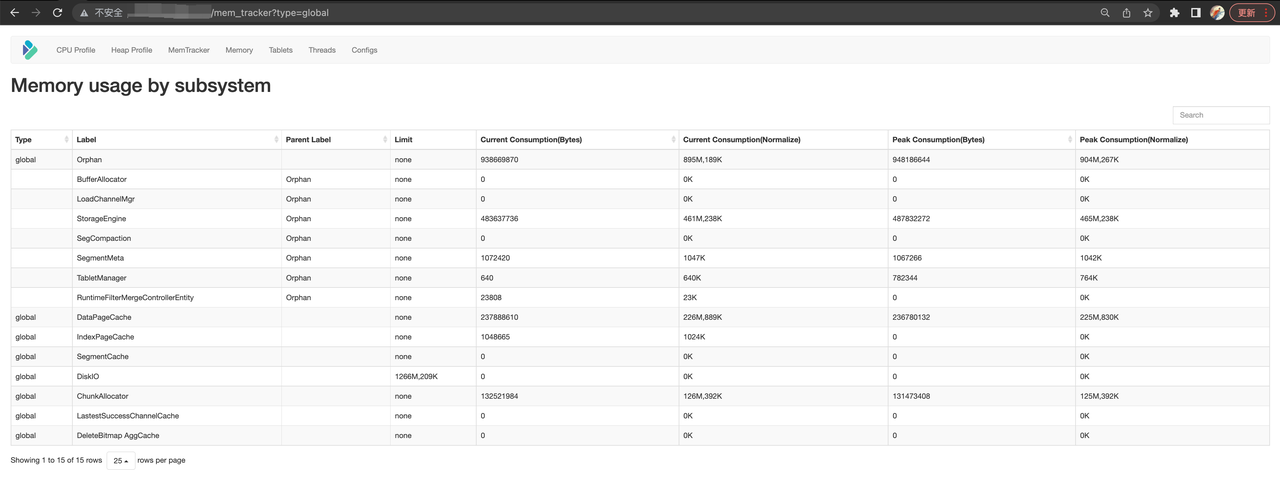
The Doris backend Web page demonstrates real-time memory usage, which is divided into types: Query/Load/Compaction/Global. Current memory consumption and peak consumption are shown.
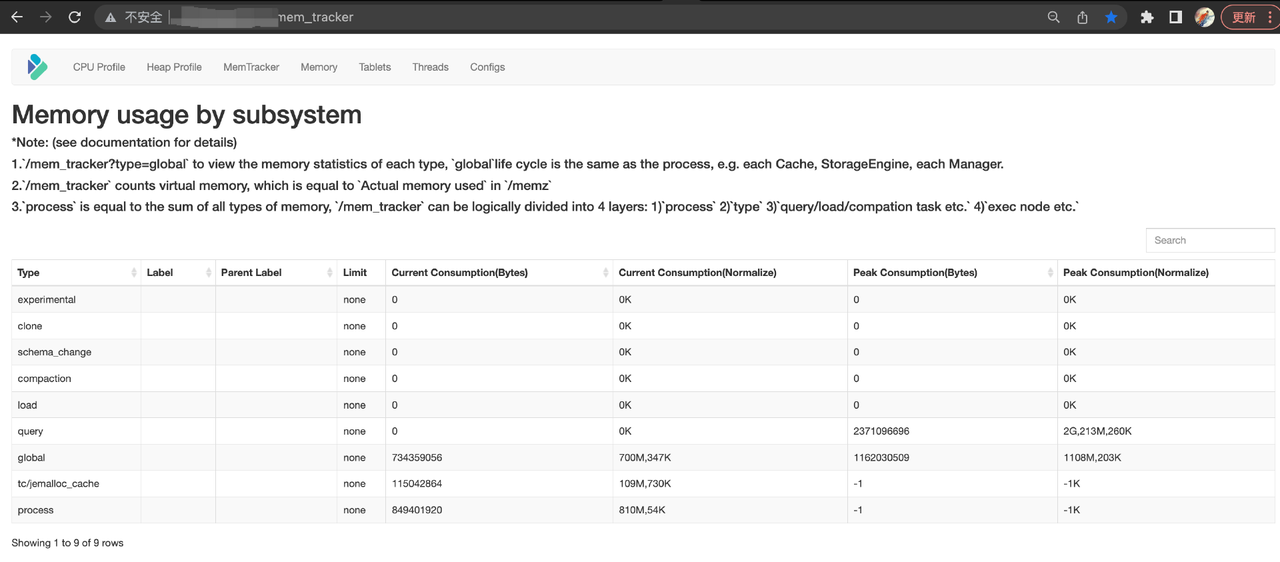
The Global types include MemTrackers of Cache and TabletMeta.
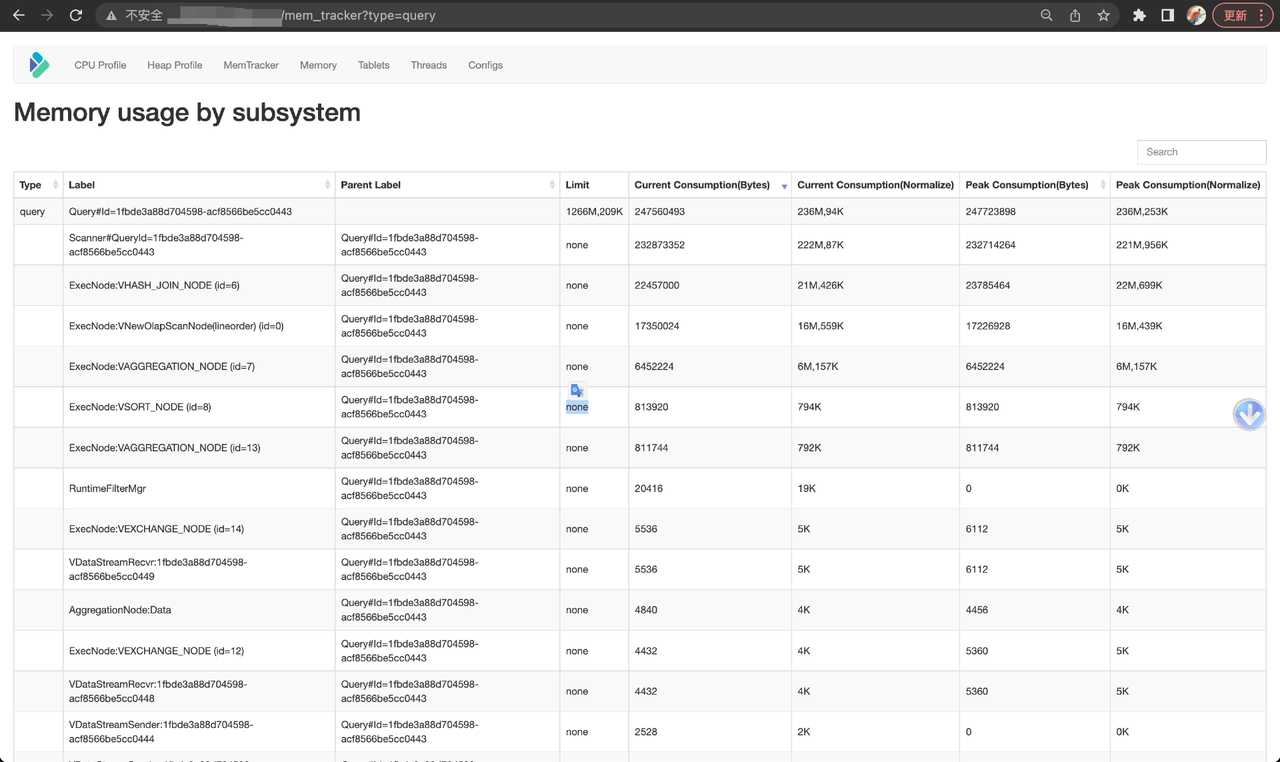
From the Query types, you can see the current memory consumption and peak consumption of the current query and the operators it involves (you can tell how they are related from the labels). For memory statistics of historical queries, you can check the Doris FE audit logs or BE INFO logs.
Memory Limit
With widely implemented memory tracking in Doris backends, we are one step closer to eliminating OOM, the cause of backend downtime and large-scale query failures. The next step is to optimize the memory limit on queries and processes to keep memory usage under control.
Memory Limit on Query
Users can put a memory limit on every query. If that limit is exceeded during execution, the query will be canceled. But since version 1.2, we have allowed Memory Overcommit, which is a more flexible memory limit control. If there are sufficient memory resources, a query can consume more memory than the limit without being canceled, so users don't have to pay extra attention to memory usage; if there are not, the query will wait until new memory space is allocated; only when the newly freed up memory is not enough for the query will the query be canceled.
While in Apache Doris 2.0, we have realized exception safety for queries. That means any insufficient memory allocation will immediately cause the query to be canceled, which saves the trouble of checking "Cancel" status in subsequent steps.
Memory Limit on Process
On a regular basis, Doris backend retrieves the physical memory of processes and the currently available memory size from the system. Meanwhile, it collects MemTracker snapshots of all Query/Load/Compaction tasks. If a backend process exceeds its memory limit or there is insufficient memory, Doris will free up some memory space by clearing Cache and cancelling a number of queries or data ingestion tasks. These will be executed by an individual GC thread regularly.
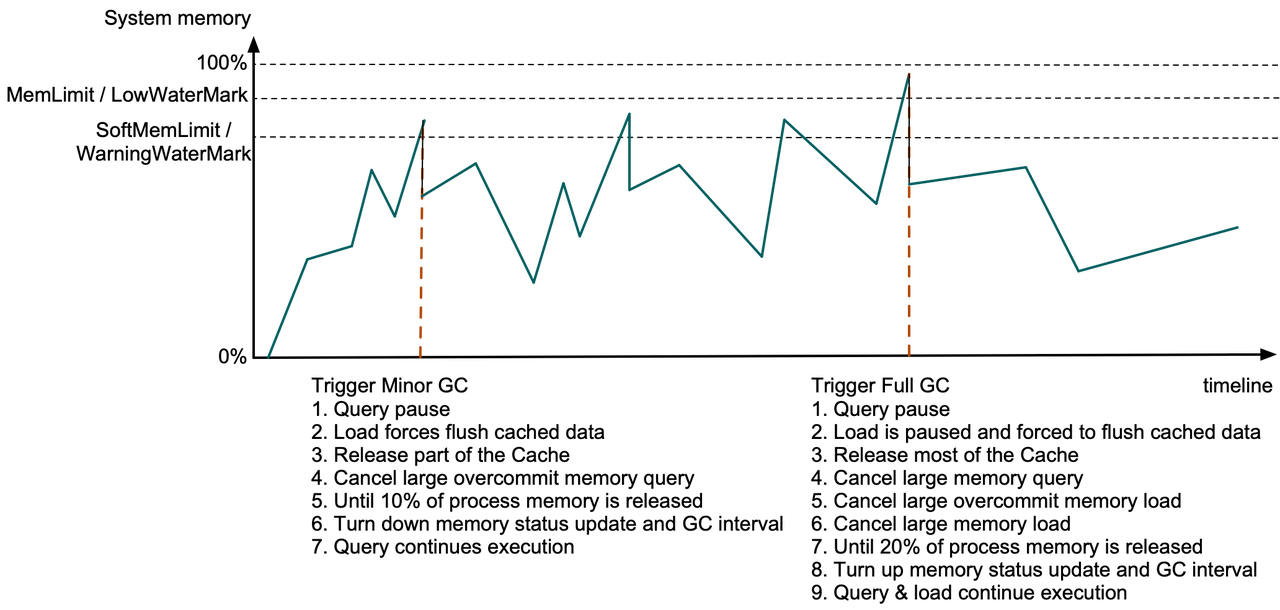
If the process memory consumed is over the SoftMemLimit (81% of total system memory, by default), or the available system memory drops below the Warning Water Mark (less than 3.2GB), Minor GC will be triggered. At this moment, query execution will be paused at the memory allocation step, the cached data in data ingestion tasks will be force flushed, and part of the Data Page Cache and the outdated Segment Cache will be released. If the newly released memory does not cover 10% of the process memory, with Memory Overcommit enabled, Doris will start cancelling the queries which are the biggest "overcommitters" until the 10% target is met or all queries are canceled. Then, Doris will shorten the system memory checking interval and the GC interval. The queries will be continued after more memory is available.
If the process memory consumed is beyond the MemLimit (90% of total system memory, by default), or the available system memory drops below the Low Water Mark (less than 1.6GB), Full GC will be triggered. At this time, data ingestion tasks will be stopped, and all Data Page Cache and most other Cache will be released. If, after all these steps, the newly released memory does not cover 20% of the process memory, Doris will look into all MemTrackers and find the most memory-consuming queries and ingestion tasks, and cancel them one by one. Only after the 20% target is met will the system memory checking interval and the GC interval be extended, and the queries and ingestion tasks be continued. (One garbage collection operation usually takes hundreds of μs to dozens of ms.)
Influences and Outcomes
After optimizations in memory allocation, memory tracking, and memory limit, we have substantially increased the stability and high-concurrency performance of Apache Doris as a real-time analytic data warehouse platform. OOM crash in the backend is a rare scene now. Even if there is an OOM, users can locate the problem root based on the logs and then fix it. In addition, with more flexible memory limits on queries and data ingestion, users don't have to spend extra effort taking care of memory when memory space is adequate.
In the next phase, we plan to ensure completion of queries in memory overcommitment, which means less queries will have to be canceled due to memory shortage. We have broken this objective into specific directions of work: exception safety, memory isolation between resource groups, and the flushing mechanism of intermediate data. If you want to meet our developers, this is where you find us.

