Empowering cyber security by enabling 7 times faster log analysis
This is about how a cyber security service provider built its log storage and analysis system (LSAS) and realized 3X data writing speed, 7X query execution speed, and visualized management.
Log storage & analysis platform
In this use case, the LSAS collects system logs from its enterprise users, scans them, and detects viruses. It also provides data management and file tracking services.
Within the LSAS, it scans local files and uploads the file information as MD5 values to its cloud engine and identifies suspicious viruses. The cloud engine returns a log entry to tell the risk level of the files. The log entry includes messages like file_name, file_size, file_level, and event_time. Such information goes into a Topic in Apache Kafka, and then the real-time data warehouse normalizes the log messages. After that, all log data will be backed up to the offline data warehouse. Some log data requires further security analysis, so it will be pulled into the analytic engine and the self-developed Extended Detection and Response system (XDR) for more comprehensive detection.
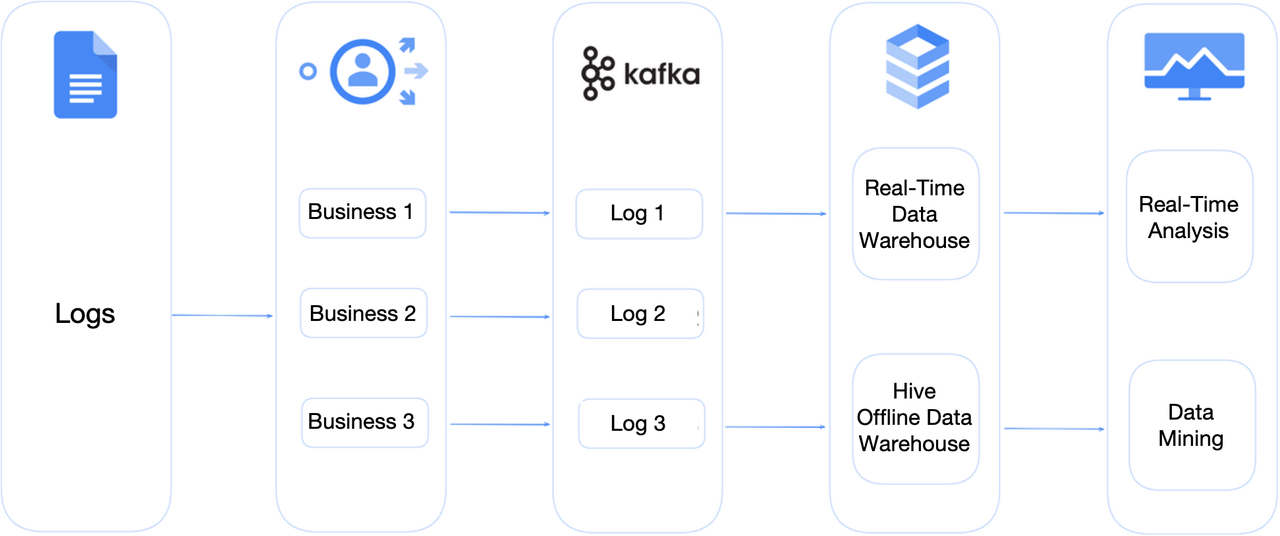
The above process comes down to log writing and analysis, and the company faced some issues in both processes with their old system, which used StarRocks as the analytic engine.
Slow data writing
The cloud engine interacts with tens of millions of terminal software and digests over 100 billion logs every day. The enormous data size poses a big challenge. The LSAS used to rely on StarRocks for log storage. With the ever-increasing daily log influx, data writing gradually slows down. The severe backlogs during peak times undermines system stability. They tried scaling the cluster from 3 nodes to 13 nodes, but the writing speed wasn't substantially improved.
Slow query execution
From an execution standpoint, extracting security information from logs involves a lot of keyword matching in the text fields (URL, payload, etc.). The StarRocks-based system does that by the SQL LIKE operator, which implements full scanning and brutal-force matching. In that way, queries on a 100-billion-row table often take one or several minutes. After screening out irrelevant data based on time range, the query response time still ranges from seconds to dozens of seconds, and it gets worse with concurrent queries.
Architectural upgrade
In the search for a new database tool, the cyber security company set their eye on Apache Doris, which happened to have sharpened itself up in version 2.0 for log analysis. It supports inverted index to empower text search, and NGram BloomFilter to speed up the LIKE operator.
Although StarRocks was a fork of Apache Doris, it has rewritten part of the code and is now very different from Apache Doris in terms of features. The foregoing inverted index and NGram BloomFilter are a fragment of the current advancements that Apache Doris has made.
They tried Apache Doris out to evaluate its writing speed, query performance, and the associated storage and maintenance costs.
300% data writing speed
To test the peak performance of Apache Doris, they only used 3 servers and connected it to Apache Kafka to receive their daily data input, and this is the test result compared to the old StarRocks-based LSAS.

Based on the peak performance of Apache Doris, it's estimated that a 3-server cluster with 30% of CPU usage will be able to handle the writing workload. That can save them over 70% of hardware resources. Notably, in this test, they enabled inverted index for half of the fields. If it were disabled, the writing speed could be increased by another 50%.
60% storage cost
With inverted index enabled, Apache Doris used even smaller storage space than the old system without inverted indexes. The data compression ratio was 1: 5.7 compared to the previous 1: 4.3.
In most databases and similar tools, the index file is often 2~4 times the size of the data file it belongs to, but in Apache Doris, the index-data size is basically one to one. That means Apache Doris can save a lot of storage space for users. This is because it has adopted columnar storage and the ZStandard compression. With data and indexes being stored column by column, it is easier to compress them, and the ZStandard algorithm is faster with higher compression ratio so it is perfect for log processing.
690% query speed
To compare the query performance before and after upgrading, they tested the old and the new systems with 79 of their frequently executed SQL statements on the same 100 billion rows of log data with the same cluster size of 10 backend nodes.
They jotted down the query response time as follows:
The new Apache Doris-based system is faster in all 79 queries. On average, it reduces the query execution time by a factor of 7.
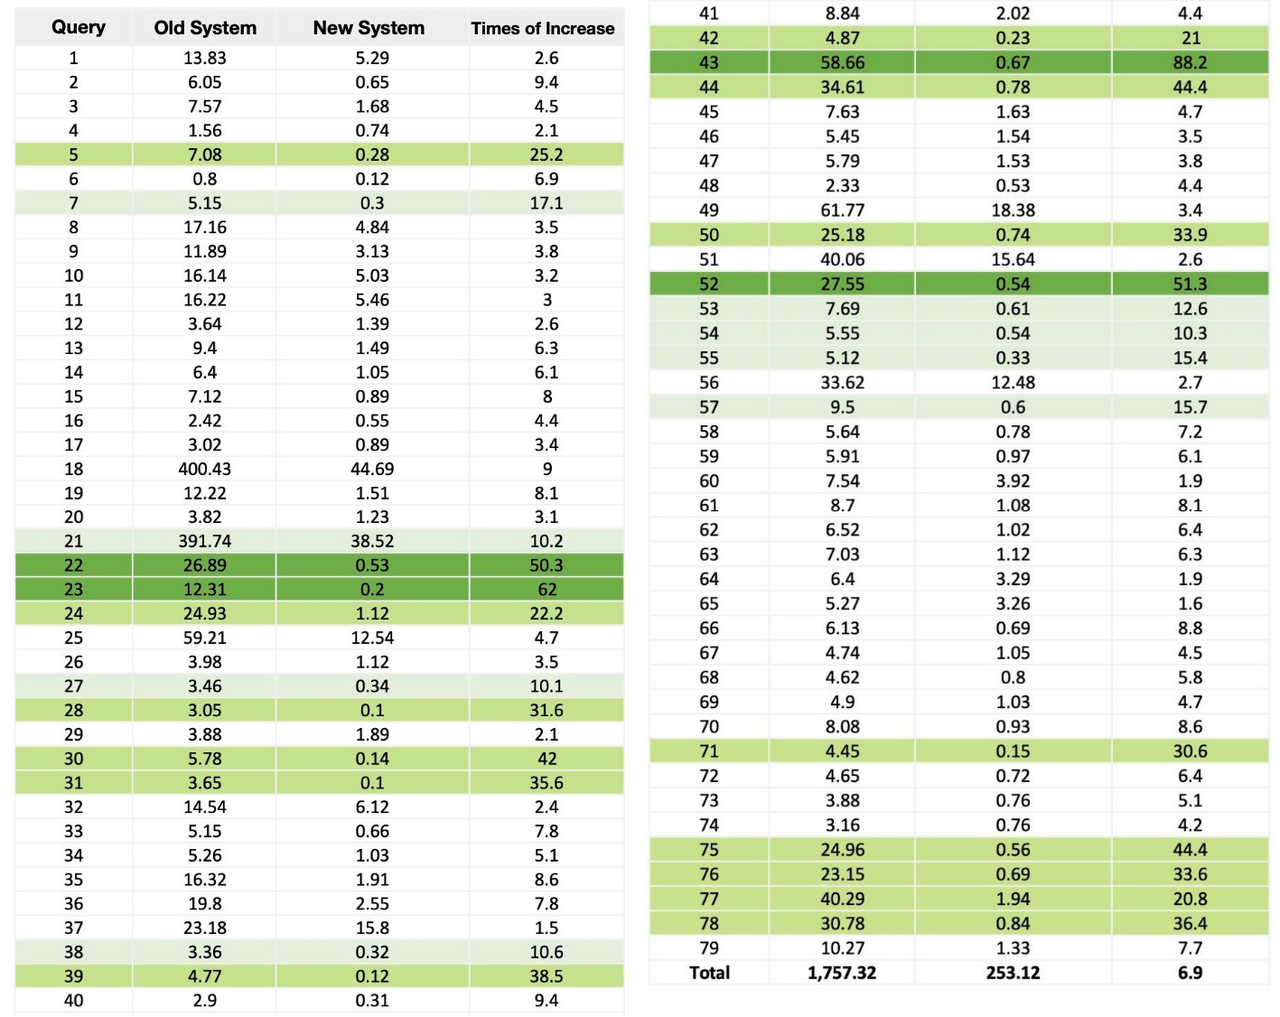
Among these queries, the greatest increases in speed were enabled by a few features and optimizations of Apache Doris for log analysis.
1. Inverted index accelerating keyword searches: Q23, Q24, Q30, Q31, Q42, Q43, Q50
Example: Q43 was sped up 88.2 times.
SELECT count() from table2
WHERE ( event_time >= 1693065600000 and event_time < 1693152000000)
  AND (rule_hit_big MATCH 'xxxx');
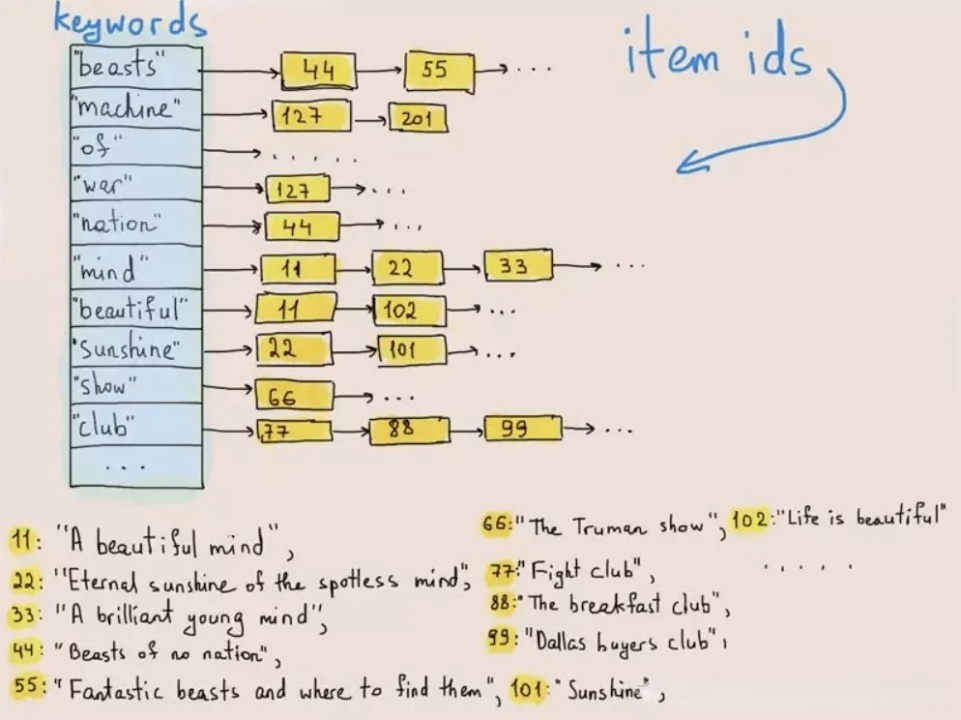
How is inverted index implemented? Upon data writing, Apache Doris tokenizes the texts into words, and takes notes of which word exists in which rows. For example, the word "machine" is in Row 127 and Row 201. In keyword searches, the system can quickly locate the relevant data by tracking the row numbers in the indexes.
Inverted index is much more efficient than brutal-force scanning in text searches. For one thing, it doesn't have to read that much data. For another, it doesn't require text matching. So it is able to increase execution speed by orders of magnitudes.
2. NGram BloomFilter accelerating the LIKE operator: Q75, Q76, Q77, Q78
Example: Q75 was sped up 44.4 times.
SELECT * FROM table1
WHERE  ent_id = 'xxxxx'
   AND event_date = '2023-08-27'
   AND file_level = 70
   AND rule_group_id LIKE 'adid:%'
ORDER BY event_time LIMIT 100;
For non-verbatim searches, the LIKE operator is an important implementation method, so Apache Doris 2.0 introduces the NGram BloomFilter to empower that.
Different from regular BloomFilter, the NGram BloomFilter does not put the entire text into the filter, but splits it into continuous sub-strings of length N, and then puts the sub-strings into the filter. For a query like cola LIKE '%pattern%', it splits 'pattern' into several strings of length N, and sees if each of these sub-strings exists in the dataset. The absence of any sub-string in the dataset will indicate that the dataset does not contain the word 'pattern', so it will be skipped in data scanning, and that's how the NGram BloomFilter accelerates queries.
3. Optimizations for Top-N queries: Q19~Q29
Example: Q22 was sped up 50.3 times.
SELECT * FROM table1
where event_date = '2023-08-27' and file_level = 70
  and ent_id = 'nnnnnnn' and file_name = 'xxx.exe'
order by event_time limit 100;
Top-N queries are to find the N logs that fit into the specified conditions. It is a common type of query in log analysis, with the SQl being like SELECT * FROM t WHERE xxx ORDER BY xx LIMIT n. Apache Doris has optimized itself for that. Based on the intermediate status of queries, it figures out the dynamic range of the ranking field and implements automatic predicate pushdown to reduce data scanning. In some cases, this can decrease the scanned data volume by an order of magnitude.
Visualized operation & maintenance
For more efficient cluster maintenance, VeloDB, a commercial company with products based on Apache Doris , has contributed a visualized cluster management tool called Doris Manager to the Apache Doris project. Everyday management and maintenance operations can be done via the Doris Manager, including cluster monitoring, inspection, configuration modification, scaling, and upgrading. The visualized tool can save a lot of manual efforts and avoid the risks of maloperations on Doris.
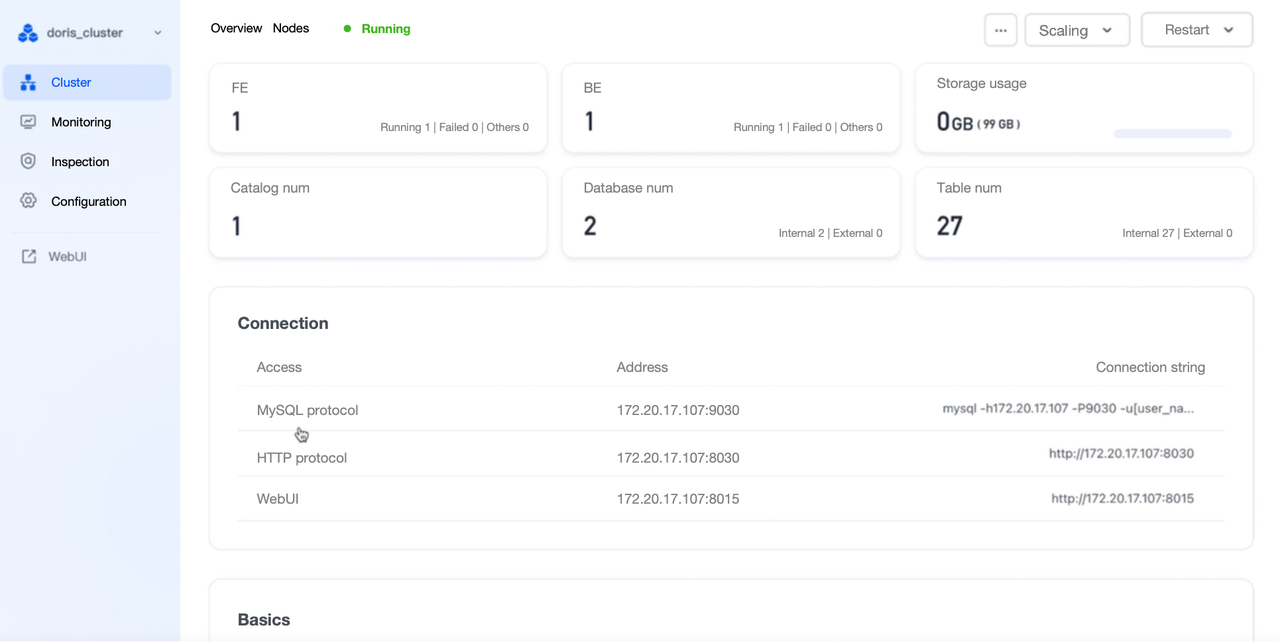
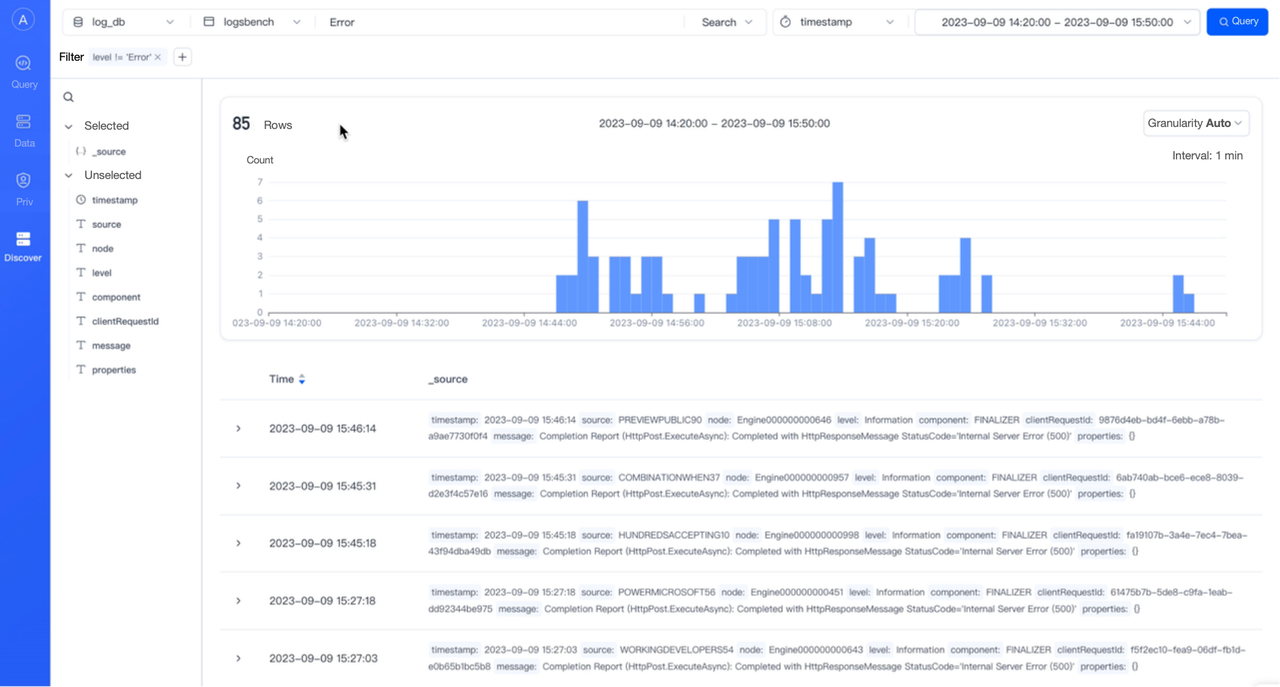
Apart from cluster management, Doris Manager provides a visualized WebUI for log analysis (think of Kibana), so it's very friendly to users who are familiar with the ELK Stack. It supports keyword searches, trend charts, field filtering, and detailed data listing and collapsed display, so it enables interactive analysis and easy drilling down of logs.
After a month-long trial run, they officially replaced their old LSAS with the Apache Doris-based system for production, and achieved great results as they expected. Now, they ingest their 100s of billions of new logs every day via the Routine Load method at a speed 3 times as fast as before. Among the 7-time overall query performance increase, they benefit from a speedup of over 20 times in full-text searches. And they enjoy easier maintenance and interactive analysis. Their next step is to expand the coverage of JSON data type and delve into semi-structured data analysis. Luckily, the upcoming Apache Doris 2.1 will provide more schema-free support. It will have a new Variant data type, support JSON data of any structures, and allow for flexible changes in field numbers and field types. Relevant updates will be released on the Apache Doris website and the Apache Doris community.

