Log analysis: Elasticsearch vs Apache Doris
As a major part of a company's data asset, logs brings values to businesses in three aspects: system observability, cyber security, and data analysis. They are your first resort for troubleshooting, your reference for improving system security, and your data mine where you can extract information that points to business growth.
Logs are the sequential records of events in the computer system. If you think about how logs are generated and used, you will know what an ideal log analysis system should look like:
- It should have schema-free support. Raw logs are unstructured free texts and basically impossible for aggregation and calculation, so you needed to turn them into structured tables (the process is called "ETL") before putting them into a database or data warehouse for analysis. If there was a schema change, lots of complicated adjustments needed to put into ETL and the structured tables. Therefore, semi-structured logs, mostly in JSON format, emerged. You can add or delete fields in these logs and the log storage system will adjust the schema accordingly.
- It should be low-cost. Logs are huge and they are generated continuously. A fairly big company produces 10~100 TBs of log data. For business or compliance reasons, it should keep the logs around for half a year or longer. That means to store a log size measured in PB, so the cost is considerable.
- It should be capable of real-time processing. Logs should be written in real time, otherwise engineers won't be able to catch the latest events in troubleshooting and security tracking. Plus, a good log system should provide full-text searching capabilities and respond to interactive queries quickly.
The Elasticsearch-Based Log Analysis Solution
A popular log processing solution within the data industry is the ELK stack: Elasticsearch, Logstash, and Kibana. The pipeline can be split into five modules:
- Log collection: Filebeat collects local log files and writes them to a Kafka message queue.
- Log transmission: Kafka message queue gathers and caches logs.
- Log transfer: Logstash filters and transfers log data in Kafka.
- Log storage: Logstash writes logs in JSON format into Elasticsearch for storage.
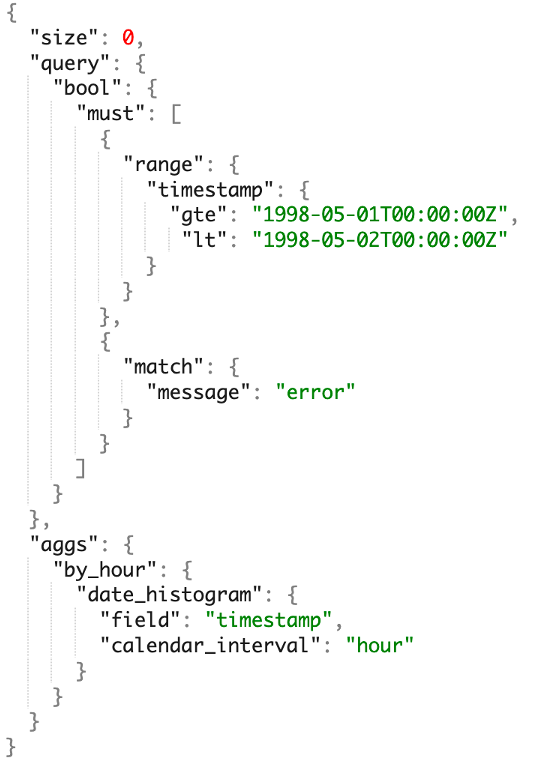
- Log query: Users search for logs via Kibana visualization or send a query request via Elasticsearch DSL API.

The ELK stack has outstanding real-time processing capabilities, but frictions exist.
Inadequate Schema-Free Support
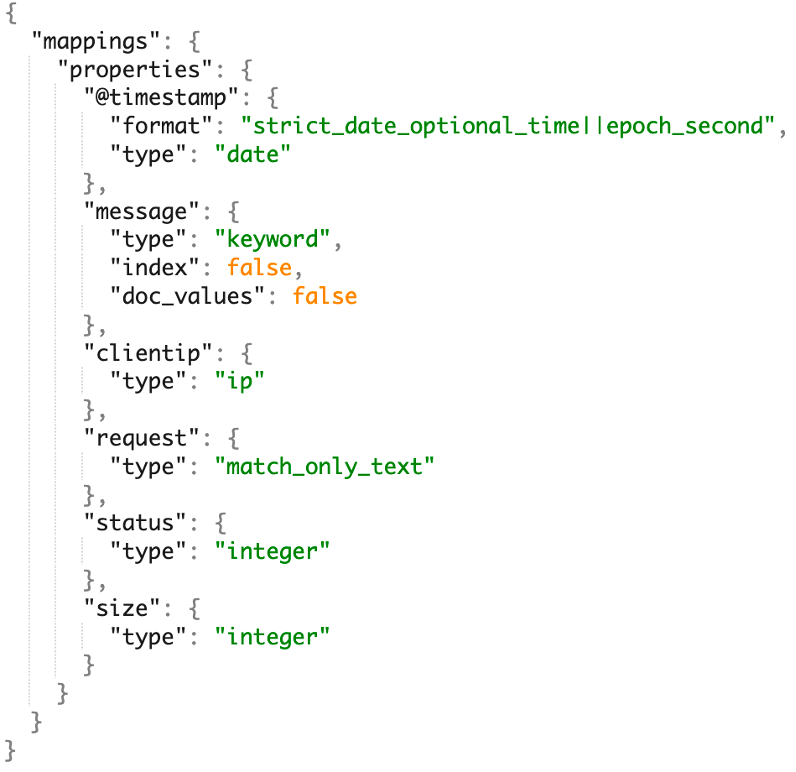
The Index Mapping in Elasticsearch defines the table scheme, which includes the field names, data types, and whether to enable index creation.

Elasticsearch also boasts a Dynamic Mapping mechanism that automatically adds fields to the Mapping according to the input JSON data. This provides some sort of schema-free support, but it's not enough because:
- Dynamic Mapping often creates too many fields when processing dirty data, which interrupts the whole system.
- The data type of fields is immutable. To ensure compatibility, users often configure "text" as the data type, but that results in much slower query performance than binary data types such as integer.
- The index of fields is immutable, too. Users cannot add or delete indexes for a certain field, so they often create indexes for all fields to facilitate data filtering in queries. But too many indexes require extra storage space and slow down data ingestion.
Inadequate Analytic Capability
Elasticsearch has its unique Domain Specific Language (DSL), which is very different from the tech stack that most data engineers and analysts are familiar with, so there is a steep learning curve. Moreover, Elasticsearch has a relatively closed ecosystem so there might be strong resistance in integration with BI tools. Most importantly, Elastisearch only supports single-table analysis and is lagging behind the modern OLAP demands for multi-table join, sub-query, and views.

High Cost & Low Stability
Elasticsearch users have been complaining about the computation and storage costs. The root reason lies in the way Elasticsearch works.
- Computation cost: In data writing, Elasticsearch also executes compute-intensive operations including inverted index creation, tokenization, and inverted index ranking. Under these circumstances, data is written into Elasticsearch at a speed of around 2MB/s per core. When CPU resources are tight, data writing requirements often get rejected during peak times, which further leads to higher latency.
- Storage cost: To speed up retrieval, Elasticsearch stores the forward indexes, inverted indexes, and docvalues of the original data, consuming a lot more storage space. The compression ratio of a single data copy is only 1.5:1, compared to the 5:1 in most log solutions.
As data and cluster size grows, maintaining stability can be another issue:
-
During data writing peaks: Clusters are prone to overload during data writing peaks.
-
During queries: Since all queries are processed in the memory, big queries can easily lead to JVM OOM.
-
Slow recovery: For a cluster failure, Elasticsearch should reload indexes, which is resource-intensive, so it will take many minutes to recover. That challenges service availability guarantee.
A More Cost-Effective Option
Reflecting on the strengths and limitations of the Elasticsearch-based solution, the Apache Doris developers have optimized Apache Doris for log processing.
- Increase writing throughout: The performance of Elasticsearch is bottlenecked by data parsing and inverted index creation, so we improved Apache Doris in these factors: we quickened data parsing and index creation by SIMD instructions and CPU vector instructions; then we removed those data structures unnecessary for log analysis scenarios, such as forward indexes, to simplify index creation.
- Reduce storage costs: We removed forward indexes, which represented 30% of index data. We adopted columnar storage and the ZSTD compression algorithm, and thus achieved a compression ratio of 5:1 to 10:1. Given that a large part of the historical logs are rarely accessed, we introduced tiered storage to separate hot and cold data. Logs that are older than a specified time period will be moved to object storage, which is much less expensive. This can reduce storage costs by around 70%.
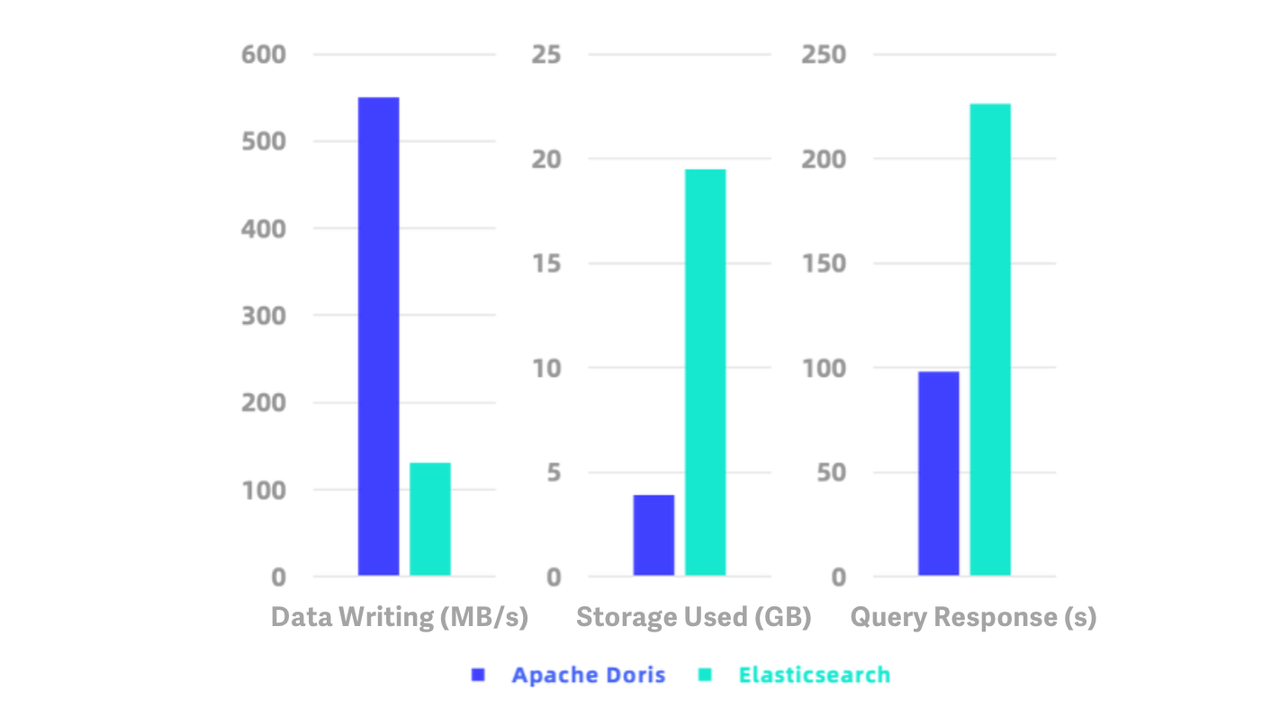
Benchmark tests with ES Rally, the official testing tool for Elasticsearch, showed that Apache Doris was around 5 times as fast as Elasticsearch in data writing, 2.3 times as fast in queries, and it consumed only 1/5 of the storage space that Elasticsearch used. On the test dataset of HTTP logs, it achieved a writing speed of 550 MB/s and a compression ratio of 10:1.

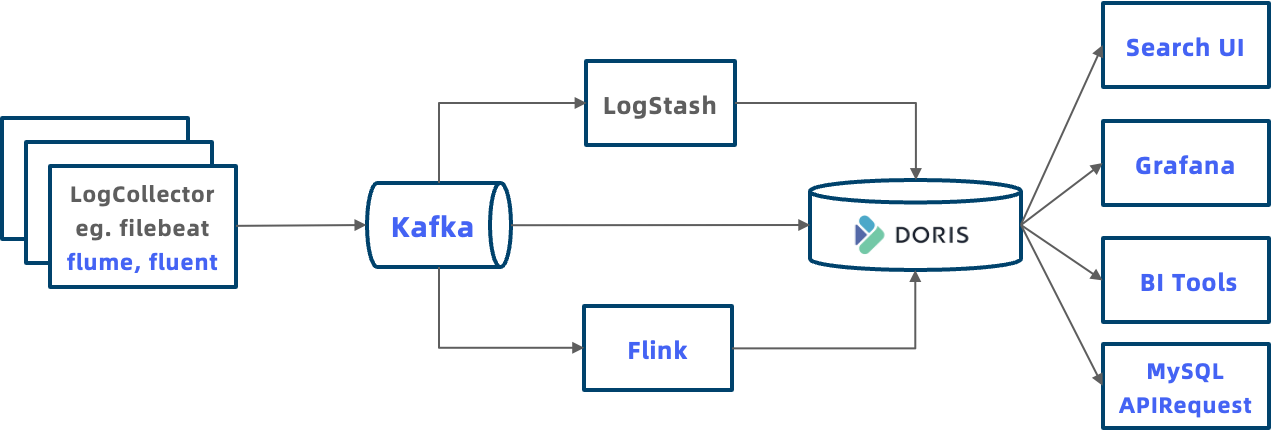
The below figure show what a typical Doris-based log processing system looks like. It is more inclusive and allows for more flexible usage from data ingestion, analysis, and application:
- Ingestion: Apache Doris supports various ingestion methods for log data. You can push logs to Doris via HTTP Output using Logstash, you can use Flink to pre-process the logs before you write them into Doris, or you can load logs from Flink or object storage to Doris via Routine Load and S3 Load.
- Analysis: You can put log data in Doris and conduct join queries across logs and other data in the data warehouse.
- Application: Apache Doris is compatible with MySQL protocol, so you can integrate a wide variety of data analytic tools and clients to Doris, such as Grafana and Tableau. You can also connect applications to Doris via JDBC and ODBC APIs. We are planning to build a Kibana-like system to visualize logs.

Moreover, Apache Doris has better scheme-free support and a more user-friendly analytic engine.
Native Support for Semi-Structured Data
Firstly, we worked on the data types. We optimized the string search and regular expression matching for "text" through vectorization and brought a performance increase of 2~10 times. For JSON strings, Apache Doris will parse and store them as a more compacted and efficient binary format, which can speed up queries by 4 times. We also added a new data type for complicated data: Array Map. It can structuralize concatenated strings to allow for higher compression rate and faster queries.
Secondly, Apache Doris supports schema evolution. This means you can adjust the schema as your business changes. You can add or delete fields and indexes, and change the data types for fields.
Apache Doris provides Light Schema Change capabilities, so you can add or delete fields within milliseconds:
-- Add a column. Result will be returned in milliseconds.
ALTER TABLE lineitem ADD COLUMN l_new_column INT;
You can also add index only for your target fields, so you can avoid overheads from unnecessary index creation. After you add an index, by default, the system will generate the index for all incremental data, and you can specify which historical data partitions that need the index.
-- Add inverted index. Doris will generate inverted index for all new data afterward.
ALTER TABLE table_name ADD INDEX index_name(column_name) USING INVERTED;

-- Build index for the specified historical data partitions.
BUILD INDEX index_name ON table_name PARTITIONS(partition_name1, partition_name2);
SQL-Based Analytic Engine
The SQL-based analytic engine makes sure that data engineers and analysts can smoothly grasp Apache Doris in a short time and bring their experience with SQL to this OLAP engine. Building on the rich features of SQL, users can execute data retrieval, aggregation, multi-table join, sub-query, UDF, logic views, and materialized views to serve their own needs.
With MySQL compatibility, Apache Doris can be integrated with most GUI and BI tools in the big data ecosystem, so users can realize more complex and diversified data analysis.
Performance in Use Case
A gaming company has transitioned from the ELK stack to the Apache Doris solution. Their Doris-based log system used 1/6 of the storage space that they previously needed.
In a cybersecurity company who built their log analysis system utilizing inverted index in Apache Doris, they supported a data writing speed of 300,000 rows per second with 1/5 of the server resources that they formerly used.
Hands-On Guide
Now let's go through the three steps of building a log analysis system with Apache Doris.
Before you start, download Apache Doris 2.0 or newer versions from the website and deploy clusters.
Step 1: Create Tables
This is an example of table creation.
Explanations for the configurations:
- The DATETIMEV2 time field is specified as the Key in order to speed up queries for the latest N log records.
- Indexes are created for the frequently accessed fields, and fields that require full-text search are specified with Parser parameters.
- "PARTITION BY RANGE" means to partition the data by RANGE based on time fields, Dynamic Partition is enabled for auto-management.
- "DISTRIBUTED BY RANDOM BUCKETS AUTO" means to distribute the data into buckets randomly and the system will automatically decide the number of buckets based on the cluster size and data volume.
- "log_policy_1day" and "log_s3" means to move logs older than 1 day to S3 storage.
CREATE DATABASE log_db;
USE log_db;

CREATE RESOURCE "log_s3"
PROPERTIES
(
    "type" = "s3",
    "s3.endpoint" = "your_endpoint_url",
    "s3.region" = "your_region",
    "s3.bucket" = "your_bucket",
    "s3.root.path" = "your_path",
    "s3.access_key" = "your_ak",
    "s3.secret_key" = "your_sk"
);

CREATE STORAGE POLICY log_policy_1day
PROPERTIES(
    "storage_resource" = "log_s3",
    "cooldown_ttl" = "86400"
);

CREATE TABLE log_table
(
  `ts` DATETIMEV2,
  `clientip` VARCHAR(20),
  `request` TEXT,
  `status` INT,
  `size` INT,
  INDEX idx_size (`size`) USING INVERTED,
  INDEX idx_status (`status`) USING INVERTED,
  INDEX idx_clientip (`clientip`) USING INVERTED,
  INDEX idx_request (`request`) USING INVERTED PROPERTIES("parser" = "english")
)
ENGINE = OLAP
DUPLICATE KEY(`ts`)
PARTITION BY RANGE(`ts`) ()
DISTRIBUTED BY RANDOM BUCKETS AUTO
PROPERTIES (
"replication_num" = "1",
"storage_policy" = "log_policy_1day",
"deprecated_dynamic_schema" = "true",
"dynamic_partition.enable" = "true",
"dynamic_partition.time_unit" = "DAY",
"dynamic_partition.start" = "-3",
"dynamic_partition.end" = "7",
"dynamic_partition.prefix" = "p",
"dynamic_partition.buckets" = "AUTO",
"dynamic_partition.replication_num" = "1"
);
Step 2: Ingest the Logs
Apache Doris supports various ingestion methods. For real-time logs, we recommend the following three methods:
- Pull logs from Kafka message queue: Routine Load
- Logstash: write logs into Doris via HTTP API
- Self-defined writing program: write logs into Doris via HTTP API
Ingest from Kafka
For JSON logs that are written into Kafka message queues, create Routine Load so Doris will pull data from Kafka. The following is an example. The property.* configurations are optional:
-- Prepare the Kafka cluster and topic ("log_topic")

-- Create Routine Load, load data from Kafka log_topic to "log_table"
CREATE ROUTINE LOAD load_log_kafka ON log_db.log_table
COLUMNS(ts, clientip, request, status, size)
PROPERTIES (
    "max_batch_interval" = "60",
    "max_batch_rows" = "20000000",
    "max_batch_size" = "1073741824",
    "load_to_single_tablet" = "true",
    "format" = "json"
)
FROM KAFKA (
    "kafka_broker_list" = "host:port",
    "kafka_topic" = "log_topic",
    "property.group.id" = "your_group_id",
    "property.security.protocol"="SASL_PLAINTEXT",
    "property.sasl.mechanism"="GSSAPI",
    "property.sasl.kerberos.service.name"="kafka",
    "property.sasl.kerberos.keytab"="/path/to/xxx.keytab",
    "property.sasl.kerberos.principal"="xxx@yyy.com"
);
You can check how the Routine Load runs via the SHOW ROUTINE LOAD command.
Ingest via Logstash
Configure HTTP Output for Logstash, and then data will be sent to Doris via HTTP Stream Load.
- Specify the batch size and batch delay in
logstash.ymlto improve data writing performance.
pipeline.batch.size: 100000
pipeline.batch.delay: 10000
- Add HTTP Output to the log collection configuration file
testlog.conf, URL => the Stream Load address in Doris.
- Since Logstash does not support HTTP redirection, you should use a backend address instead of a FE address.
- Authorization in the headers is
http basic auth. It is computed withecho -n 'username:password' | base64. - The
load_to_single_tabletin the headers can reduce the number of small files in data ingestion.
output {
    http {
       follow_redirects => true
       keepalive => false
       http_method => "put"
       url => "http://172.21.0.5:8640/api/logdb/logtable/_stream_load"
       headers => [
           "format", "json",
           "strip_outer_array", "true",
           "load_to_single_tablet", "true",
           "Authorization", "Basic cm9vdDo=",
           "Expect", "100-continue"
       ]
       format => "json_batch"
    }
}
Ingest via self-defined program
This is an example of ingesting data to Doris via HTTP Stream Load.
Notes:
- Use
basic authfor HTTP authorization, useecho -n 'username:password' | base64in computation http header "format:json": the data type is specified as JSONhttp header "read_json_by_line:true": each line is a JSON recordhttp header "load_to_single_tablet:true": write to one tablet each time- For the data writing clients, we recommend a batch size of 100MB~1GB. Future versions will enable Group Commit at the server end and reduce batch size from clients.
curl \
--location-trusted \
-u username:password \
-H "format:json" \
-H "read_json_by_line:true" \
-H "load_to_single_tablet:true" \
-T logfile.json \
http://fe_host:fe_http_port/api/log_db/log_table/_stream_load
Step 3: Execute Queries
Apache Doris supports standard SQL, so you can connect to Doris via MySQL client or JDBC and then execute SQL queries.
mysql -h fe_host -P fe_mysql_port -u root -Dlog_db
A few common queries in log analysis:
- Check the latest 10 records.
SELECT * FROM log_table ORDER BY ts DESC LIMIT 10;
- Check the latest 10 records of Client IP "8.8.8.8".
SELECT * FROM log_table WHERE clientip = '8.8.8.8' ORDER BY ts DESC LIMIT 10;
- Retrieve the latest 10 records with "error" or "404" in the "request" field. MATCH_ANY is a SQL syntax keyword for full-text search in Doris. It means to find the records that include any one of the specified keywords.
SELECT * FROM log_table WHERE request MATCH_ANY 'error 404' ORDER BY ts DESC LIMIT 10;
- Retrieve the latest 10 records with "image" and "faq" in the "request" field. MATCH_ALL is also a SQL syntax keyword for full-text search in Doris. It means to find the records that include all of the specified keywords.
SELECT * FROM log_table WHERE request MATCH_ALL 'image faq' ORDER BY ts DESC LIMIT 10;
Conclusion
If you are looking for an efficient log analytic solution, Apache Doris is friendly to anyone equipped with SQL knowledge; if you find friction with the ELK stack, try Apache Doris provides better schema-free support, enables faster data writing and queries, and brings much less storage burden.
But we won't stop here. We are going to provide more features to facilitate log analysis. We plan to add more complicated data types to inverted index, and support BKD index to make Apache Doris a fit for geo data analysis. We also plan to expand capabilities in semi-structured data analysis, such as working on the complex data types (Array, Map, Struct, JSON) and high-performance string matching algorithm. And we welcome any user feedback and development advice.

