
Apache Doris Be development and debugging
initial preparation work
This tutorial was conducted under Ubuntu 20.04
The name of the BE binary that appears in this doc is doris_be, which was palo_be in previous versions.
-
Download the doris source code
-
Install GCC 8.3.1+, Oracle JDK 1.8+, Python 2.7+, confirm that the gcc, java, python commands point to the correct version, and set the JAVA_HOME environment variable
-
Install other dependent packages
sudo apt install build-essential openjdk-8-jdk maven cmake byacc flex automake libtool-bin bison binutils-dev libiberty-dev zip unzip libncurses5-dev curl git ninja-build python brotli
sudo add-apt-repository ppa:ubuntu-toolchain-r/ppa
sudo apt update
sudo apt install gcc-10 g++-10
sudo apt-get install autoconf automake libtool autopoint
- install : openssl libssl-dev
sudo apt install -y openssl libssl-dev
Compile
The following steps are carried out in the /home/workspace directory
- download source
git clone https://github.com/apache/doris.git
cd doris
git submodule update --init --recursive
- Compile third-party dependency packages
 cd /home/workspace/doris/thirdparty
 ./build-thirdparty.sh
- Compile doris product code
cd /home/workspace/doris
./build.sh
Note: This compilation has the following instructions:
./build.sh  #Compile be and fe at the same time
./build.sh  --be #Only compile be
./build.sh  --fe #Only compilefe
./build.sh  --fe --be --clean#Delete and compile be fe at the same time
./build.sh  --fe  --clean#Delete and compile fe
./build.sh  --be  --clean#Delete and compile be
./build.sh  --be --fe  --clean#Delete and compile be fe at the same time
If nothing happens, the compilation should be successful, and the final deployment file will be output to the /home/workspace/doris/output/ directory. If you still encounter other problems, you can refer to the doris installation document http://doris.apache.org.
Note: If you want to specify the private maven repository address separately when compiling fe, you can set the environment variable USER_SETTINGS_MVN_REPO to specify the file path to settings.xml. Example:
export USER_SETTINGS_MVN_REPO="/xxx/xxx/settings.xml"
Deployment and debugging(GDB)
- Authorize be compilation result files
chmod /home/workspace/doris/output/be/lib/doris_be
Note: /home/workspace/doris/output/be/lib/doris_be is the executable file of be.
- Create a data storage directory
By viewing /home/workspace/doris/output/be/conf/be.conf
# INFO, WARNING, ERROR, FATAL
sys_log_level = INFO
be_port = 9060
be_rpc_port = 9070
webserver_port = 8040
heartbeat_service_port = 9050
brpc_port = 8060
arrow_flight_sql_port = -1

# Note that there should be at most one ip that matches this list.
# If no ip matches this rule, it will choose one randomly.
# use CIDR format, e.g. 10.10.10.0/
# Default value is empty.
priority_networks = 192.168.59.0/24 # data root path, separate by ';'
storage_root_path = /soft/be/storage
# sys_log_dir = ${PALO_HOME}/log
# sys_log_roll_mode = SIZE-MB-
# sys_log_roll_num =
# sys_log_verbose_modules =
# log_buffer_level = -
# palo_cgroups
Need to create this folder, this is where the be data is stored
mkdir -p /soft/be/storage
-
Open vscode, and open the directory where the be source code is located. In this case, open the directory as /home/workspace/doris/,For details on how to operate vscode, refer to the online tutorial
-
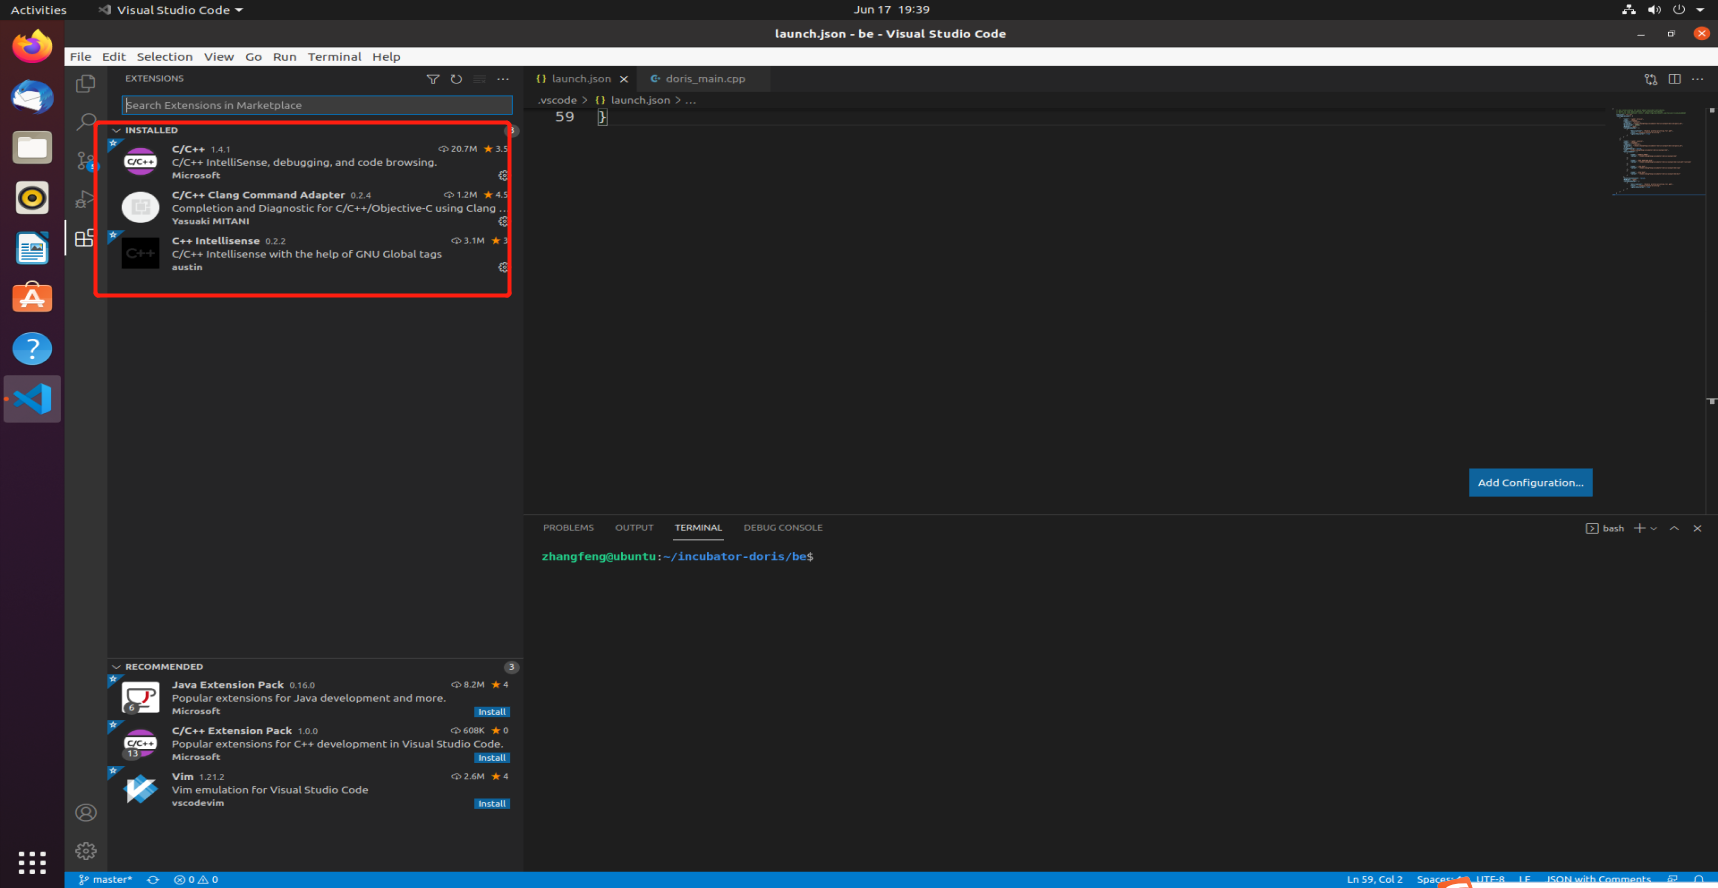
Install the vscode ms c++ debugging plug-in, the plug-in identified by the red box in the figure below
- Create a launch.json file, the content of the file is as follows:
{
    "version": "0.2.0",
    "configurations": [
        {
            "name": "(gdb) Launch",
            "type": "cppdbg",
            "request": "launch",
            "program": "/home/workspace/doris/output/be/lib/doris_be",
            "args": [],
            "stopAtEntry": false,
            "cwd": "/home/workspace/doris/",
            "environment": [{"name":"PALO_HOME","value":"/home/workspace/doris/output/be/"},
                            {"name":"UDF_RUNTIME_DIR","value":"/home/workspace/doris/output/be/lib/udf-runtime"},
                            {"name":"LOG_DIR","value":"/home/workspace/doris/output/be/log"},
                            {"name":"PID_DIR","value":"/home/workspace/doris/output/be/bin"}
                           ],
            "externalConsole": true,
            "MIMode": "gdb",
            "miDebuggerPath": "/path/to/gdb",
            "setupCommands": [
                {
                    "description": "Enable pretty-printing for gdb",
                    "text": "-enable-pretty-printing",
                    "ignoreFailures": true
                }
            ]
        }
    ]
}
Among them, environment defines several environment variables DORIS_HOME UDF_RUNTIME_DIR LOG_DIR PID_DIR, which are the environment variables needed when doris_be is running. If it is not set, the startup will fail
MiDebuggerPath specifies the path of the debugger (such as gdb). If miDebuggerPath is not specified, it will search for gdb path in the PATH variable of the os. The gdb version that comes with the system can be too low, you may need to manually specify the new version of gdb path.
Note: If you want attach (additional process) debugging, the configuration code is as follows:
{
    "version": "0.2.0",
    "configurations": [
      	{
          "name": "(gdb) Launch",
          "type": "cppdbg",
          "request": "attach",
          "program": "/home/workspace/doris/output/lib/doris_be",
          "processId":,
          "MIMode": "gdb",
          "miDebuggerPath": "/path/to/gdb",
          "internalConsoleOptions":"openOnSessionStart",
          "setupCommands": [
                {
                    "description": "Enable pretty-printing for gdb",
                    "text": "-enable-pretty-printing",
                    "ignoreFailures": true
                }
            ]
        }
    ]
}
In the configuration "request": "attach", "processId": PID, these two configurations are the key points: set the debug mode of gdb to attach and attach the processId of the process, otherwise it will fail. The command below can directly extract the pid of doris' BE:
lsof -i | grep -m 1 doris_be | awk "{print $2}"
Or write "processId": "${command:pickProcess}" to specify the pid when starting attach.
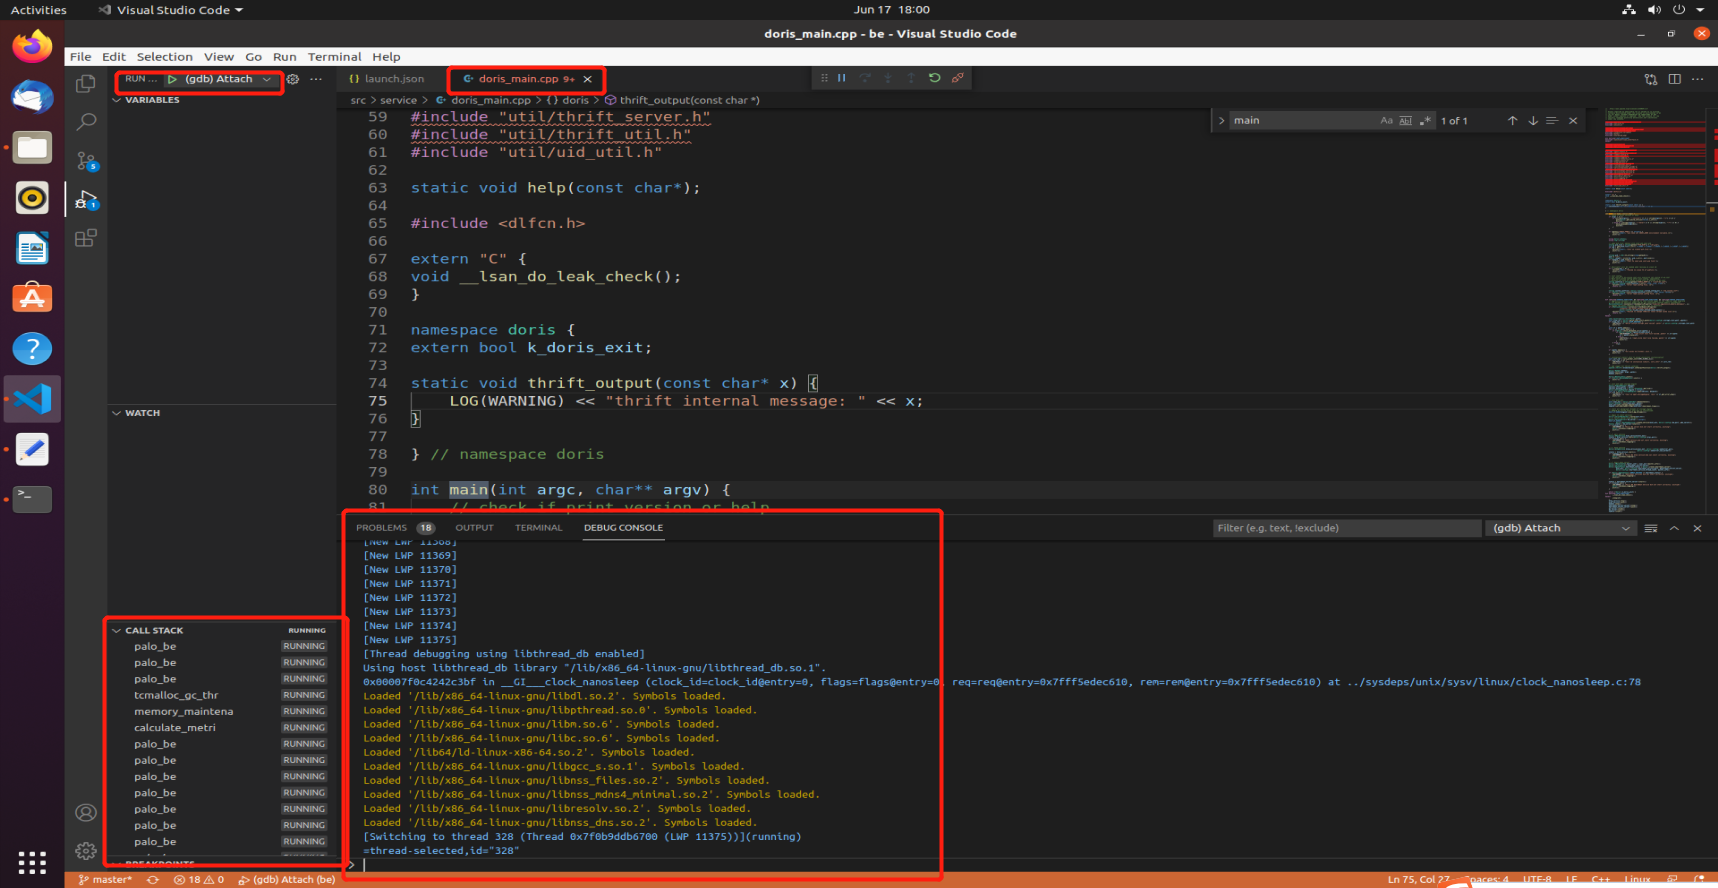
As shown in the figure:

Among them, 15200 is the process id of the currently running be.
An example of a complete launch.json is as follows:
 {
    "version": "0.2.0",
    "configurations": [
        {
            "name": "(gdb) Attach",
            "type": "cppdbg",
            "request": "attach",
            "program": "/home/workspace/doris/output/be/lib/doris_be",
            "processId": 17016,
            "MIMode": "gdb",
            "miDebuggerPath": "/path/to/gdb",
            "setupCommands": [
                {
                    "description": "Enable pretty-printing for gdb",
                    "text": "-enable-pretty-printing",
                    "ignoreFailures": true
                }
            ]
        },
        {
            "name": "(gdb) Launch",
            "type": "cppdbg",
            "request": "launch",
            "program": "/home/workspace/doris/output/be/lib/doris_be",
            "args": [],
            "stopAtEntry": false,
            "cwd": "/home/workspace/doris/output/be",
            "environment": [
                {
                    "name": "DORIS_HOME",
                    "value": "/home/workspace/doris/output/be"
                },
                {
                    "name": "UDF_RUNTIME_DIR",
                    "value": "/home/workspace/doris/output/be/lib/udf-runtime"
                },
                {
                    "name": "LOG_DIR",
                    "value": "/home/workspace/doris/output/be/log"
                },
                {
                    "name": "PID_DIR",
                    "value": "/home/workspace/doris/output/be/bin"
                }
            ],
            "externalConsole": false,
            "MIMode": "gdb",
            "miDebuggerPath": "/path/to/gdb",
            "setupCommands": [
                {
                    "description": "Enable pretty-printing for gdb",
                    "text": "-enable-pretty-printing",
                    "ignoreFailures": true
                }
            ]
        }
    ]
}
-
Click to debug
You can start your debugging journey with the rest,
Debugging(LLDB)
lldb's attach mode is faster than gdb,and the usage is similar to gdb. we should install plugin CodeLLDB, then add config to launch:
{
    "name": "CodeLLDB attach",
    "type": "lldb",
    "request": "attach",
    "program": "${workspaceFolder}/output/be/lib/doris_be",
    "pid":"${command:pickMyProcess}"
}
It should be noted that this method requires the system glibc version to be 2.18+. you can refer Get VSCode CodeLLDB plugin work on CentOS 7 to make plugin work.
Debugging core dump files
Sometimes we need to debug the core files generated by a crash, which can also be done in vscode, by adding the corresponding configuration item
"coreDumpPath": "/PATH/TO/CORE/DUMP/FILE"
and you're done.
Common debugging techniques
Function execution paths
When you are not familiar with the details of BE execution, you can trace function calls and find out the call chain using relevant tools such as perf. perf can be used in Debug Tool. At this point we can execute the sql statement to be traced on a larger table and then increase the sampling frequency (e.g., perf -F 999). Observe the results to get a rough idea of the critical path of sql execution at BE.
Debugging CRTP objects
BE code uses a lot of CRTP (singular recursive template pattern) in the base types in order to improve the efficiency of operation, which makes it impossible for the debugger to debug objects according to the derived types. In this case we can use GDB to solve this problem in this way:
Suppose we need to debug an object col of type IColumn and do not know its actual type, then we can:
set print object on # Output the object as a derived type
p *col.t # Use col.t in this case to get the exact type of col
p col.t->size() # You can use it according to the derived type, e.g. ColumnString we can call size()
......
Note: it is the pointer COW::t that has the effect of polymorphism and not the IColumn class object, so we need to replace all uses of col with col.t in the GDB to actually get the derived type object.