Setting Up a BE Development and Debugging Environment with VSCode
This document describes how to compile, start, and debug Apache Doris BE using VSCode on Ubuntu 20.04, covering three debugging methods: GDB, LLDB, and core dump.
The BE binary is named
doris_be. In older versions it was namedpalo_be.
1. Prerequisites
-
Download the Doris source code: apache/doris on GitHub
-
Install the base toolchain: GCC 8.3.1+, Oracle JDK 1.8+, Python 2.7+. Verify that
gcc,java, andpythonpoint to the correct versions, and set theJAVA_HOMEenvironment variable. -
Install other dependencies:
sudo apt install build-essential openjdk-8-jdk maven cmake byacc flex automake libtool-bin bison binutils-dev libiberty-dev zip unzip libncurses5-dev curl git ninja-build python brotli
sudo add-apt-repository ppa:ubuntu-toolchain-r/ppa
sudo apt update
sudo apt install gcc-10 g++-10
sudo apt-get install autoconf automake libtool autopoint -
Install OpenSSL:
sudo apt install -y openssl libssl-dev
2. Compilation
The following steps are performed under the /home/workspace directory.
2.1 Download the Source Code
git clone https://github.com/apache/doris.git
cd doris
git submodule update --init --recursive
2.2 Compile Third-Party Dependencies
cd /home/workspace/doris/thirdparty
./build-thirdparty.sh
2.3 Compile Doris
cd /home/workspace/doris
./build.sh
build.sh supports the following combinations:
| Command | Description |
|---|---|
./build.sh | Compile both BE and FE |
./build.sh --be | Compile BE only |
./build.sh --fe | Compile FE only |
./build.sh --fe --be | Compile both BE and FE |
./build.sh --fe --be --clean | Clean, then compile both BE and FE |
./build.sh --fe --clean | Clean, then compile FE |
./build.sh --be --clean | Clean, then compile BE |
Build artifacts are output to the /home/workspace/doris/output/ directory. For problems, refer to the Doris official documentation.
When compiling FE, if you need to specify a private Maven repository, use the USER_SETTINGS_MVN_REPO environment variable to point to the settings.xml path:
export USER_SETTINGS_MVN_REPO="/xxx/xxx/settings.xml"
3. Deployment and Debugging (GDB)
3.1 Grant Execute Permission to the BE Binary
chmod +x /home/workspace/doris/output/be/lib/doris_be
/home/workspace/doris/output/be/lib/doris_be is the BE executable.
3.2 Create the Data Storage Directory
Check /home/workspace/doris/output/be/conf/be.conf:
# INFO, WARNING, ERROR, FATAL
sys_log_level = INFO
be_port = 9060
be_rpc_port = 9070
webserver_port = 8040
heartbeat_service_port = 9050
brpc_port = 8060
arrow_flight_sql_port = -1

# Note that there should at most one ip match this list.
# If no ip match this rule, will choose one randomly.
# use CIDR format, e.g. 10.10.10.0/
# Default value is empty.
priority_networks = 192.168.59.0/24 # data root path, separate by ';'
storage_root_path = /soft/be/storage
Create the data directory based on storage_root_path:
mkdir -p /soft/be/storage
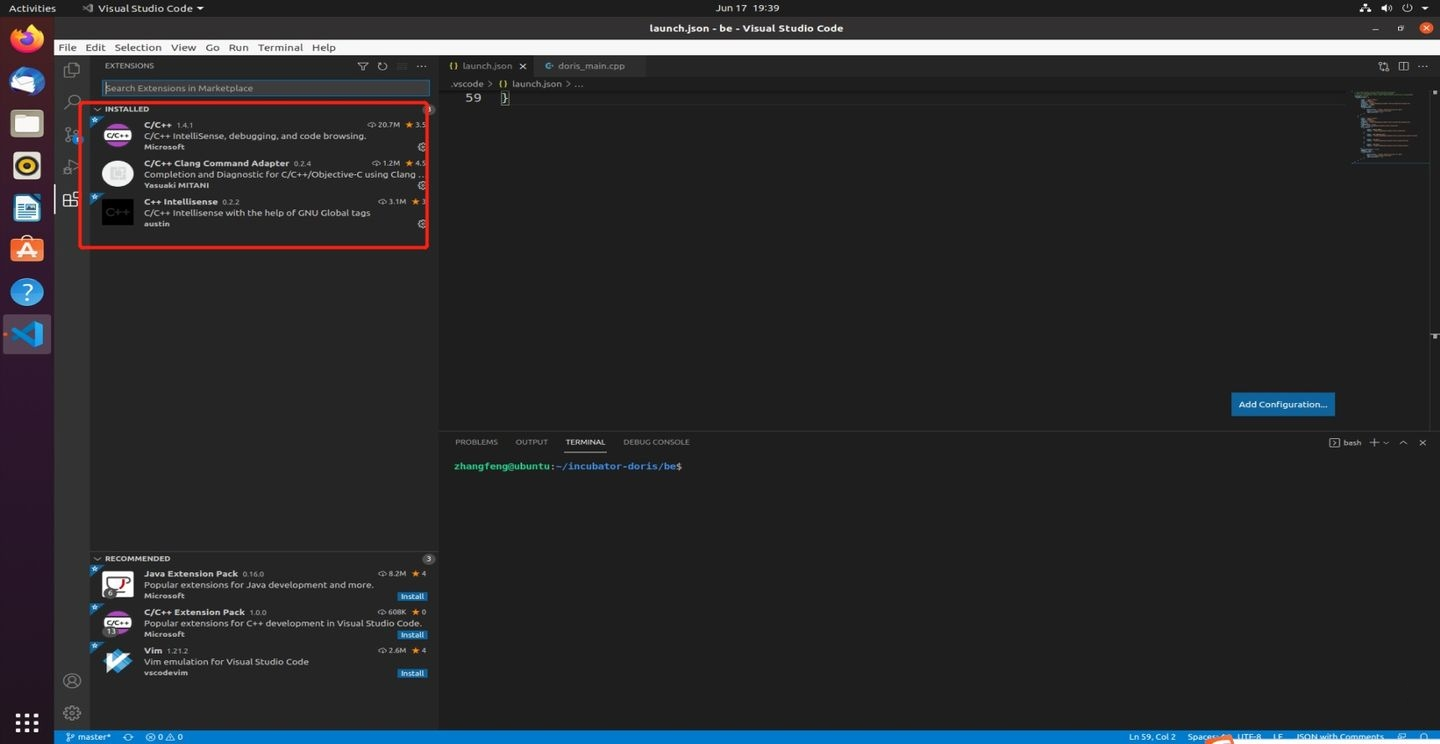
3.3 Open the Source Code and Install the Debugging Extension
-
Open the BE source code directory with VSCode (in this example,
/home/workspace/doris/). -
Install the VSCode C/C++ (ms-vscode.cpptools) debugging extension.
3.4 Create launch.json
Create a Launch-mode configuration in .vscode/launch.json:
{
    "version": "0.2.0",
    "configurations": [
        {
            "name": "(gdb) Launch",
            "type": "cppdbg",
            "request": "launch",
            "program": "/home/workspace/doris/output/be/lib/doris_be",
            "args": [],
            "stopAtEntry": false,
            "cwd": "/home/workspace/doris/",
            "environment": [
                {"name": "DORIS_HOME", "value": "/home/workspace/doris/output/be/"},
                {"name": "UDF_RUNTIME_DIR", "value": "/home/workspace/doris/output/be/lib/udf-runtime"},
                {"name": "LOG_DIR", "value": "/home/workspace/doris/output/be/log"},
                {"name": "PID_DIR", "value": "/home/workspace/doris/output/be/bin"}
            ],
            "externalConsole": true,
            "MIMode": "gdb",
            "miDebuggerPath": "/path/to/gdb",
            "setupCommands": [
                {
                    "description": "Enable pretty-printing for gdb",
                    "text": "-enable-pretty-printing",
                    "ignoreFailures": true
                }
            ]
        }
    ]
}
environment defines the environment variables required by doris_be at runtime. Startup fails if they are not set:
| Environment variable | Purpose |
|---|---|
DORIS_HOME | BE runtime root directory |
UDF_RUNTIME_DIR | UDF runtime directory |
LOG_DIR | Log directory |
PID_DIR | PID file directory |
miDebuggerPath specifies the debugger path (for example, gdb). If it is not specified, the system PATH is searched. The GDB version shipped with the system may be too old, so you may need to specify the path to a newer version manually.
3.5 Attach-Mode Debugging
To attach to a running BE process, use the following configuration:
{
    "version": "0.2.0",
    "configurations": [
        {
            "name": "(gdb) Launch",
            "type": "cppdbg",
            "request": "attach",
            "program": "/home/workspace/doris/output/lib/doris_be",
            "processId": "${command:pickProcess}",
            "MIMode": "gdb",
            "miDebuggerPath": "/path/to/gdb",
            "internalConsoleOptions": "openOnSessionStart",
            "setupCommands": [
                {
                    "description": "Enable pretty-printing for gdb",
                    "text": "-enable-pretty-printing",
                    "ignoreFailures": true
                }
            ]
        }
    ]
}
Key points:
-
"request": "attach": sets the debugging mode to attach. -
"processId": the PID of the process to attach to. It can be a specific number,"${command:pickProcess}"(select manually at startup), or extracted with the following command:lsof -i | grep -m 1 doris_be | awk "{print $2}"
In the image above,
15200is the current BE process ID.
3.6 Complete launch.json Example
The following is a complete configuration that includes both Launch and Attach modes:
{
    "version": "0.2.0",
    "configurations": [
        {
            "name": "(gdb) Attach",
            "type": "cppdbg",
            "request": "attach",
            "program": "/home/workspace/doris/output/be/lib/doris_be",
            "processId": 17016,
            "MIMode": "gdb",
            "miDebuggerPath": "/path/to/gdb",
            "setupCommands": [
                {
                    "description": "Enable pretty-printing for gdb",
                    "text": "-enable-pretty-printing",
                    "ignoreFailures": true
                }
            ]
        },
        {
            "name": "(gdb) Launch",
            "type": "cppdbg",
            "request": "launch",
            "program": "/home/workspace/doris/output/be/lib/doris_be",
            "args": [],
            "stopAtEntry": false,
            "cwd": "/home/workspace/doris/output/be",
            "environment": [
                {"name": "DORIS_HOME", "value": "/home/workspace/doris/output/be"},
                {"name": "UDF_RUNTIME_DIR", "value": "/home/workspace/doris/output/be/lib/udf-runtime"},
                {"name": "LOG_DIR", "value": "/home/workspace/doris/output/be/log"},
                {"name": "PID_DIR", "value": "/home/workspace/doris/output/be/bin"}
            ],
            "externalConsole": false,
            "MIMode": "gdb",
            "miDebuggerPath": "/path/to/gdb",
            "setupCommands": [
                {
                    "description": "Enable pretty-printing for gdb",
                    "text": "-enable-pretty-printing",
                    "ignoreFailures": true
                }
            ]
        }
    ]
}
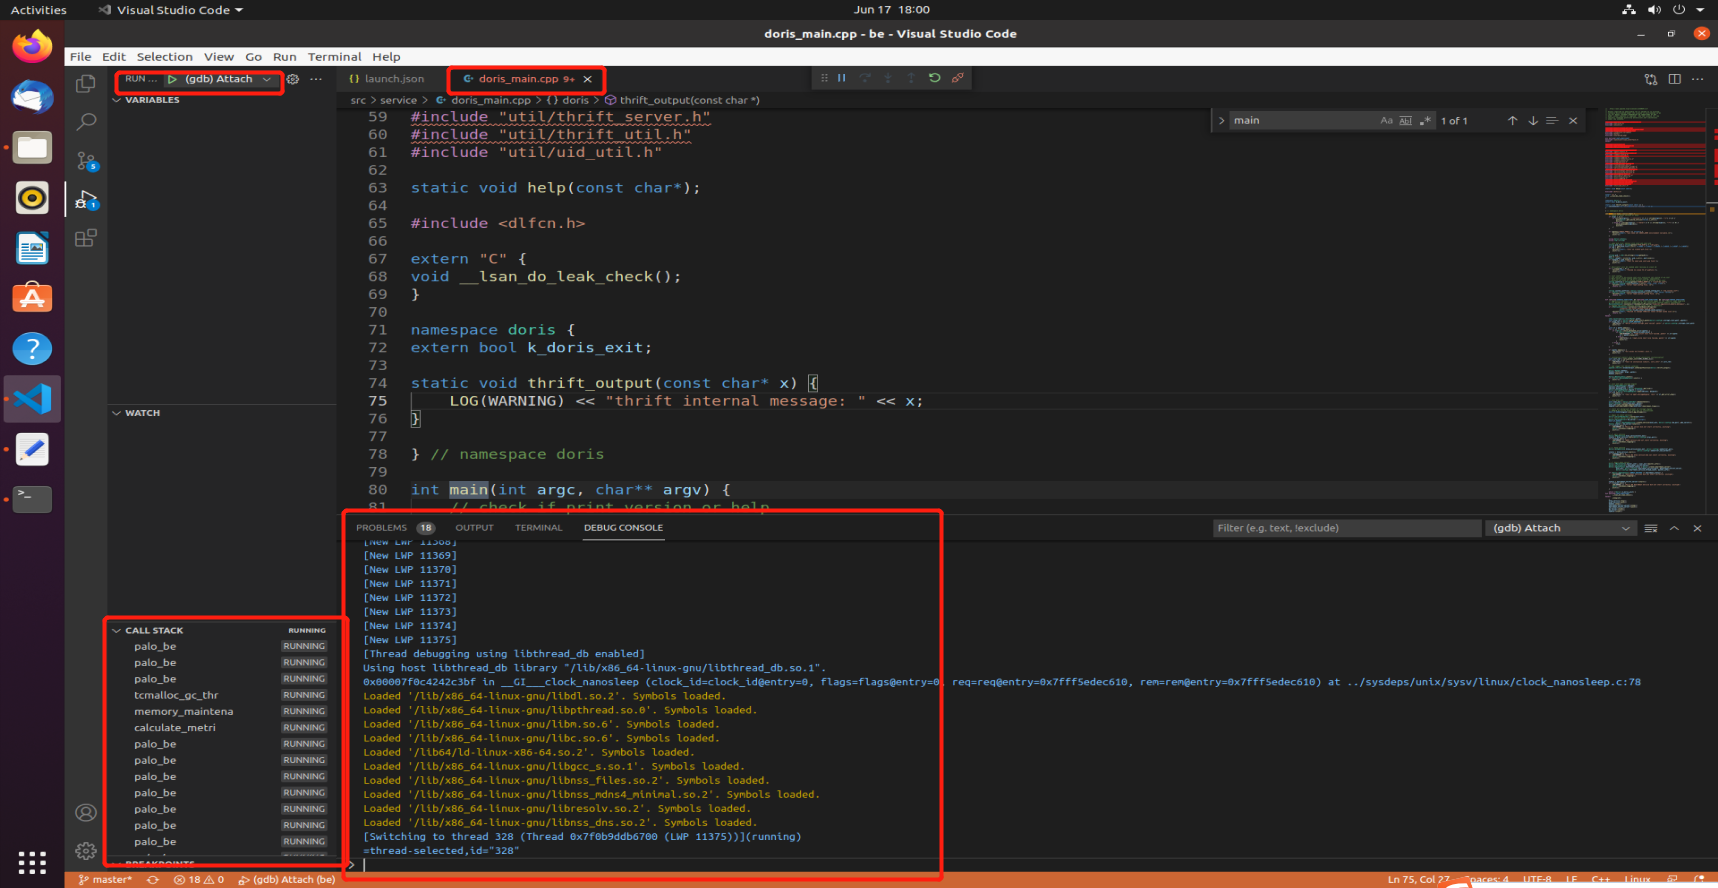
3.7 Start Debugging
Click the VSCode debug button to begin debugging Doris BE.
4. Debugging (LLDB)
LLDB attaches faster than GDB and is used in a similar way. The VSCode extension to install is CodeLLDB, then add the following configuration to launch.json:
{
    "name": "CodeLLDB attach",
    "type": "lldb",
    "request": "attach",
    "program": "${workspaceFolder}/output/be/lib/doris_be",
    "pid": "${command:pickMyProcess}"
}
This method requires the system glibc version to be 2.18+. If this is not satisfied, refer to How to make CodeLLDB work on CentOS7 to install a newer glibc and link it to the extension.
5. Debugging Core Dump Files
To debug a core file produced by a BE crash, add the following to the corresponding configuration entry:
"coreDumpPath": "/PATH/TO/CORE/DUMP/FILE"
6. Common Debugging Tips
6.1 Function Execution Path
When you are not familiar with the BE execution details, use tools such as perf to trace function calls and identify the call chain. For perf usage, see Debugging Tools.
Run the SQL you want to trace on a large table, then increase the sampling frequency (for example, perf -F 999). Observing the results gives a rough picture of the critical path of the SQL on BE.
6.2 Debugging CRTP Objects
To improve runtime efficiency, the BE code heavily uses CRTP (Curiously Recurring Template Pattern) in base types, which prevents the debugger from inspecting an object as its derived type. You can work around this in GDB as follows:
Suppose you need to debug an object col of type IColumn but do not know its actual type:
set print object on   # Print objects by derived type
p *col.t              # Use col.t to get the concrete type of col
p col.t->size()       # Use it as the derived type, for example, ColumnString supports size()
The polymorphic effect applies to the pointer COW::t, not the IColumn class object. You must replace every use of col with col.t in GDB to actually obtain the derived-type object.
7. Frequently Asked Questions (FAQ)
Q1: BE Exits Immediately After Startup
Environment variables are not set, or paths do not exist. Verify that DORIS_HOME, LOG_DIR, PID_DIR, and UDF_RUNTIME_DIR are all set and that the corresponding directories have been created.
Q2: GDB Reports a Version Too Low or an Unsupported Feature
The GDB version shipped with the system is outdated. Install a newer GDB manually and specify it in miDebuggerPath.
Q3: CodeLLDB Fails to Load
The system glibc version is lower than 2.18. Refer to the link in section 4 to resolve this.
Q4: Maven Fails to Reach the External Network When Compiling FE
Set the USER_SETTINGS_MVN_REPO environment variable to point to the settings.xml of a private Maven repository. See the tip in section 2.3.