
Debugging Tools
During Doris usage and development, debugging is often necessary. This document introduces commonly used debugging tools and methods.
Note: The BE binary file name doris_be mentioned in this document was palo_be in earlier versions.
FE Debugging
FE is a Java process. Below are some commonly used Java debugging commands.
1. Memory Usage Statistics
jmap -histo:live pid > 1.jmp
This command lists the memory usage of live objects sorted by size (replace pid with the FE process ID).
 num     #instances         #bytes  class name
----------------------------------------------
   1:         33528       10822024  [B
   2:         80106        8662200  [C
   3:           143        4688112  [Ljava.util.concurrent.ForkJoinTask;
   4:         80563        1933512  java.lang.String
   5:         15295        1714968  java.lang.Class
   6:         45546        1457472  java.util.concurrent.ConcurrentHashMap$Node
   7:         15483        1057416  [Ljava.lang.Object;
This method allows you to view the total memory occupied by live objects (at the end of the file) and analyze which objects consume more memory.
Note: This method triggers a FullGC due to the :live parameter.
2. JVM Memory Usage
jstat -gcutil pid 1000 1000
This command checks JVM memory usage in each region every second (replace pid with the FE process ID).
  S0     S1     E      O      M     CCS    YGC     YGCT    FGC    FGCT     GCT
  0.00   0.00  22.61   3.03  95.74  92.77     68    1.249     5    0.794    2.043
  0.00   0.00  22.61   3.03  95.74  92.77     68    1.249     5    0.794    2.043
  0.00   0.00  22.61   3.03  95.74  92.77     68    1.249     5    0.794    2.043
  0.00   0.00  22.92   3.03  95.74  92.77     68    1.249     5    0.794    2.043
  0.00   0.00  22.92   3.03  95.74  92.77     68    1.249     5    0.794    2.043
Focus on the Old generation (O) percentage (3.03% in the example). High usage may lead to OOM or FullGC.
3. Print FE Thread Stack
jstack -l pid > 1.js
This command prints the current FE thread stack (replace pid with the FE process ID).
The -l parameter also detects deadlocks. This method can be used to view FE thread execution status, detect deadlocks, and locate blocking positions.
BE Debugging
Memory Debugging
Memory debugging focuses on two aspects:
- Memory usage reasonability: Excessive memory usage may indicate memory leaks or improper memory usage.
- Memory access legality: Detecting memory overflows, illegal access, accessing invalid addresses, or using uninitialized memory.
The following tools can be used for tracking and analysis.
Doris Debug Tools
Doris Debug Tools provides packaged CPU flame graph and memory analysis tools that can be downloaded and used directly.
Note: Unofficial tool, for development and debugging purposes only.
Jemalloc Heap Profile
Note: Doris 1.2.2 and later versions use Jemalloc as the default memory allocator.
For Heap Profiling principles, refer to Heap Profiling Principle Explanation. Note that Heap Profile records virtual memory.
Jemalloc supports both real-time and periodic Heap Dump methods, then uses the jeprof tool to parse the generated Heap Profile.
1. Real-time Heap Dump (for analyzing real-time memory)
In be.conf, change prof:false to prof:true and prof_active:false to prof_active:true in JEMALLOC_CONF, then restart Doris BE. Use the Jemalloc Heap Dump HTTP interface to generate Heap Profile files on the BE machine.
Version Notes:
- Doris 2.1.8, 3.0.4 and later:
profis alreadytrueby default inJEMALLOC_CONF, no modification needed.- Before Doris 2.1.8 and 3.0.4:
JEMALLOC_CONFdoesn't haveprof_activeoption, just changeprof:falsetoprof:true.
curl http://be_host:be_webport/jeheap/dump
Configuration:
- Heap Profile directory: Configure via
jeprofile_dirinbe.conf, defaults to${DORIS_HOME}/log. - Sampling interval: Defaults to 512KB, typically recording ~10% of memory with <10% performance impact. Modify
lg_prof_sampleinJEMALLOC_CONF(default19, i.e., 2^19 B = 512KB). Decreasinglg_prof_sampleincreases sampling frequency for more accurate profiles but higher overhead.
Performance tip: Keep prof:false during performance testing to avoid Heap Dump overhead.
2. Periodic Heap Dump (for long-term memory observation)
Change prof:false to prof:true in JEMALLOC_CONF in be.conf. Heap Profile files default to ${DORIS_HOME}/log with prefix specified by JEMALLOC_PROF_PRFIX (default jemalloc_heap_profile_).
Note: Before Doris 2.1.6,
JEMALLOC_PROF_PRFIXwas empty and needs to be set.
Dump triggers:
-
Dump after cumulative memory allocation
Change
lg_prof_intervalto34inJEMALLOC_CONFto dump after cumulative 16GB allocation (2^34 B = 16GB).Note: Before Doris 2.1.6,
lg_prof_intervaldefaulted to32. -
Dump on memory peak
Change
prof_gdumptotrueinJEMALLOC_CONFand restart BE. -
Dump on exit and detect leaks
Change
prof_leakandprof_finaltotrueinJEMALLOC_CONFand restart BE. -
Dump cumulative (growth) instead of real-time values
Change
prof_accumtotrueinJEMALLOC_CONFand restart BE. Usejeprof --alloc_spaceto display cumulative heap dump.
3. Parse Heap Profile with jeprof
Use be/bin/jeprof to parse dumped Heap Profiles. Parsing may take minutes for large memory processes.
If jeprof binary is missing from be/bin, upload jeprof from doris/tools directory.
Notes:
- Requires addr2line version 2.35.2+, see QA-1 below.
- Execute Heap Dump and
jeprofparsing on the same machine running Doris BE, see QA-2 below.
1. Analyze single Heap Profile
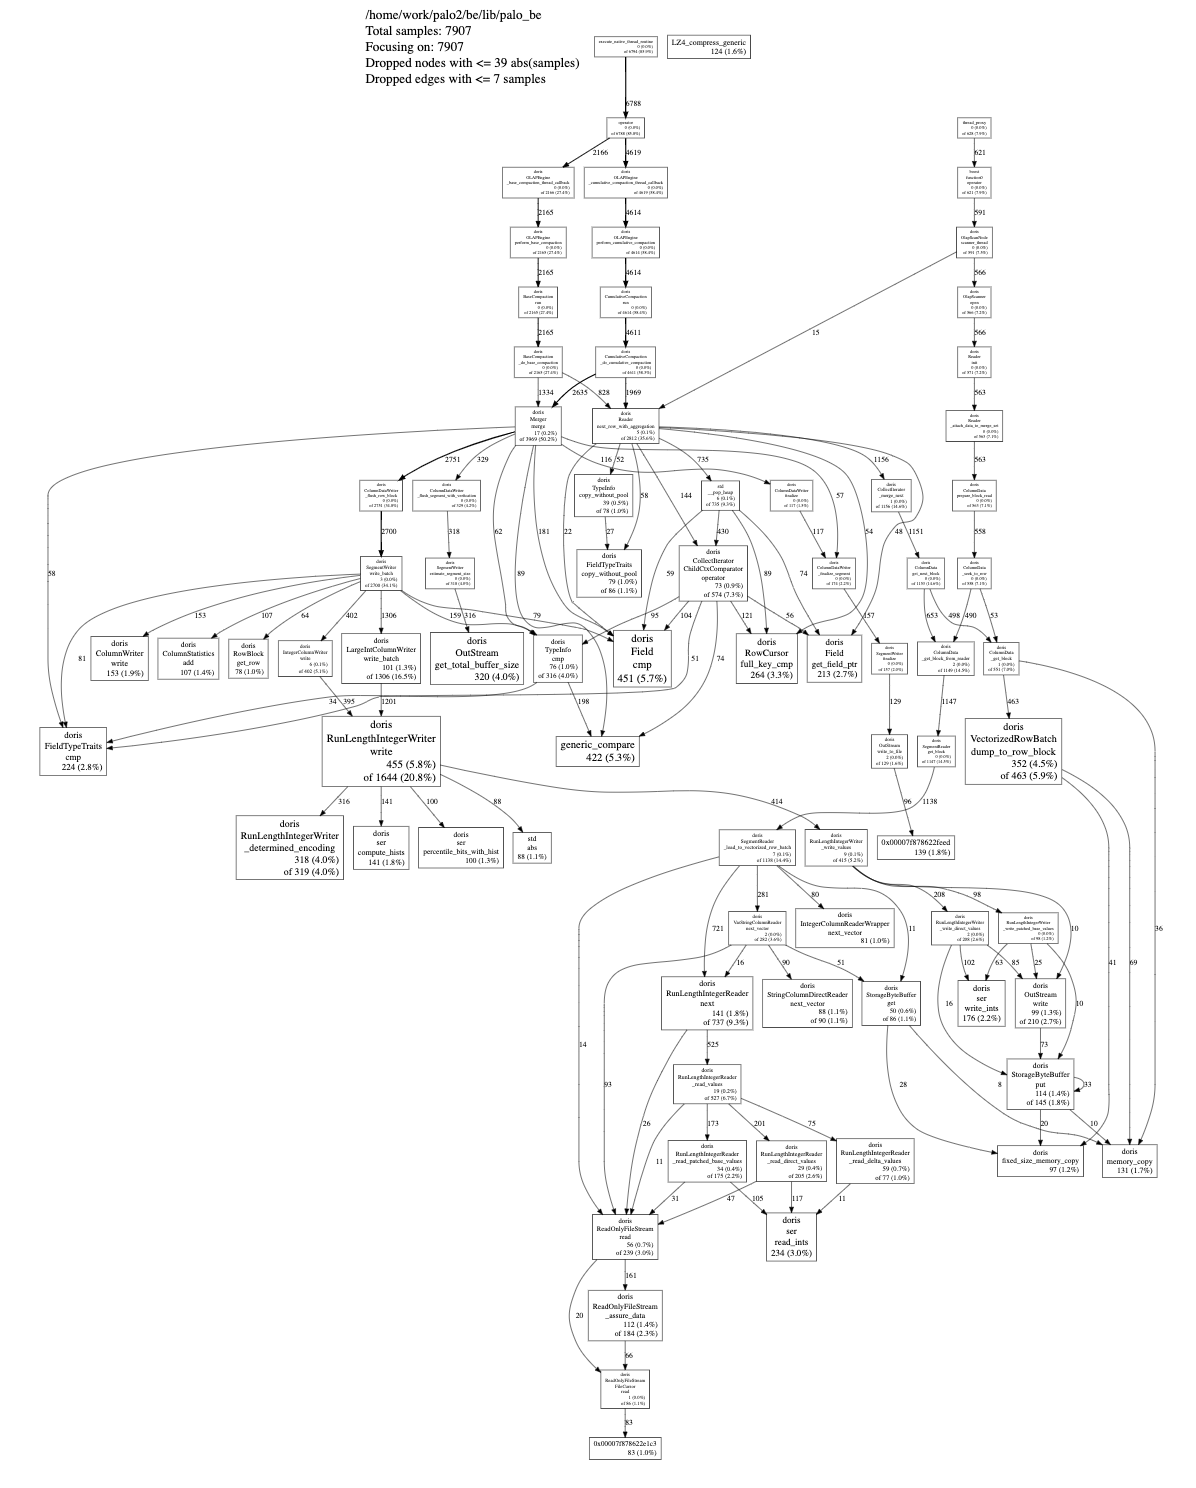
jeprof --dot ${DORIS_HOME}/lib/doris_be ${DORIS_HOME}/log/profile_file
Paste terminal output to online dot visualization to generate memory allocation diagram.
To generate PDF directly (requires dependencies):
yum install ghostscript graphviz
jeprof --pdf ${DORIS_HOME}/lib/doris_be ${DORIS_HOME}/log/profile_file > result.pdf
2. Analyze diff between two Heap Profiles
jeprof --dot ${DORIS_HOME}/lib/doris_be --base=${DORIS_HOME}/log/profile_file ${DORIS_HOME}/log/profile_file2
Compare heap files from different times to analyze diff by using earlier file as baseline.
4. Common Issues (QA)
QA-1: Errors after running jeprof: addr2line: Dwarf Error: found dwarf version xxx, this reader only handles version xxx
GCC 11+ defaults to DWARF-v5, requiring Binutils 2.35.2+. Doris Ldb_toolchain uses GCC 11.
Solution: Upgrade addr2line to 2.35.2.
# Download addr2line source
wget https://ftp.gnu.org/gnu/binutils/binutils-2.35.tar.bz2

# Install dependencies if needed
yum install make gcc gcc-c++ binutils

# Compile & install addr2line
tar -xvf binutils-2.35.tar.bz2
cd binutils-2.35
./configure --prefix=/usr/local
make
make install

# Verify
addr2line -h

# Replace addr2line
chmod +x addr2line
mv /usr/bin/addr2line /usr/bin/addr2line.bak
mv /bin/addr2line /bin/addr2line.bak
cp addr2line /bin/addr2line
cp addr2line /usr/bin/addr2line
hash -r
Note: Don't use addr2line 2.3.9, which may be incompatible and cause memory growth.
QA-2: Errors after running jeprof: addr2line: DWARF error: invalid or unhandled FORM value: 0x25, parsed heap stacks show memory addresses instead of function names
Usually occurs when Heap Dump and jeprof parsing are on different servers, causing symbol table resolution failure.
Solution:
- Execute Dump Heap and
jeprofparsing on the same machine running Doris BE. - Or download
be/bin/doris_bebinary and Heap Profile to a machine with matching Linux kernel version and runjeprof.
QA-3: If heap stacks still show memory addresses instead of function names after parsing on the BE machine
Use this script for manual parsing. Modify these variables:
heap: Heap Profile filename.bin:be/bin/doris_bebinary filename.llvm_symbolizer: Path to llvm symbolizer, preferably the version used to compile the binary.
#!/bin/bash
## @brief
## @author zhoufei
## @email  gavineaglechou@gmail.com
## @date   2024-02-24-Sat

# 1. jeprof --dot ${bin} ${heap} > heap.dot to generate calling profile
# 2. find base addr and symbol
# 3. get addr to symble table with llvm-symbolizer
# 4. replace the addr with symbol

# heap file name
heap=jeheap_dump.1708694081.3443.945778264.heap
# binary name
bin=doris_be_aws.3.0.5
# path to llvm symbolizer
llvm_symbolizer=$HOME/opt/ldb-toolchain-16/bin/llvm-symbolizer
# output file name
out=out.dot
vaddr_baddr_symbol=vaddr_baddr_symbol.txt
program_name=doris_be

jeprof --dot ${bin} ${heap} > ${out}

baseaddr=$(grep ${program_name} ${heap} | head -n 1 | awk -F'-' '{print $1}')
echo "$baseaddr: ${baseaddr}"

function find_symbol() {
  local addr="$1"
  "${llvm_symbolizer}" --inlining --obj=${bin} ${addr} | head -n 1 | awk -F'(' '{print $1}'
}

if [ -f ${vaddr_baddr_symbol} ]; then
  cat ${vaddr_baddr_symbol} | while read vaddr baddr; do
    symbol=$(find_symbol ${baddr})
    echo "${vaddr} ${baddr} ${symbol}"
    sed -ri.orig "s/${vaddr}/${symbol}/g" ${out}
  done
else # recalculate the addr and
  grep -oP '0x(\d|[a-f])+' ${out} | xargs -I {} python -c "print('{}', '0x{:x}'.format({} - 0x${baseaddr}))" \
    | while read vaddr baddr; do
    symbol=$(find_symbol ${baddr})
    echo "${vaddr} ${baddr} ${symbol}"
    sed -ri.orig "s/${vaddr}/${symbol}/g" ${out}
  done | tee ${vaddr_baddr_symbol}
fi

# vim: et tw=80 ts=2 sw=2 cc=80:
QA-4: If none of the above methods work
- Try recompiling
be/bin/doris_beon the BE machine to compile, run, and parse on the same machine. - If heap stacks still show addresses, try compiling with TCMalloc using
USE_JEMALLOC=OFF ./build.sh --be, then use TCMalloc Heap Profile as described below.
TCMalloc Heap Profile
Note: Doris 1.2.1 and earlier use TCMalloc. Doris 1.2.2+ default to Jemalloc. To switch back to TCMalloc, compile with
USE_JEMALLOC=OFF sh build.sh --be.
When using TCMalloc, large memory allocations print stacks to be.out:
tcmalloc: large alloc 1396277248 bytes == 0x3f3488000 @ 0x2af6f63 0x2c4095b 0x134d278 0x134bdcb 0x133d105 0x133d1d0 0x19930ed
This indicates Doris BE attempted to allocate 1396277248 bytes at this stack. Use addr2line to convert to readable information:
addr2line -e lib/doris_be 0x2af6f63 0x2c4095b 0x134d278 0x134bdcb 0x133d105 0x133d1d0 0x19930ed
Output example:
/home/ssd0/zc/palo/doris/core/thirdparty/src/gperftools-gperftools-2.7/src/tcmalloc.cc:1335
/home/ssd0/zc/palo/doris/core/thirdparty/src/gperftools-gperftools-2.7/src/tcmalloc.cc:1357
/home/disk0/baidu-doris/baidu/bdg/doris-baidu/core/be/src/exec/hash_table.cpp:267
/home/disk0/baidu-doris/baidu/bdg/doris-baidu/core/be/src/exec/hash_table.hpp:86
/home/disk0/baidu-doris/baidu/bdg/doris-baidu/core/be/src/exec/hash_join_node.cpp:239
/home/disk0/baidu-doris/baidu/bdg/doris-baidu/core/be/src/exec/hash_join_node.cpp:213
thread.cpp:?
Sometimes memory issues come from accumulating small allocations, not visible in logs. Use TCMalloc's HEAP PROFILE feature. Set HEAPPROFILE environment variable before starting Doris BE:
export TCMALLOC_SAMPLE_PARAMETER=64000 HEAP_PROFILE_ALLOCATION_INTERVAL=-1 HEAP_PROFILE_INUSE_INTERVAL=-1 HEAP_PROFILE_TIME_INTERVAL=5 HEAPPROFILE=/tmp/doris_be.hprof
./bin/start_be.sh --daemon
Note: HEAPPROFILE requires absolute path, and directory must exist.
When HEAPPROFILE dump conditions are met, memory usage writes to specified file. Use pprof tool to analyze output.
pprof --text lib/doris_be /tmp/doris_be.hprof.0012.heap | head -30
Output example:
Using local file lib/doris_be.
Using local file /tmp/doris_be.hprof.0012.heap.
Total: 668.6 MB
   610.6  91.3%  91.3%    610.6  91.3% doris::SystemAllocator::allocate_via_malloc (inline)
    18.1   2.7%  94.0%     18.1   2.7% _objalloc_alloc
     5.6   0.8%  94.9%     63.4   9.5% doris::RowBatch::RowBatch
     5.1   0.8%  95.6%      7.1   1.1% butil::ResourcePool::add_block (inline)
     3.7   0.5%  96.2%      3.7   0.5% butil::iobuf::create_block (inline)
     3.4   0.5%  96.7%      3.4   0.5% butil::FlatMap::init
     3.2   0.5%  97.2%      5.2   0.8% butil::ObjectPool::add_block (inline)
     2.6   0.4%  97.6%      2.6   0.4% __gnu_cxx::new_allocator::allocate (inline)
     2.0   0.3%  97.9%      2.0   0.3% butil::ObjectPool::add_block_group (inline)
     2.0   0.3%  98.2%      2.0   0.3% butil::ResourcePool::add_block_group (inline)
     1.7   0.3%  98.4%      1.7   0.3% doris::SegmentReader::_load_index
Column meanings:
- Column 1: Memory directly allocated by function (MB).
- Column 2: Percentage of column 1.
- Column 3: Cumulative value of column 2.
- Column 4: Total memory occupied by function and all called functions (MB).
- Column 5: Percentage of column 4.
Generate call relationship graph in SVG format:
pprof --svg lib/doris_be /tmp/doris_be.hprof.0012.heap > heap.svg
Performance tip: This option affects performance. Use cautiously on production instances.
pprof Remote Server
HEAP PROFILE has limitations: 1. Requires BE restart; 2. Continuous enabling impacts performance.
Doris BE supports dynamic heap profiling. Doris supports GPerftools remote server debugging. Use pprof to dynamically profile remote running Doris BE. Example for viewing memory usage increment:
pprof --text --seconds=60 http://be_host:be_webport/pprof/heap
Output example:
Total: 1296.4 MB
   484.9  37.4%  37.4%    484.9  37.4% doris::StorageByteBuffer::create
   272.2  21.0%  58.4%    273.3  21.1% doris::RowBlock::init
   157.5  12.1%  70.5%    157.5  12.1% doris::RowBatch::RowBatch
    90.7   7.0%  77.5%     90.7   7.0% doris::SystemAllocator::allocate_via_malloc
    66.6   5.1%  82.7%     66.6   5.1% doris::IntegerColumnReader::init
    47.9   3.7%  86.4%     47.9   3.7% __gnu_cxx::new_allocator::allocate
    20.8   1.6%  88.0%     35.4   2.7% doris::SegmentReader::_load_index
    12.7   1.0%  89.0%     12.7   1.0% doris::DecimalColumnReader::init
    12.7   1.0%  89.9%     12.7   1.0% doris::LargeIntColumnReader::init
    12.7   1.0%  90.9%     12.7   1.0% doris::StringColumnDirectReader::init
    12.3   0.9%  91.9%     12.3   0.9% std::__cxx11::basic_string::_M_mutate
    10.4   0.8%  92.7%     10.4   0.8% doris::VectorizedRowBatch::VectorizedRowBatch
    10.0   0.8%  93.4%     10.0   0.8% doris::PlainTextLineReader::PlainTextLineReader
Output and viewing method match HEAP PROFILE. This command only enables statistics during execution, causing less performance impact than HEAP PROFILE.
LSAN (Memory Leak Detection)
LSAN is an address checking tool integrated in GCC. Enable during compilation to activate this feature. When determinable memory leaks occur, leak stacks are printed. Doris BE has integrated this tool. Compile with:
BUILD_TYPE=LSAN ./build.sh
When memory leaks are detected, corresponding information outputs to be.out. For demonstration, we intentionally inject a memory leak in the StorageEngine open function:
char* leak_buf = new char[1024];
strcpy(leak_buf, "hello world");
LOG(INFO) << leak_buf;
Then be.out shows:
=================================================================
==24732==ERROR: LeakSanitizer: detected memory leaks

Direct leak of 1024 byte(s) in 1 object(s) allocated from:
    #0 0xd10586 in operator new (unsigned long) ../../../../gcc-7.3.0/libsanitizer/lsan/lsan_interceptors.cc:164
    #1 0xe333a2 in doris::StorageEngine::open(doris::EngineOptions const&, doris::StorageEngine**) /home/ssd0/zc/palo/doris/core/be/src/olap/storage_engine.cpp:104
    #2 0xd3cc96 in main /home/ssd0/zc/palo/doris/core/be/src/service/doris_main.cpp:159
    #3 0x7f573b5eebd4 in __libc_start_main (/opt/compiler/gcc-4.8.2/lib64/libc.so.6+0x21bd4)

SUMMARY: LeakSanitizer: 1024 byte(s) leaked in 1 allocation(s).
Output shows 1024 bytes leaked with memory allocation stack trace.
Performance tip: This option affects performance. Use cautiously on production instances.
Note: Enabling LSAN automatically disables TCMalloc.
ASAN (Address Legality Detection)
Besides improper memory usage and leaks, illegal address access errors can occur. Use ASAN to find root causes. Like LSAN, ASAN is integrated in GCC. Compile Doris with:
BUILD_TYPE=ASAN ./build.sh
When abnormal access is detected, the binary exits immediately and outputs illegal access stack to be.out. ASAN output analysis uses the same method as LSAN. For demonstration, inject an address access error in the StorageEngine open function:
char* invalid_buf = new char[1024];
for (int i = 0; i < 1025; ++i) {
    invalid_buf[i] = i;
}
LOG(INFO) << invalid_buf;
Then be.out shows:
=================================================================
==23284==ERROR: AddressSanitizer: heap-buffer-overflow on address 0x61900008bf80 at pc 0x00000129f56a bp 0x7fff546eed90 sp 0x7fff546eed88
WRITE of size 1 at 0x61900008bf80 thread T0
    #0 0x129f569 in doris::StorageEngine::open(doris::EngineOptions const&, doris::StorageEngine**) /home/ssd0/zc/palo/doris/core/be/src/olap/storage_engine.cpp:106
    #1 0xe2c1e3 in main /home/ssd0/zc/palo/doris/core/be/src/service/doris_main.cpp:159
    #2 0x7fa5580fbbd4 in __libc_start_main (/opt/compiler/gcc-4.8.2/lib64/libc.so.6+0x21bd4)
    #3 0xd30794  (/home/ssd0/zc/palo/doris/core/output3/be/lib/doris_be+0xd30794)

0x61900008bf80 is located 0 bytes to the right of 1024-byte region [0x61900008bb80,0x61900008bf80)
allocated by thread T0 here:
    #0 0xdeb040 in operator new[](unsigned long) ../../../../gcc-7.3.0/libsanitizer/asan/asan_new_delete.cc:82
    #1 0x129f50d in doris::StorageEngine::open(doris::EngineOptions const&, doris::StorageEngine**) /home/ssd0/zc/palo/doris/core/be/src/olap/storage_engine.cpp:104
    #2 0xe2c1e3 in main /home/ssd0/zc/palo/doris/core/be/src/service/doris_main.cpp:159
    #3 0x7fa5580fbbd4 in __libc_start_main (/opt/compiler/gcc-4.8.2/lib64/libc.so.6+0x21bd4)

SUMMARY: AddressSanitizer: heap-buffer-overflow /home/ssd0/zc/palo/doris/core/be/src/olap/storage_engine.cpp:106 in doris::StorageEngine::open(doris::EngineOptions const&, doris::StorageEngine**)
This shows an attempted one-byte write to illegal address 0x61900008bf80, and the allocation stack for region [0x61900008bb80,0x61900008bf80).
Performance tip: This option affects performance. Use cautiously on production instances.
Note: Enabling ASAN automatically disables TCMalloc.
If be.out stack output lacks function symbols, manual processing is needed. Use the asan_symbolize script to parse ASAN output:
cat be.out | python asan_symbolize.py | c++filt
This command produces readable stack information.
CPU Debugging
When system CPU Idle is low, CPU is the main bottleneck. Analyze current CPU usage. For Doris BE, there are serveral methods to analyze CPU bottlenecks.
Doris Debug Tools
Doris Debug Tools provides packaged CPU flame graph and memory analysis tools that can be downloaded and used directly.
Note: Unofficial tool, for development and debugging purposes only.
pprof
pprof from gperftools converts gperftools output to readable formats like PDF, SVG, Text.
Since Doris has integrated and is compatible with GPerf REST interface, use pprof tool to analyze remote Doris BE:
pprof --svg --seconds=60 http://be_host:be_webport/pprof/profile > be.svg
This command generates a BE CPU consumption graph.
perf + FlameGraph
This is a very general CPU analysis method. Unlike pprof, this method requires login to the physical machine. But compared to pprof's timed sampling, perf can collect stack information through different events.
Tool introduction:
- perf: Linux kernel built-in performance analysis tool. Here are some perf usage examples.
- FlameGraph: Visualization tool to display perf output as flame graphs.
Usage:
perf record -g -p be_pid -- sleep 60
This command profiles BE CPU usage for 60 seconds and generates perf.data file. Analyze perf.data with perf command:
perf report
Analysis example:
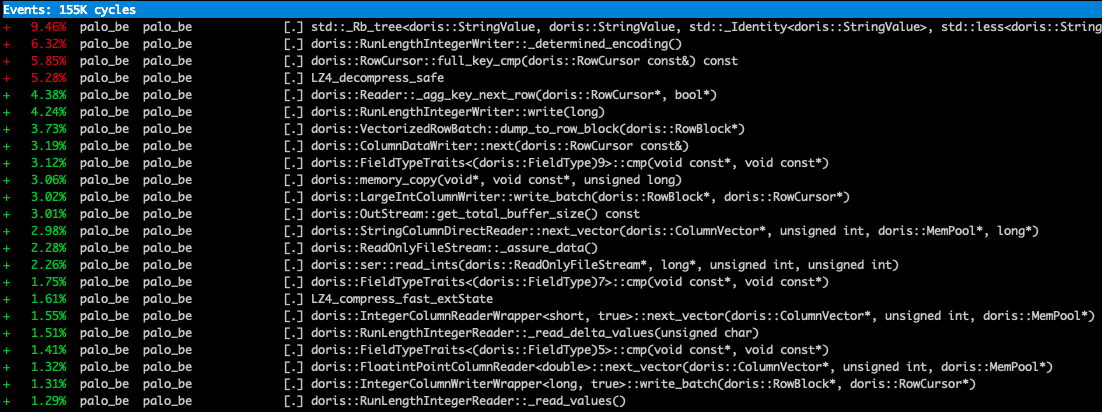
Or visualize with FlameGraph:
perf script | ./FlameGraph/stackcollapse-perf.pl | ./FlameGraph/flamegraph.pl > be.svg
This also generates a CPU consumption graph.
