Generate Flame Graphs with FE Profiler
Introduction
In Apache Doris 2.1.4 and later, the FE deployment directory ${DORIS_FE_HOME}/bin ships with a profile_fe.sh script. The script uses async-profiler to generate a flame graph of the FE so you can locate FE performance bottlenecks.
System Support
| System | Supported |
|---|---|
| Linux | Yes |
| macOS | Yes |
| Windows | Not yet |
Usage Steps
1. Run profile_fe.sh
# Profile the FE for 10 seconds by default and generate a flame graph
${DORIS_FE_HOME}/bin/profile_fe.sh

# Profile the FE for 30 seconds and generate a flame graph
PROFILE_SECONDS=30 ${DORIS_FE_HOME}/bin/profile_fe.sh
| Environment Variable | Meaning | Default |
|---|---|---|
PROFILE_SECONDS | async-profiler sampling duration (seconds) | 10 |
2. Trigger the Workload
After you run the command, async-profiler keeps sampling for the specified duration. During this period, send the target queries repeatedly to the FE so that async-profiler can capture stack frames along the target code paths.
3. View the Flame Graph
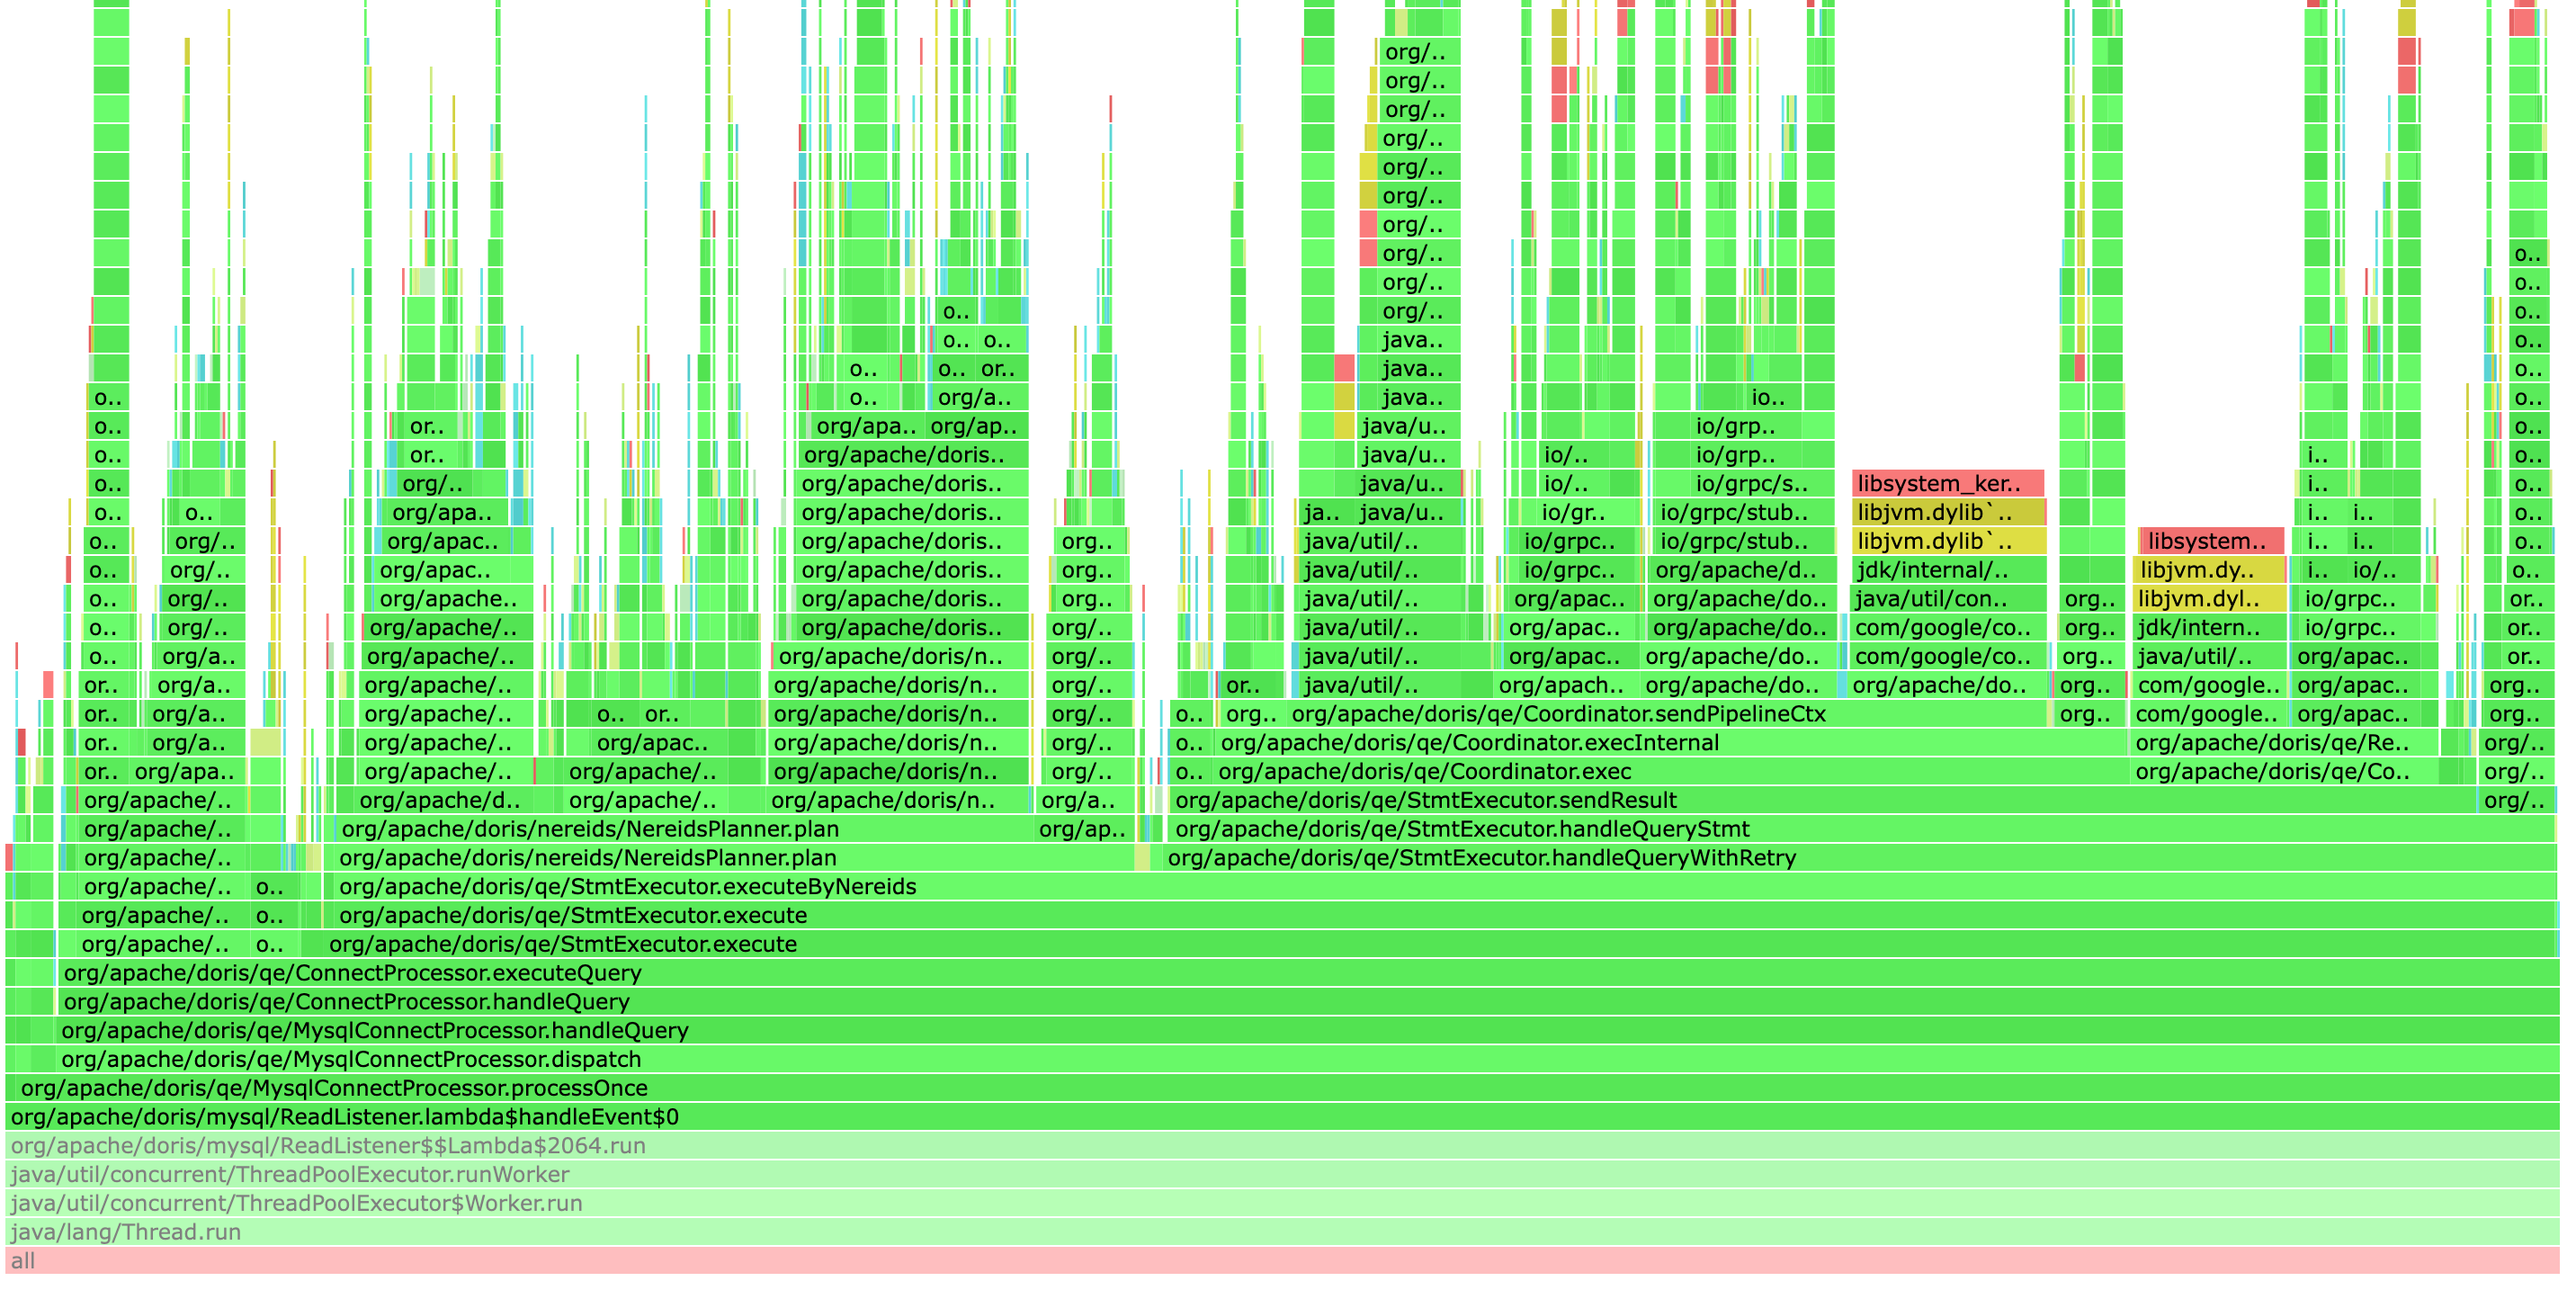
When sampling finishes, the script generates an HTML flame graph file in the ${DORIS_FE_HOME}/log directory. FE performance bottlenecks usually appear as "plateaus" (short and wide). Optimize the code corresponding to those stack frames.
Example flame graph:
Using async-profiler on Older FE Versions
For Doris versions earlier than 2.1.4, download the following two files manually:
- Download ap-loader-all-3.0-8.jar into the
${DORIS_FE_HOME}/libdirectory. - Download profile_fe.sh into the
${DORIS_FE_HOME}/bindirectory. - Run
profile_fe.shto generate the flame graph.
FAQ
Q: The flame graph does not contain stack frames for the target function during sampling.
The corresponding query path was usually not triggered during sampling. While profile_fe.sh is running, send the target SQL repeatedly by hand or with a script, or extend the sampling duration with PROFILE_SECONDS=30.
Q: How do you choose between FE Profiler and Arthas?
profile_fe.sh: a script-based approach with a fixed sampling duration, suitable for quickly generating a one-off flame graph.- Arthas: an interactive terminal that supports
trace,watch, and other finer-grained runtime observations, suitable for deeper investigation.