Pipeline Tracing
Introduction
In the Apache Doris Pipeline execution engine, the execution plan tree of each Instance is split into multiple Pipeline Tasks, which are scheduled and executed by a custom Pipeline scheduler. When the number of Pipeline Tasks is large, how these Tasks are scheduled across threads and CPU cores becomes an important factor that affects execution performance.
The Pipeline Tracing tool observes the scheduling process for a specific query or time period, making it easier to analyze performance and locate bottlenecks.
Usage Steps
1. Record Scheduling Data
Use HTTP interfaces to control whether and how a BE records the scheduling process. These settings only affect the target BE.
| Purpose | HTTP Command |
|---|---|
| Disable Pipeline Tracing recording | curl -X POST http://{be_host}:{http_port}/api/pipeline/tracing?type=disable |
| Produce one record per query | curl -X POST http://{be_host}:{http_port}/api/pipeline/tracing?type=perquery |
| Produce a tracing record over a fixed period | curl -X POST http://{be_host}:{http_port}/api/pipeline/tracing?type=periodic |
| Set the period length (in seconds) | curl -X POST http://{be_host}:{http_port}/api/pipeline/tracing?dump_interval=60 |
Command examples:
# Disable Pipeline Tracing recording
curl -X POST http://{be_host}:{http_port}/api/pipeline/tracing?type=disable

# Produce one record per query
curl -X POST http://{be_host}:{http_port}/api/pipeline/tracing?type=perquery

# Produce a tracing record over a fixed period
curl -X POST http://{be_host}:{http_port}/api/pipeline/tracing?type=periodic

# Set the period length to 60 seconds
curl -X POST http://{be_host}:{http_port}/api/pipeline/tracing?dump_interval=60
2. Convert the Data Format
The recorded data is written to the log/tracing directory of the corresponding BE. Use the conversion script in doris/tools/pipeline-tracing/ to convert the raw data into a JSON format that Perfetto can load:
cd doris/tools/pipeline-tracing/
python3 origin-to-show.py -s <SOURCE_FILE> -d <DEST>.json
Parameters:
| Parameter | Meaning |
|---|---|
-s <SOURCE_FILE> | Path to the raw tracing file generated by the BE |
-d <DEST>.json | Path to the output JSON file for visualization |
For more detailed usage, see the README.md file in that directory.
3. Visualize in Perfetto
-
Open Perfetto.
-
Click
Open trace fileand select the JSON file generated in the previous step. -
View the scheduling result:
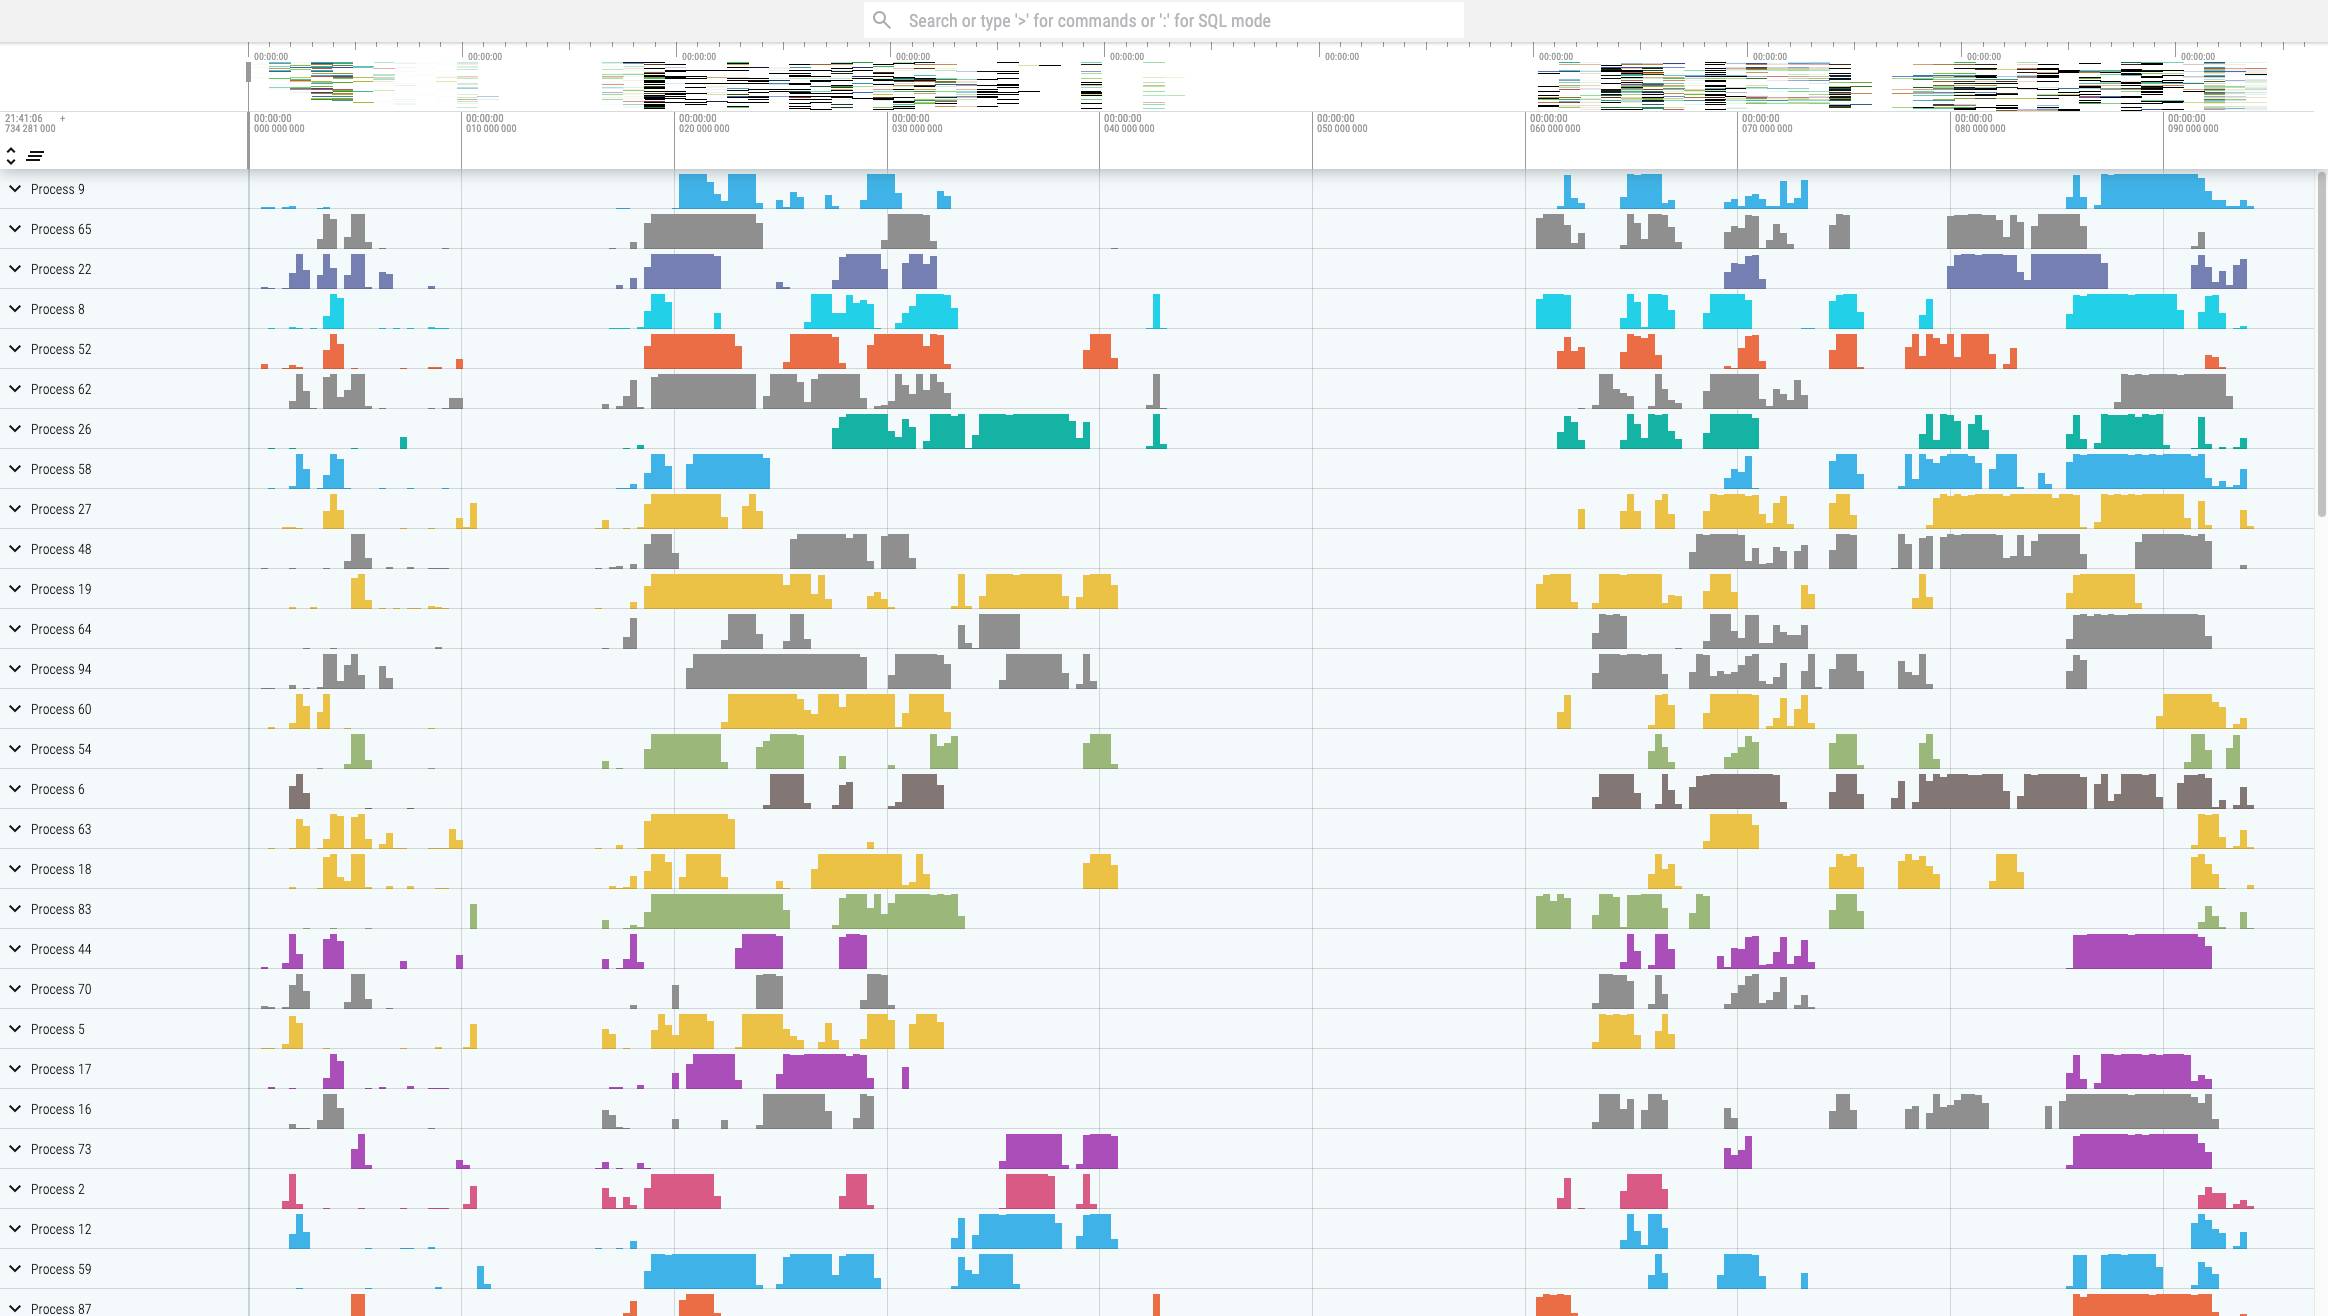
Perfetto can also show how the same Task is scheduled across CPU cores:

FAQ
Q: Where are the tracing files?
They are in the log/tracing directory of the corresponding BE. The file name contains a timestamp and query information.
Q: Does enabling Pipeline Tracing affect performance?
It introduces some overhead. Enable it only during scheduling investigation, and disable it with type=disable once the investigation is complete.