Monitoring and Alerting
This document describes how to build a complete monitoring system for an Apache Doris cluster: use Prometheus to collect the metrics exposed by FE and BE, use Grafana with the official dashboard template for visualization, and reserve an Alertmanager configuration entry for later alert integration.
Note: If you deploy a Doris compute-storage decoupled cluster on Kubernetes, see Deploy Prometheus and Grafana for the monitoring setup. The monitoring architecture, metric format, and dashboard descriptions in this document also apply.
Applicable Scenarios
| Scenario | Description |
|---|---|
| Integrating monitoring after cluster deployment | The Doris cluster is deployed, and you need to collect FE/BE runtime metrics and display them in charts. |
| Unified observability for multiple clusters | Monitor multiple Doris clusters simultaneously in the same Prometheus + Grafana setup. |
| Troubleshooting and performance tuning | Quickly locate abnormal nodes and bottlenecks through JVM, query, and Backend task dashboards. |
| Configuring alerts (planned) | Later, configure alert channels such as email and SMS based on Prometheus + Alertmanager. |
Prerequisites
- The Doris cluster is deployed, and the FE and BE processes are running normally.
- The HTTP port of FE (default
8030) and the Web Server port of BE (default8040) are reachable. - A server is available for running Prometheus and Grafana, with network connectivity to all FE/BE nodes.
- External network access is available to download installation packages and dashboard templates from the Prometheus and Grafana official websites.
Dashboard Template Download
Doris provides two Grafana dashboard templates. Pick the one that matches your cluster's storage mode and import it directly. The templates are updated periodically. For the update procedure, see Dashboard Update.
| Storage Mode | Dashboard Template | Notes |
|---|---|---|
| Shared-nothing | doris-grafana-dashboard.json | Traditional FE / BE deployment with local storage; panels cover FE and BE components. |
| Compute-storage decoupled | doris-grafana-dashboard-cloud.json | Panels cover FE, BE / Compute Group, and Meta Service; applies to both Kubernetes and non-Kubernetes deployments of compute-storage decoupled clusters. |
Contributions of better dashboards from the community are welcome.
Monitoring Architecture Overview
Doris uses Prometheus and Grafana to collect and display monitoring data.
| Component | Role |
|---|---|
| Prometheus | An open-source system monitoring and alerting suite. It collects metrics via Pull or Push and stores them in its own time-series database (TSDB), and provides a multi-dimensional data query language. |
| Grafana | An open-source data analytics and visualization platform. It supports multiple time-series data sources, including Prometheus, and displays data as charts through configurable dashboards. |
| Alertmanager | The Prometheus alerting component, deployed separately. It can be configured with alert policies such as email and SMS (not covered in this document; refer to the official documentation). |
Note: This document only provides one way to collect and display Doris monitoring data using Prometheus and Grafana. In principle, Doris does not develop or maintain these components. For more details about these components, refer to their official documentation.
Data Flow Diagram
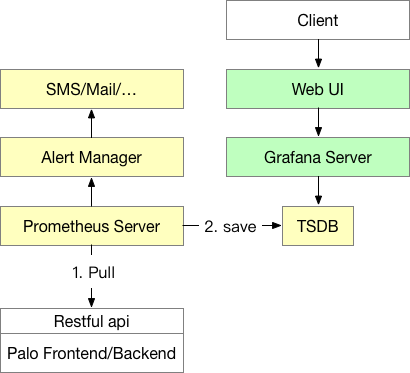
- Prometheus (yellow part): Prometheus Server is the main process of Prometheus. It accesses the monitoring endpoints of Doris nodes via Pull, and stores the time-series data in the TSDB (the TSDB is included in the Prometheus process and does not need to be deployed separately). Prometheus also supports the Push Gateway mode, which allows the monitored system to push monitoring data to the Push Gateway, from which Prometheus Server then pulls the data.
- Alertmanager: Alertmanager is the Prometheus alerting component and must be deployed separately (no solution is provided here; refer to the official documentation to set it up). With Alertmanager, you can configure alert policies and receive alerts via email, SMS, and so on.
- Grafana (green part): Grafana Server is the main process of Grafana. After it starts, you can configure Grafana through the web page, including data source settings, user settings, and dashboard drawing. This is also where end users view monitoring data.
Monitoring Data Format
Doris monitoring data is exposed through the HTTP endpoints of Frontend and Backend in Key-Value text form. Each Key can also carry several Labels for distinction. After the cluster is deployed, you can access the following endpoints directly in a browser to view the real-time monitoring data of a node:
| Node Type | Endpoint |
|---|---|
| Frontend | fe_host:fe_http_port/metrics |
| Backend | be_host:be_web_server_port/metrics |
| Broker | Not provided |
After accessing the endpoint, you will see results similar to the following (an example of FE metrics):
# HELP  jvm_heap_size_bytes jvm heap stat
# TYPE  jvm_heap_size_bytes gauge
jvm_heap_size_bytes{type="max"} 8476557312
jvm_heap_size_bytes{type="committed"} 1007550464
jvm_heap_size_bytes{type="used"} 156375280
# HELP  jvm_non_heap_size_bytes jvm non heap stat
# TYPE  jvm_non_heap_size_bytes gauge
jvm_non_heap_size_bytes{type="committed"} 194379776
jvm_non_heap_size_bytes{type="used"} 188201864
# HELP  jvm_young_size_bytes jvm young mem pool stat
# TYPE  jvm_young_size_bytes gauge
jvm_young_size_bytes{type="used"} 40652376
jvm_young_size_bytes{type="peak_used"} 277938176
jvm_young_size_bytes{type="max"} 907345920
# HELP  jvm_old_size_bytes jvm old mem pool stat
# TYPE  jvm_old_size_bytes gauge
jvm_old_size_bytes{type="used"} 114633448
jvm_old_size_bytes{type="peak_used"} 114633448
jvm_old_size_bytes{type="max"} 7455834112
# HELP  jvm_gc jvm gc stat
# TYPE  jvm_gc gauge
<GarbageCollector>{type="count"} 247
<GarbageCollector>{type="time"} 860
# HELP  jvm_thread jvm thread stat
# TYPE  jvm_thread gauge
jvm_thread{type="count"} 162
jvm_thread{type="peak_count"} 205
jvm_thread{type="new_count"} 0
jvm_thread{type="runnable_count"} 48
jvm_thread{type="blocked_count"} 1
jvm_thread{type="waiting_count"} 41
jvm_thread{type="timed_waiting_count"} 72
jvm_thread{type="terminated_count"} 0
...
The data is presented in the Prometheus format. Take one item as an example:
# HELP  jvm_heap_size_bytes jvm heap stat
# TYPE  jvm_heap_size_bytes gauge
jvm_heap_size_bytes{type="max"} 8476557312
jvm_heap_size_bytes{type="committed"} 1007550464
jvm_heap_size_bytes{type="used"} 156375280
The fields have the following meanings:
- Lines starting with
#are comment lines.HELPis the description of the metric;TYPEindicates the data type of the metric. In the example, the type isGauge, a scalar value. Other data types includeCounterandHistogram. For details, see the Prometheus official documentation. jvm_heap_size_bytesis the metric name (Key);type="max"is a Label namedtypewith valuemax. A metric can carry multiple Labels.- The final number
8476557312is the actual value of the metric.
Setting Up the Monitoring System
After deploying Doris, set up the monitoring system in the following order:
- Deploy Prometheus and configure it to scrape the
/metricsendpoints of FE and BE. - Deploy Grafana and configure Prometheus as the data source.
- Import the official Doris dashboard template in Grafana.
- View the dashboard in the Grafana page and adjust it as needed.
Deploying Prometheus
1. Download and Extract
Download the latest version of Prometheus from the Prometheus official website. The 2.43.0-linux-amd64 version is used here as an example. Extract the downloaded tar file on the machine where you plan to run the monitoring service.
2. Write the Configuration File
Open the configuration file prometheus.yml. The configuration file is in YAML format. Pay attention to consistent indentation and spacing. The simplest static file method is used here for monitoring configuration. Prometheus also supports various service discovery mechanisms that can dynamically detect node additions and removals.
Example configuration:
# my global config
global:
  scrape_interval:     15s # Global scrape interval, default is 1m, set to 15s here
  evaluation_interval: 15s # Global rule evaluation interval, default is 1m, set to 15s here

# Alertmanager configuration
alerting:
  alertmanagers:
  - static_configs:
    - targets:
      # - alertmanager:9093

# A scrape configuration containing exactly one endpoint to scrape:
# Here it's Prometheus itself.
scrape_configs:
  # The job name is added as a label `job=<job_name>` to any timeseries scraped from this config.
  - job_name: 'DORIS_CLUSTER' # Each Doris cluster is called a job. You can give the job a name here as the name of the Doris cluster in the monitoring system.
    metrics_path: '/metrics' # Specify the RESTful API path for retrieving metrics. Combined with the host:port in targets below, Prometheus eventually scrapes metrics via host:port/metrics_path.
    static_configs: # Configure the target addresses of FE and BE separately. All FEs and BEs are written into their respective groups.
      - targets: ['fe_host1:8030', 'fe_host2:8030', 'fe_host3:8030']
        labels:
          group: fe # The fe group is configured here, containing 3 Frontends.

      - targets: ['be_host1:8040', 'be_host2:8040', 'be_host3:8040']
        labels:
          group: be # The be group is configured here, containing 3 Backends.

  - job_name: 'DORIS_CLUSTER_2' # You can monitor multiple Doris clusters in one Prometheus. Another Doris cluster configuration starts here. Configuration is the same as above; details omitted.
    metrics_path: '/metrics'
    static_configs:
      - targets: ['fe_host1:8030', 'fe_host2:8030', 'fe_host3:8030']
        labels:
          group: fe

      - targets: ['be_host1:8040', 'be_host2:8040', 'be_host3:8040']
        labels:
          group: be
Key fields:
| Field | Description |
|---|---|
scrape_interval | Global scrape interval; 15s is recommended. |
evaluation_interval | Global rule evaluation interval; 15s is recommended. |
job_name | Each Doris cluster corresponds to one job, which serves as the identifier of the cluster in the monitoring system. |
metrics_path | Metric endpoint path, fixed to /metrics. |
static_configs.targets | The list of host:port for FE/BE nodes. FE default port is 8030, and BE default port is 8040. |
labels.group | Node group label; fe and be are recommended. |
3. Start Prometheus
Start Prometheus in the background with the following command, and set its web port to 8181:
nohup ./prometheus --web.listen-address="0.0.0.0:8181" &
After it starts, Prometheus immediately begins collecting data and stores the data in the data directory.
4. Stop Prometheus
Currently Prometheus does not provide a formal way to stop the process. You can use kill -9 directly. You can also register Prometheus as a service and start or stop it as a service.
5. Access Prometheus
Open port 8181 in a browser to access the Prometheus page. Click Status -> Targets in the navigation bar to see the monitoring host nodes of all grouped jobs. Under normal conditions, all nodes should be UP, which indicates that data collection is working. Click an Endpoint to see the current monitoring values.
If a node status is not UP, first access Doris's /metrics endpoint (see Monitoring Data Format) to check whether it is reachable, or consult the Prometheus documentation to resolve the issue.
For more advanced usage, see the Prometheus official documentation.
Deploying Grafana
1. Download and Extract
Download the latest version of Grafana from the Grafana official website. The 8.5.22.linux-amd64 version is used here as an example. Extract the downloaded tar file on the machine where you plan to run the monitoring service.
2. Write the Configuration File
Open the configuration file conf/defaults.ini. Focus only on the following configuration items; use the defaults for the rest:
# Path to where grafana can store temp files, sessions, and the sqlite3 db (if that is used)
data = data

# Directory where grafana can store logs
logs = data/log

# Protocol (http, https, socket)
protocol = http

# The ip address to bind to, empty will bind to all interfaces
http_addr =

# The http port to use
http_port = 8182
3. Start Grafana
Start Grafana in the background with the following command. The access port is 8182 as configured above:
nohup ./bin/grafana-server &
4. Stop Grafana
Currently Grafana does not provide a formal way to stop the process. You can use kill -9 directly. You can also register Grafana as a service and start or stop it as a service.
5. Access Grafana
Open port 8182 in a browser to access the Grafana page. The default username and password are both admin.
6. Configure the Data Source
After the first login, configure the data source as prompted. The data source here is the Prometheus instance deployed in the previous step.
The data source configuration Settings page is as follows:
| Field | Description |
|---|---|
| Name | Custom name of the data source, for example doris_monitor_data_source. |
| Type | Select Prometheus. |
| URL | Enter the web address of Prometheus, for example http://host:8181. |
| Access | Select Server mode to access Prometheus through the server where Grafana runs. |
| Other options | Keep the defaults. |
Click Save & Test at the bottom of the page. If Data source is working is displayed, the data source is available.
7. Import the Dashboard
After confirming that the data source is available, import the official Doris dashboard template with the following steps:
- Click the
+icon in the left navigation bar to start adding a dashboard. - Download the JSON file provided in Dashboard Template Download in this document.
- Click
New dashboard->Import dashboard->Upload .json Fileat the top, and import the downloaded JSON file. - After import, you can name the dashboard. The default name is
Doris Overview. When selecting the data source, select the previously createddoris_monitor_data_source. - Click
Importto complete the import, and the Doris dashboard appears.
For more advanced usage, see the Grafana official documentation.
Dashboard Description
The dashboard content may change as versions are updated. This document does not guarantee the latest content.
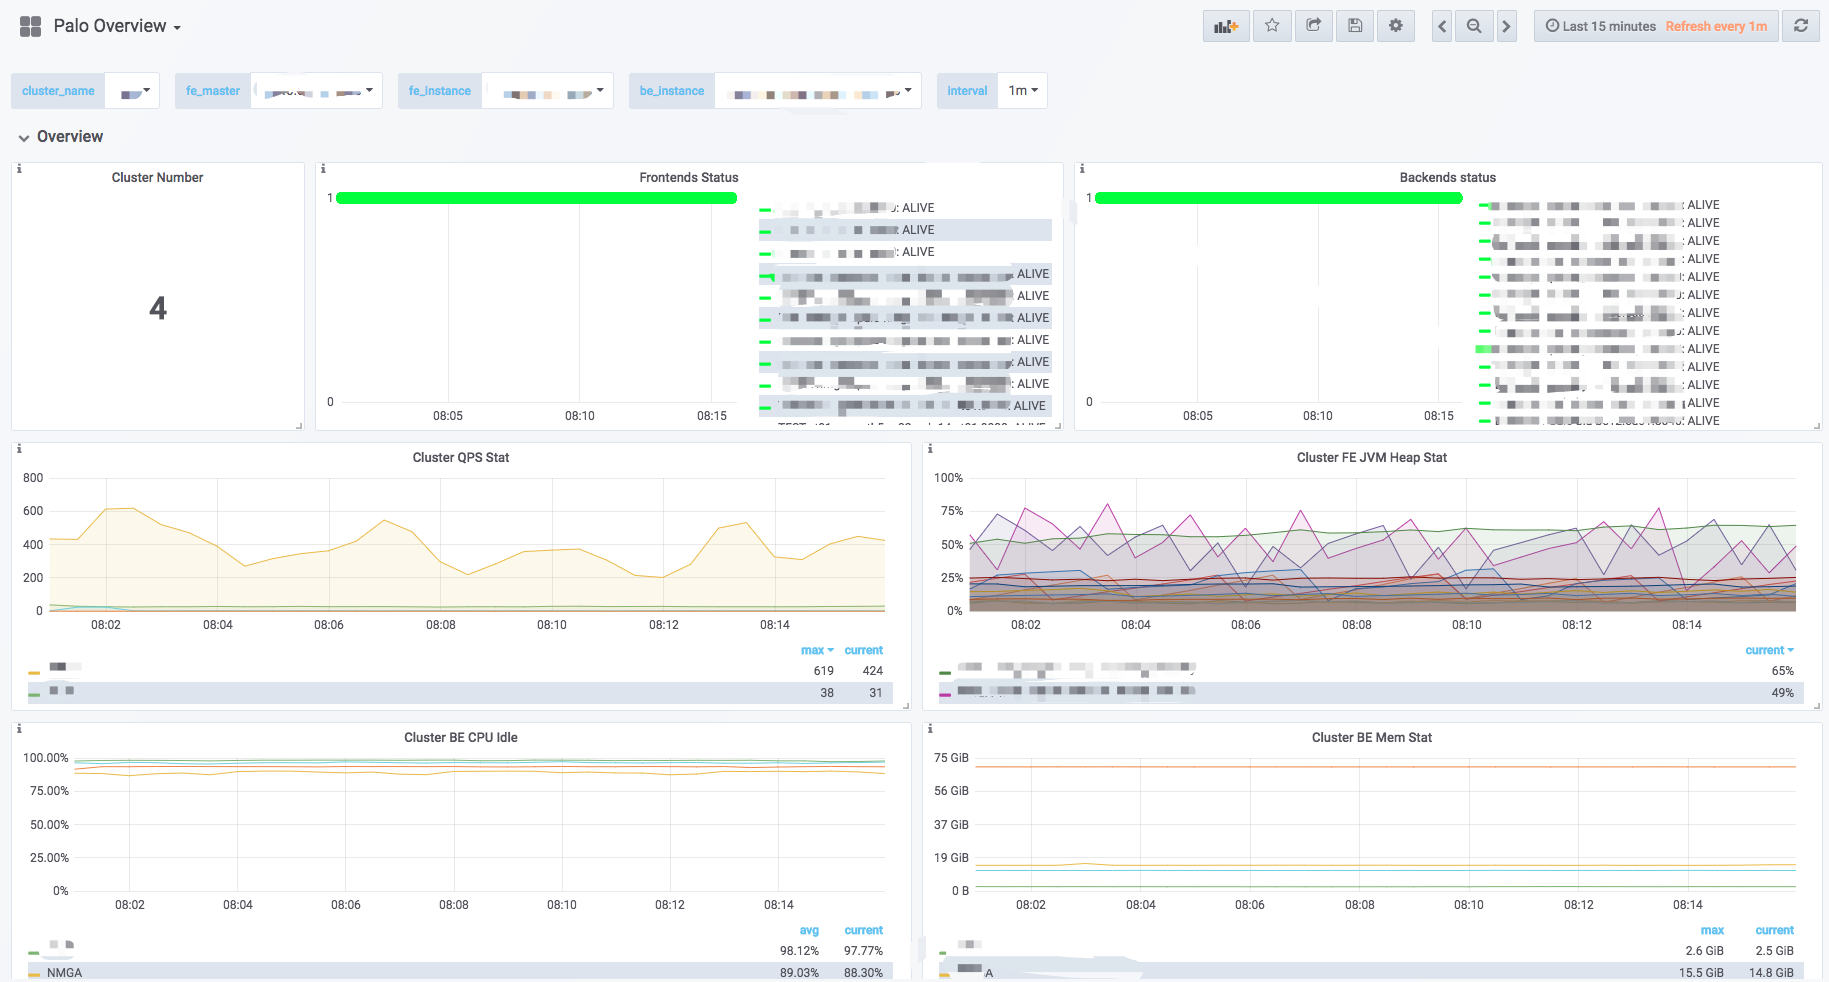
Top Bar

| Element | Description |
|---|---|
| Top left | Dashboard name. |
| Top right | Current monitoring time range. You can select different time ranges from the drop-down, and specify the auto-refresh interval. |
cluster_name | Corresponds to each job_name in the Prometheus configuration file, representing a Doris cluster. After switching, the charts below display the monitoring information of the selected cluster. |
fe_master | The Master Frontend node of the corresponding cluster. |
fe_instance | All Frontend nodes of the corresponding cluster. After switching, the charts below display the monitoring information of the selected Frontend. |
be_instance | All Backend nodes of the corresponding cluster. After switching, the charts below display the monitoring information of the selected Backend. |
interval | Sampling interval for rate-related metrics. (Note: a 15s interval may cause some charts to be empty.) |
Row
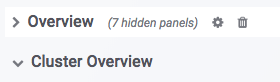
In Grafana, a Row is a group of charts (such as Overview and Cluster Overview in the figure above). Click a Row to collapse it. The current dashboard contains the following Rows (continuously updated):
| Row | Description |
|---|---|
| Overview | Aggregated view of all Doris clusters. |
| Cluster Overview | Aggregated view of the selected cluster. |
| Query Statistic | Query-related monitoring for the selected cluster. |
| FE JVM | JVM monitoring for the selected Frontend. |
| BE | Aggregated view of Backends in the selected cluster. |
| BE Task | Backend task information for the selected cluster. |
Charts
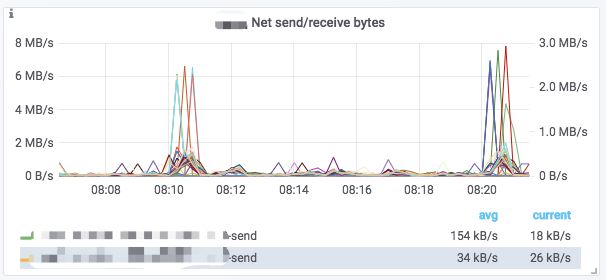
A typical chart usually contains the following elements:
- Hover over the
iicon in the upper-left corner to view the chart description. - Click a legend below the chart to view a single metric. Click again to restore the display of all metrics.
- Drag in the chart to select a time range.
- The
[]in the title shows the selected cluster name. - Some values correspond to the left Y-axis and some to the right Y-axis. They are distinguished by the
-rightsuffix at the end of the legend. - Click the chart name ->
Editto edit the chart.
Dashboard Update
When the official dashboard template is updated, overwrite the existing dashboard with the following steps:
- Click the
+icon in the Grafana left bar, and then clickDashboard. - Click
New dashboardin the upper-left corner, and then clickImport dashboardon the right. - Click
Upload .json Fileand select the latest template file. - Select the data source.
- Click
Import (Overwrite)to complete the template update.
FAQ
Q: A node status in Prometheus Targets is DOWN. What should I do?
Check the network connectivity from the Prometheus server to the FE/BE nodes. Confirm that the target address and port are correct, and that the /metrics endpoint can be accessed directly.
Q: The browser cannot access /metrics on FE/BE. What should I do?
Confirm that the FE http_port (default 8030) and the BE webserver_port (default 8040) are open, and that the node processes are running normally.
Q: Grafana shows Data source is not working. What should I do?
Check whether the Grafana data source URL matches the actual listening address of Prometheus, and confirm that the Grafana server can reach Prometheus over the network.
Q: Some charts in the dashboard are empty. What should I do?
Check whether the interval is too small (for example, 15s may cause rate-type charts to have no data), and confirm that Prometheus has successfully scraped the relevant jobs.
Q: The YAML configuration file fails to parse. What should I do?
YAML strictly depends on indentation and spacing. Check whether Tab characters are used for indentation or whether the indentation levels are inconsistent.
Q: There is no monitoring data for Broker nodes. What should I do?
The current version of Broker does not provide a /metrics endpoint.