QuickSight
QuickSight can connect to Apache Doris through the official MySQL data source, and supports both Directly query and Import modes. This document is intended for users who want to analyze Doris data in QuickSight. It covers connection preparation, dataset creation, and the workflow for building a multi-table associated visualization dashboard based on TPC-H data.
Applicable scenarios
| Use case | User goal | Outcome |
|---|---|---|
| Connect to a Doris data source | Connect to Apache Doris in QuickSight through the official MySQL data source | QuickSight can access data in the Doris cluster |
| Create an analysis dataset | Create a QuickSight Dataset based on a Doris table | The dataset can be used for subsequent analysis and visualization |
| Build a multi-table associated dashboard | Use the TPC-H customer, nation, and orders tables for associated analysis | A dashboard that counts the number of orders by country and order status is generated |
Workflow
| Stage | Goal | Description |
|---|---|---|
| Step 1 | Complete connection preparation | Verify the Doris version, network connectivity, and MySQL compatibility version |
| Step 2 | Create a QuickSight data source | Use the official QuickSight MySQL connector to connect to Apache Doris |
| Step 3 | Create a Dataset | Select a Doris table and create a dataset using Directly query mode |
| Step 4 | Build a visualization dashboard | Add multiple Datasets, configure table associations, and publish the analysis dashboard |
Prerequisites
Before starting the configuration, confirm that the following conditions are met:
| Requirement | Specification |
|---|---|
| Doris version | Apache Doris version 3.1.2 or later |
| Network connectivity | Configure VPC and security groups according to the Doris deployment environment to ensure that the AWS server can access the Doris cluster |
| MySQL compatibility version | Declare the MySQL compatibility version on the MySQL client connecting to Doris |
On the MySQL client connecting to Doris, run the following SQL to declare the MySQL compatibility version:
SET GLOBAL version = '8.3.99';
Run the following SQL to verify the configuration:
mysql> show variables like "version";
+---------------+--------+---------------+---------+
| Variable_name | Value  | Default_Value | Changed |
+---------------+--------+---------------+---------+
| version       | 8.3.99 | 5.7.99        | 1       |
+---------------+--------+---------------+---------+
1 row in set (0.01 sec)
Connect QuickSight to Apache Doris
This section describes how to create a Doris data source in QuickSight and create a Dataset based on a Doris table.
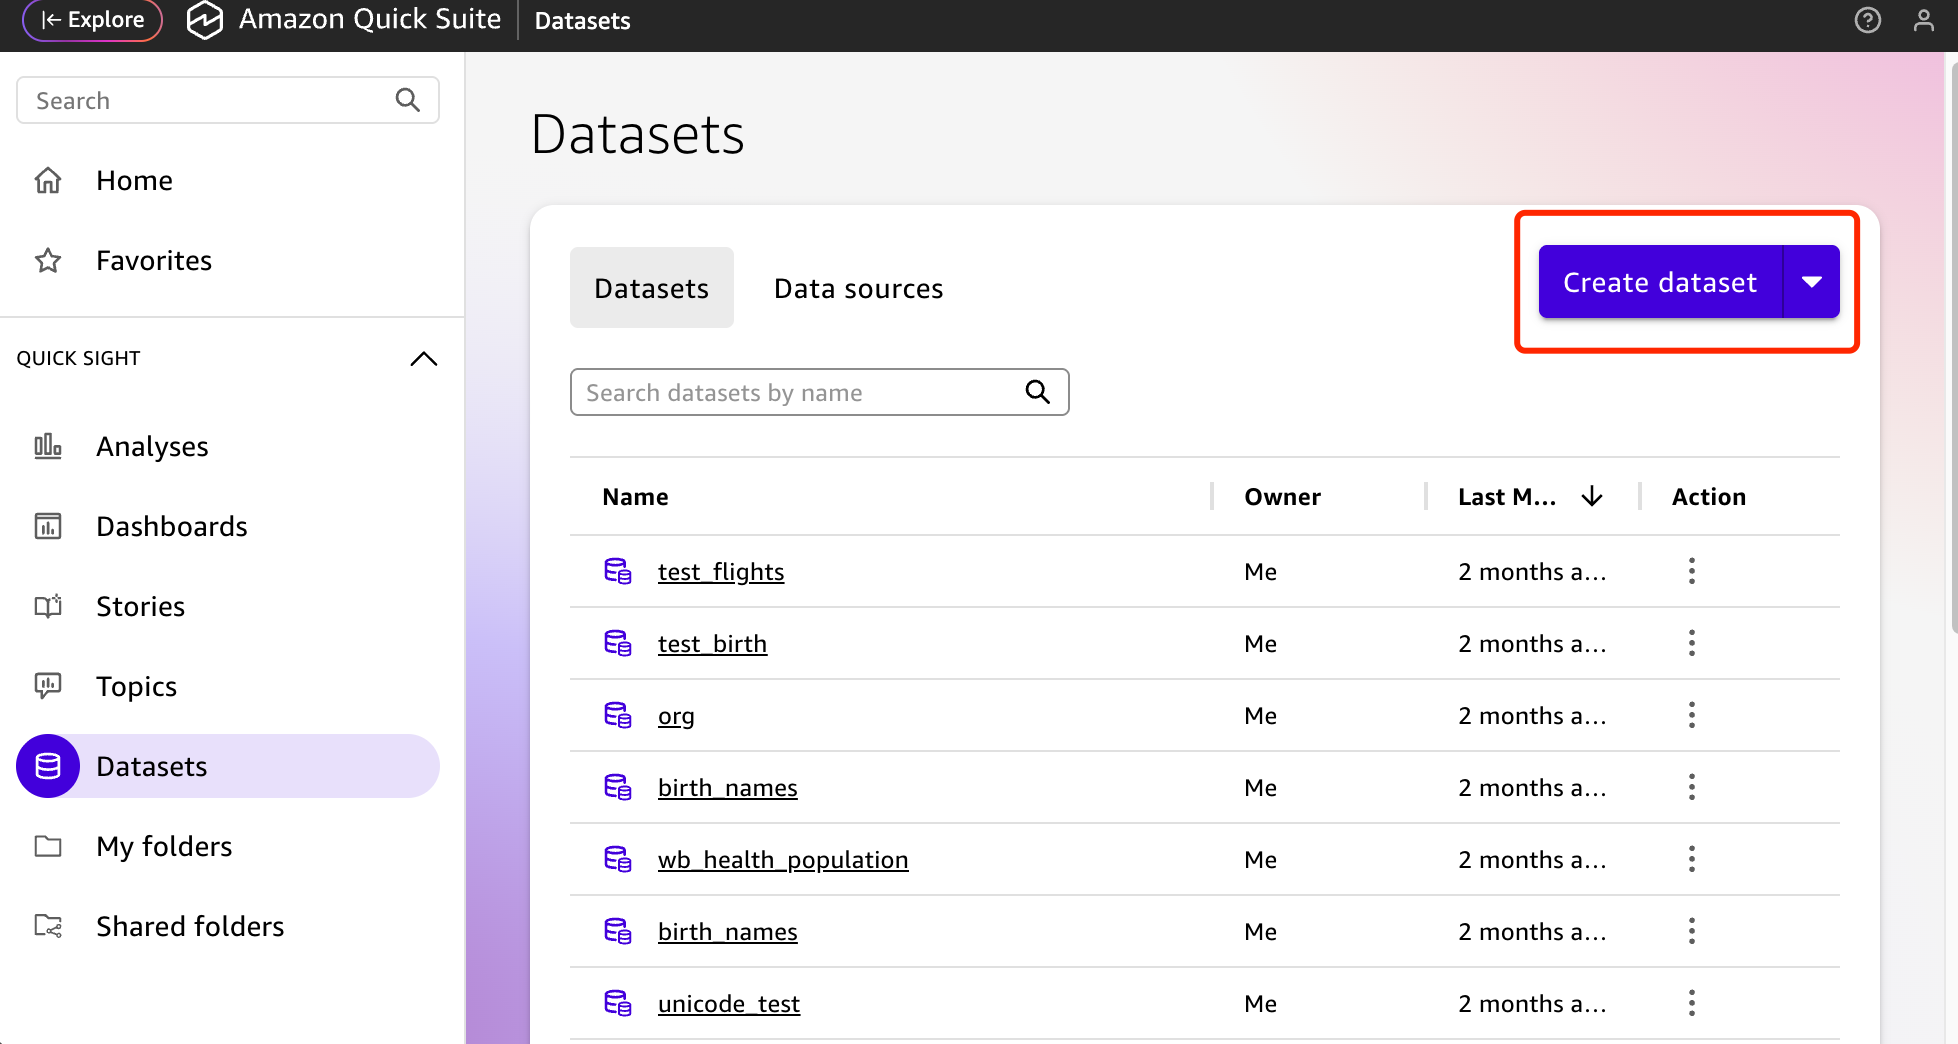
Step 1: Create a new QuickSight dataset
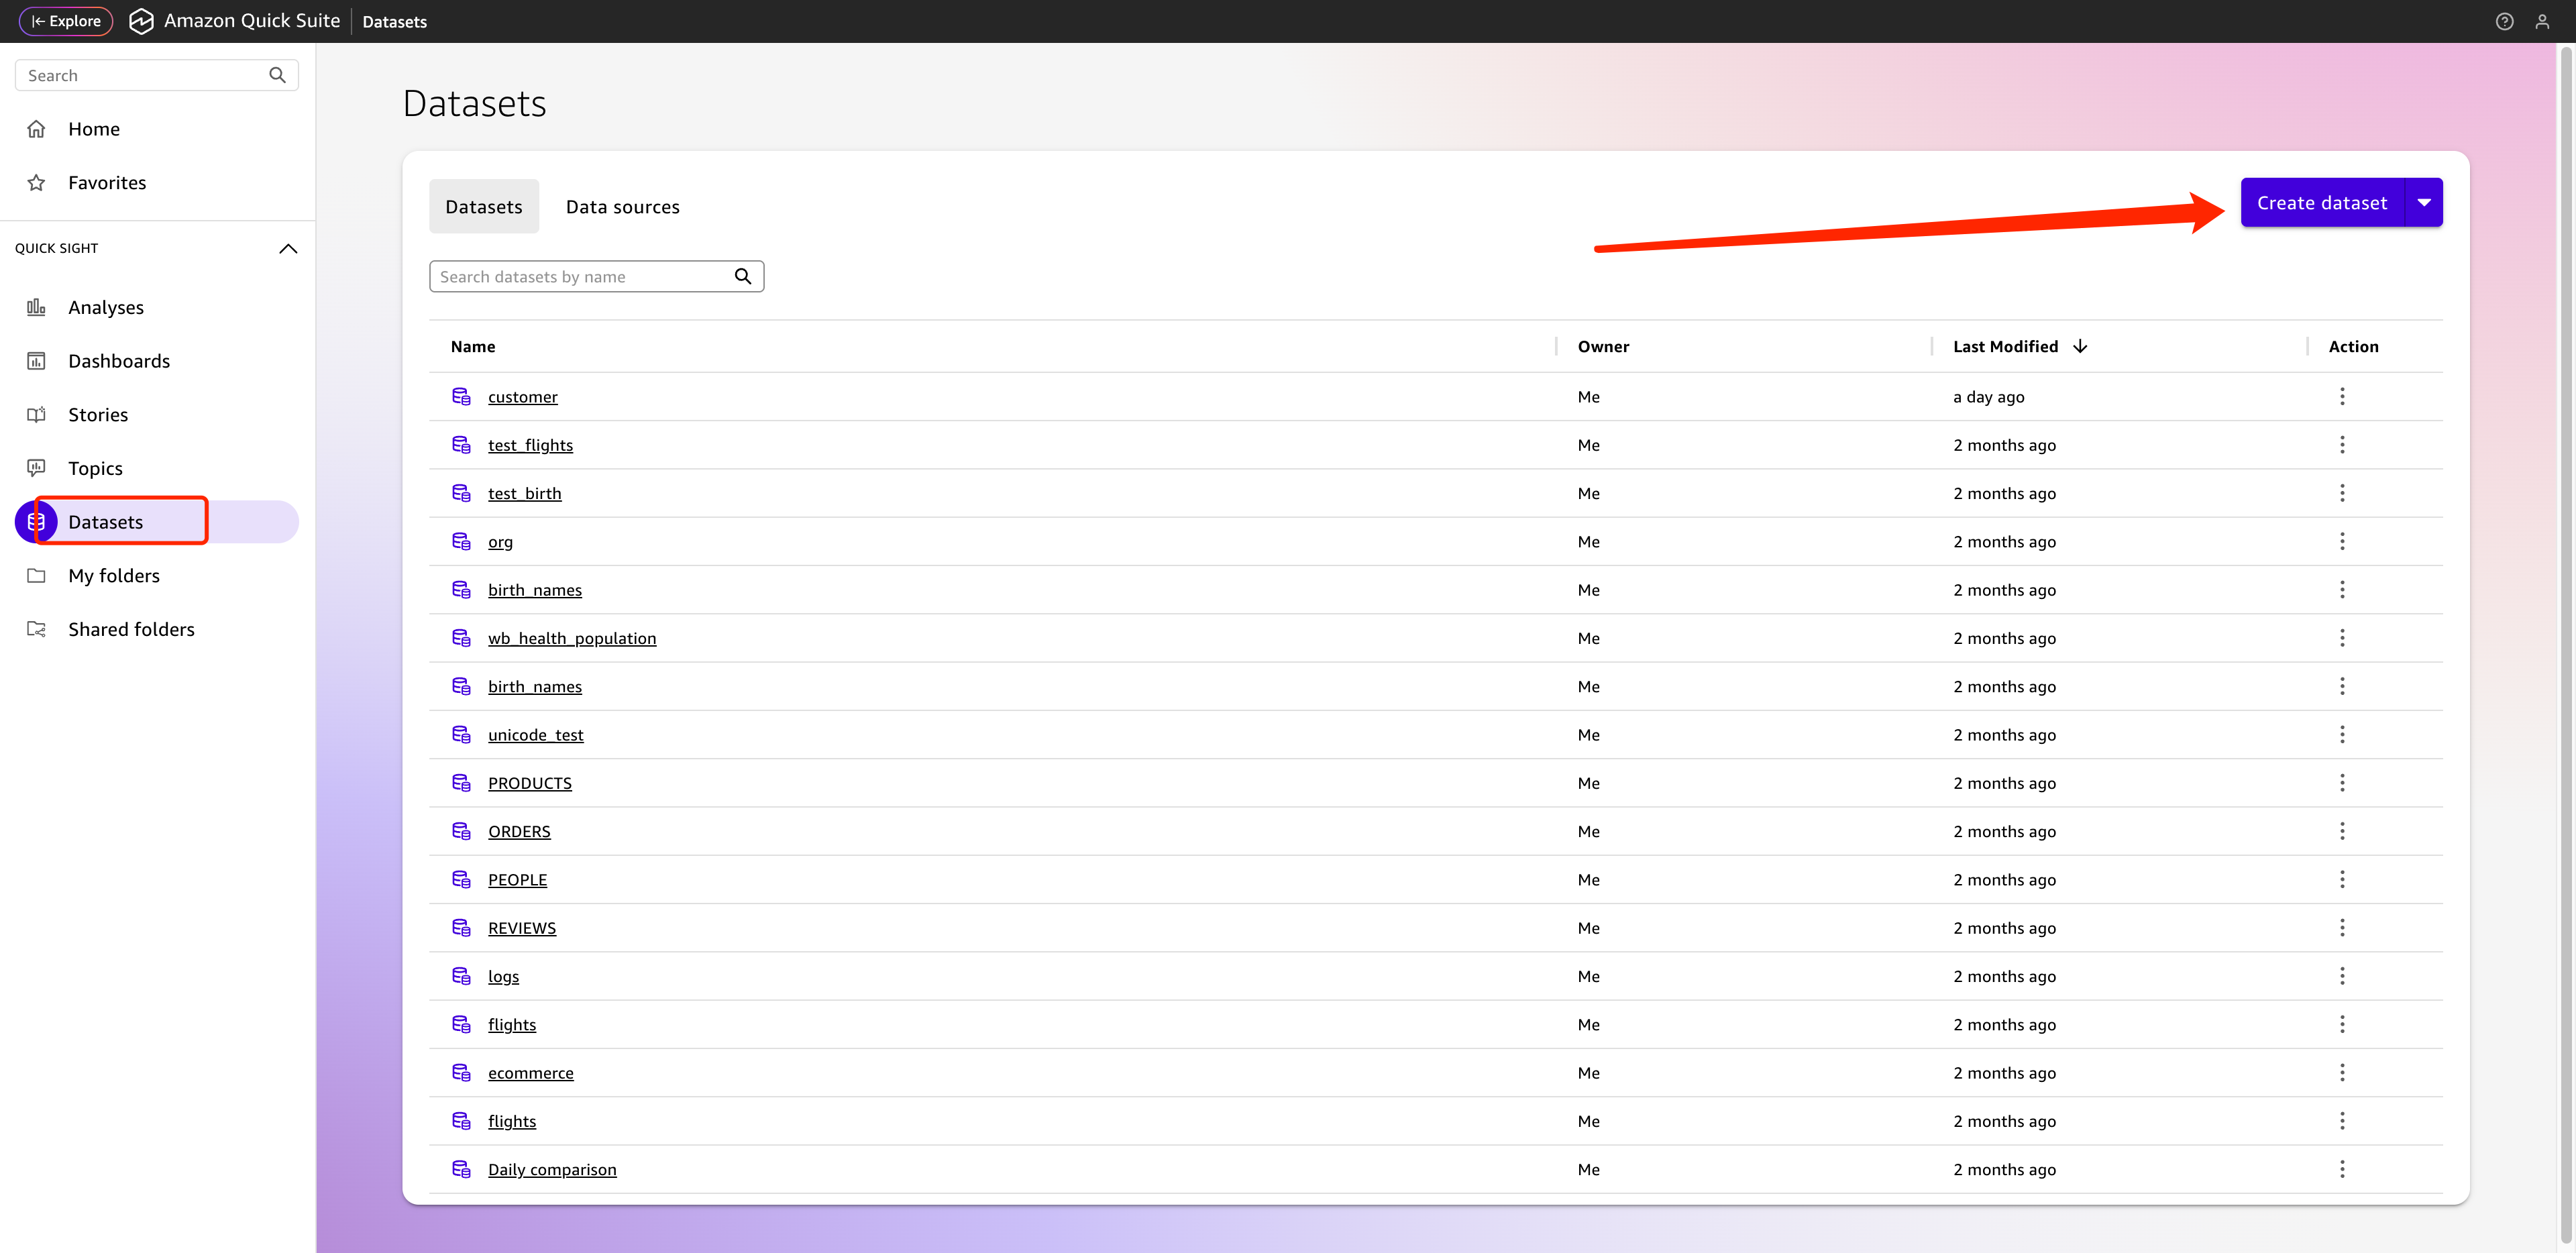
Go to the QuickSight console, open the datasets page, and click New dataset.
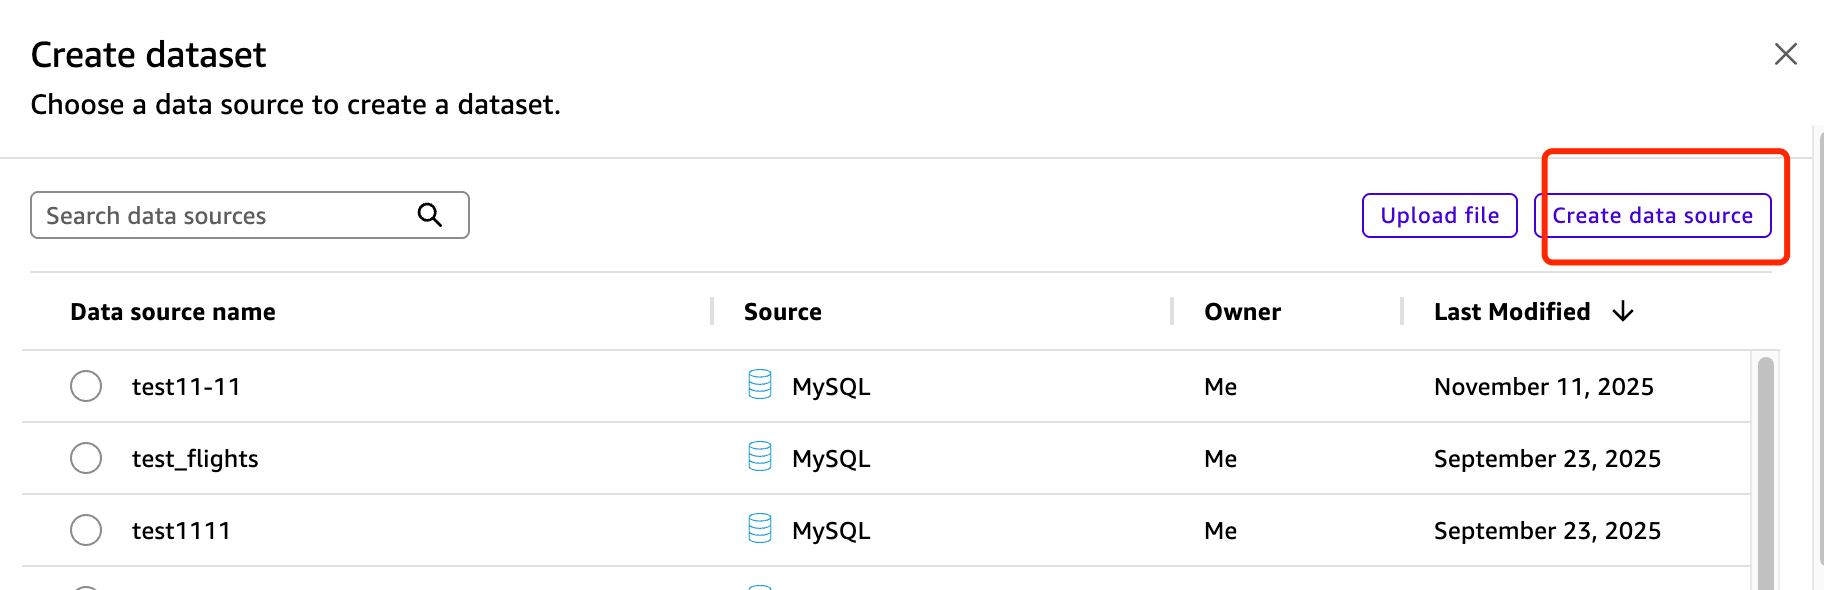
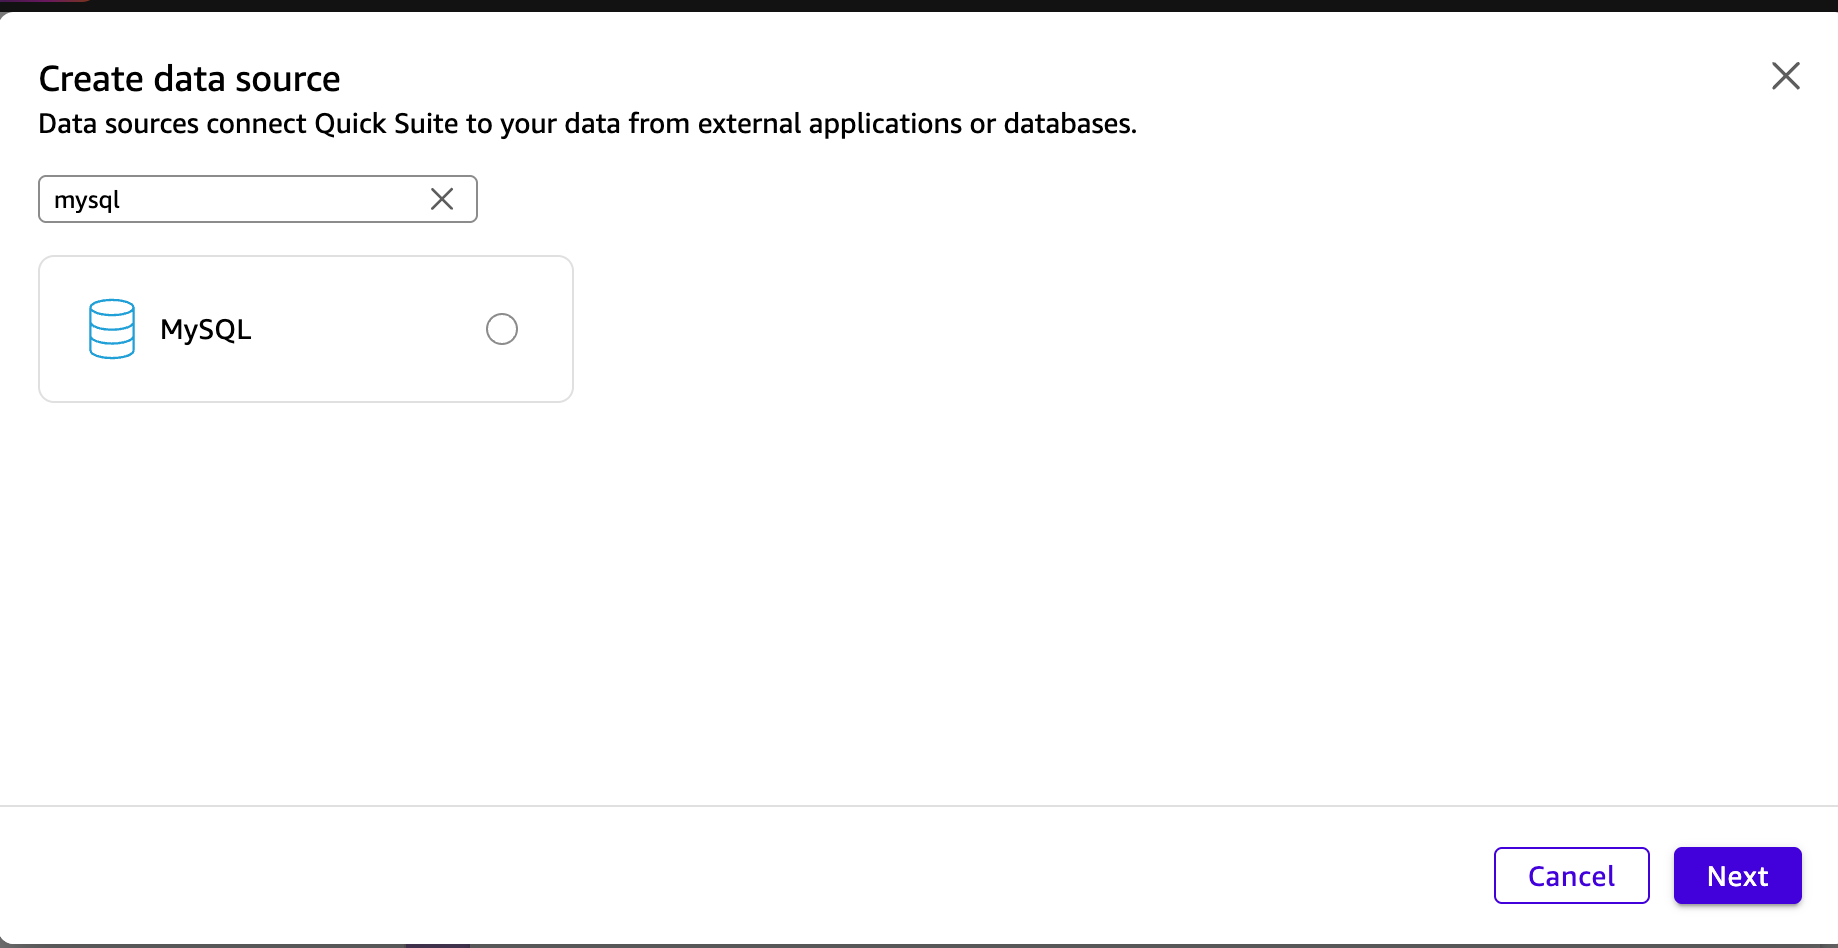
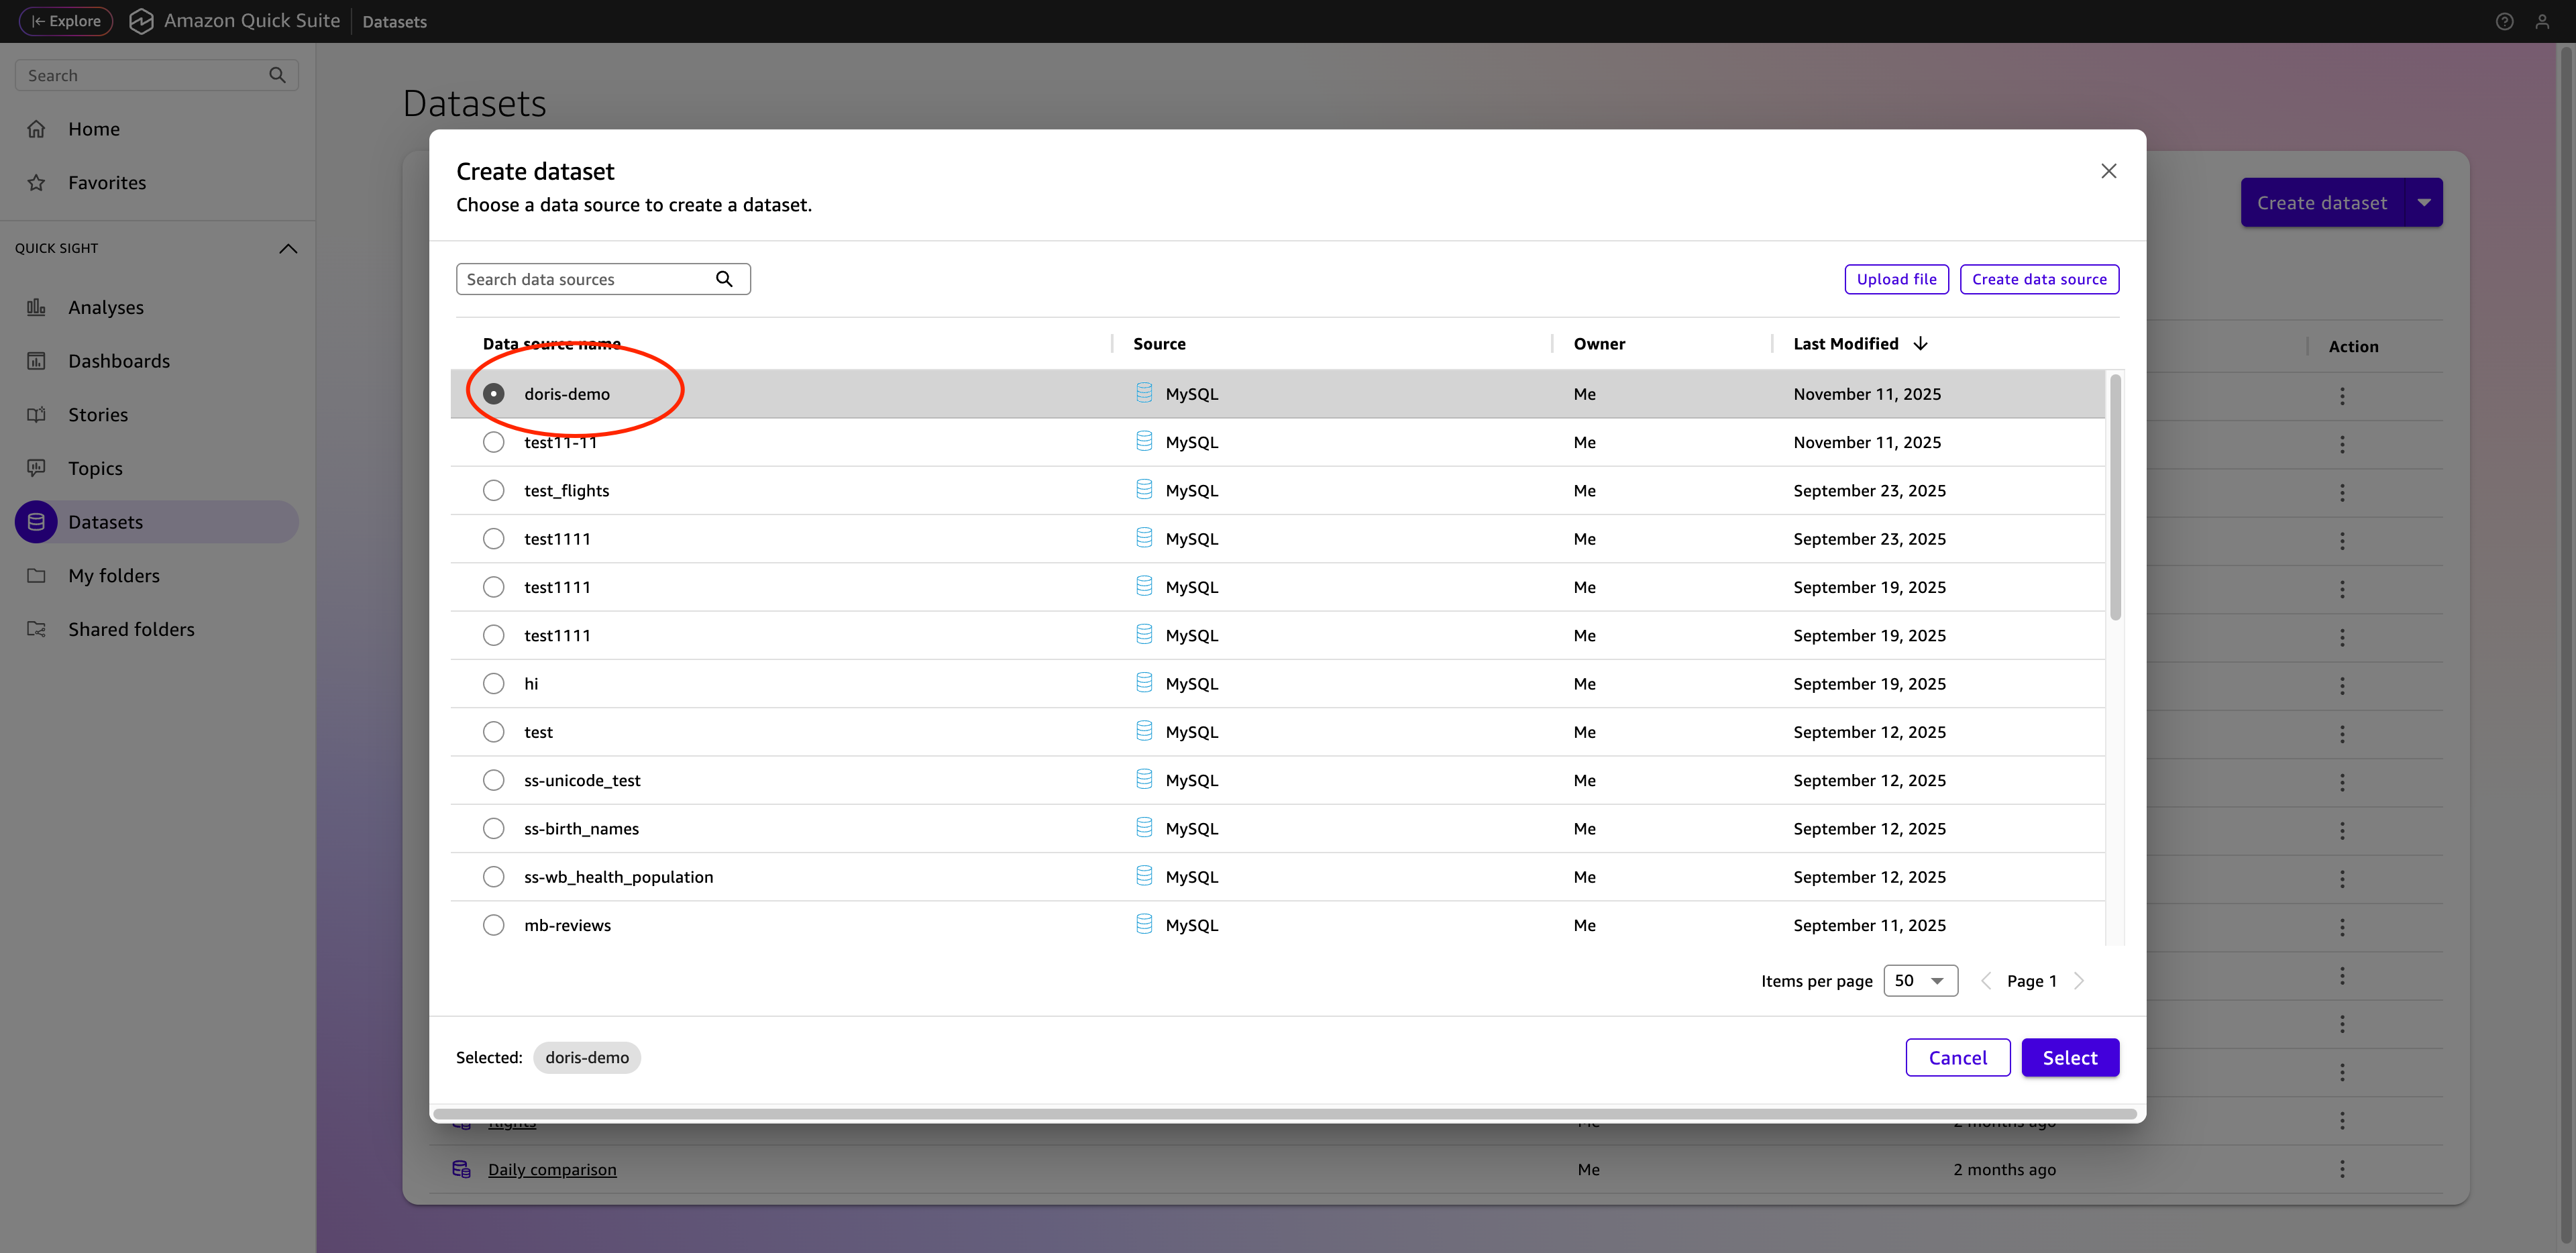
Step 2: Select the MySQL connector
Search for and select the official MySQL connector built into QuickSight.
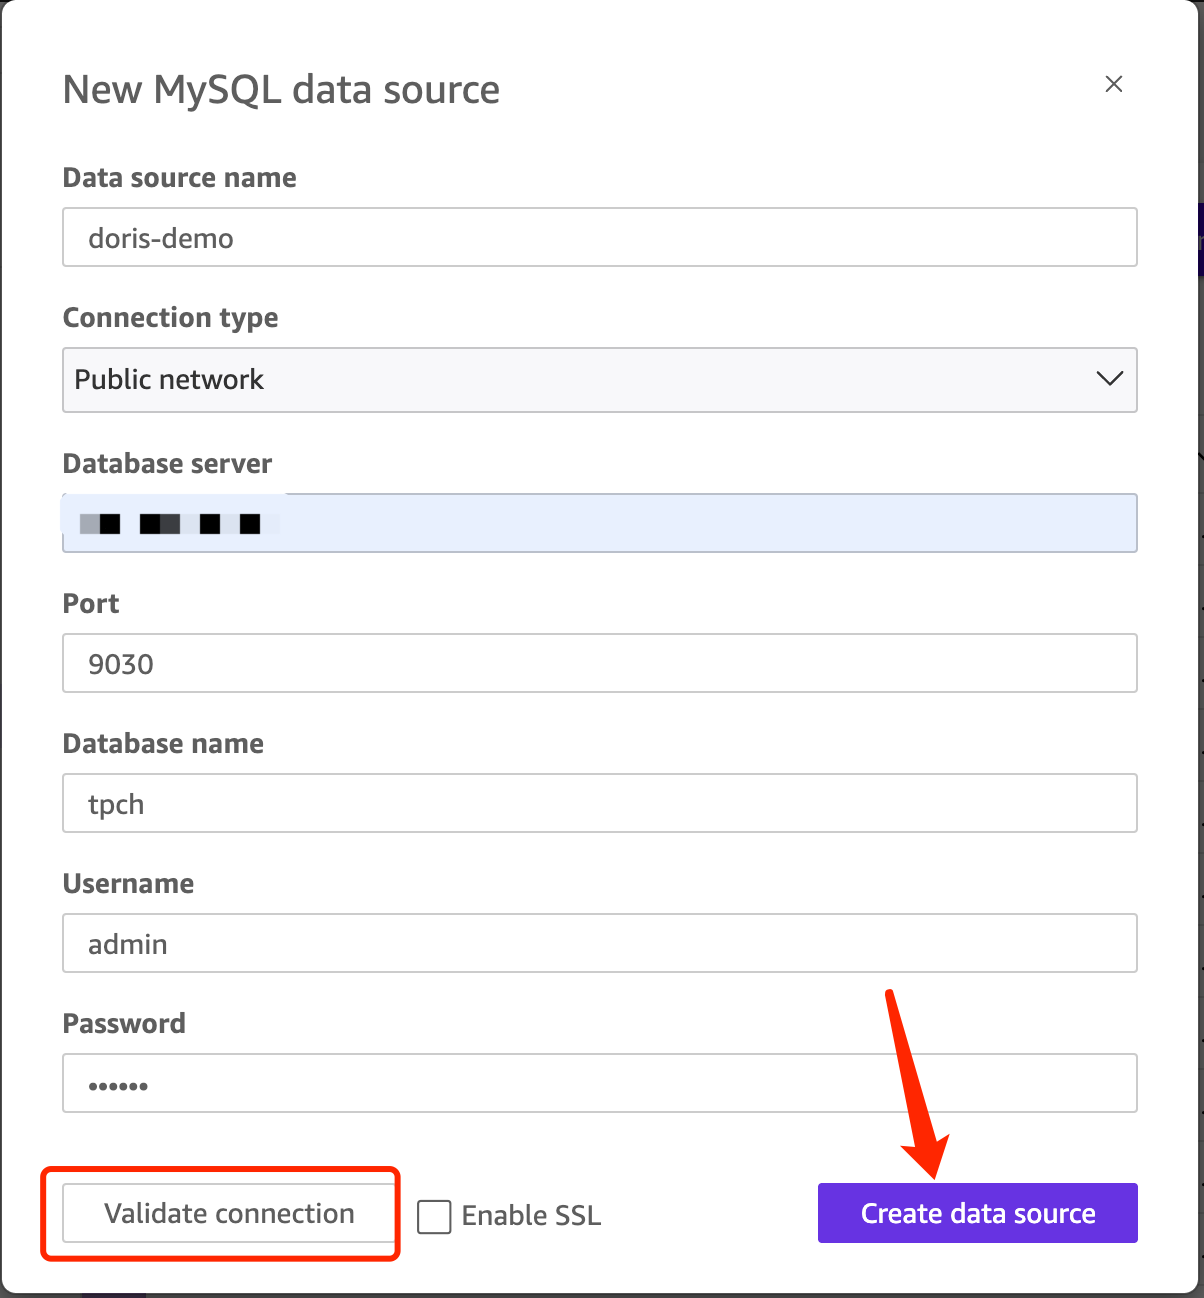
Step 3: Fill in the Doris connection information
Fill in the Doris connection information as required on the page. The MySQL interface port defaults to 9030. The actual port is determined by the query_port configuration of the Doris FE.
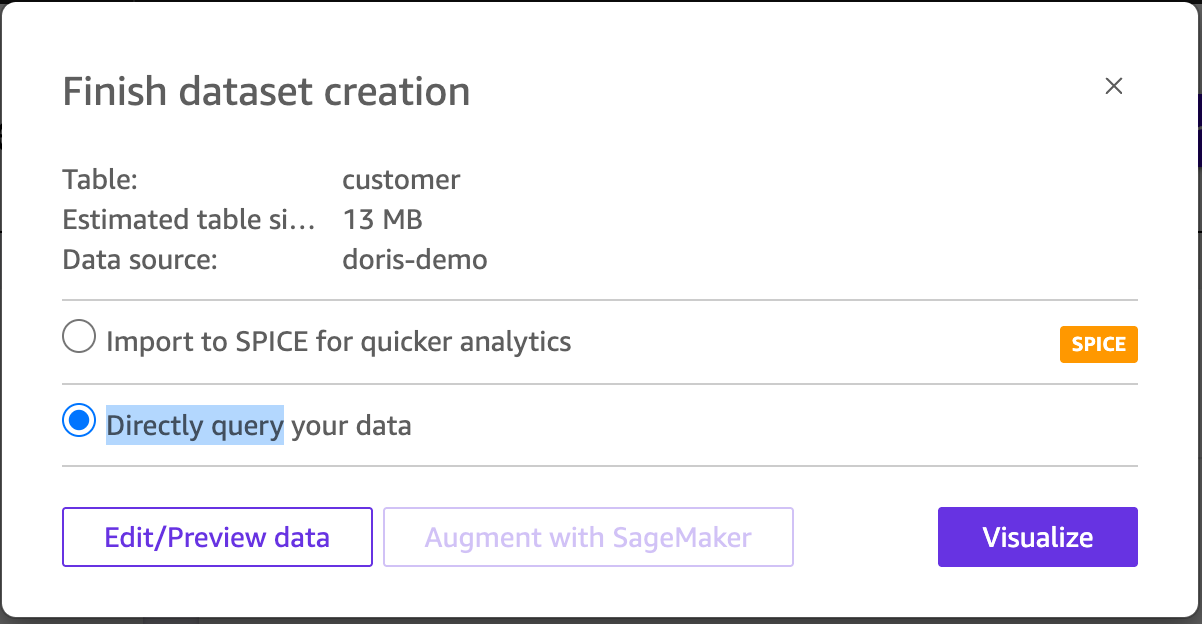
Step 4: Select the Doris table and query mode
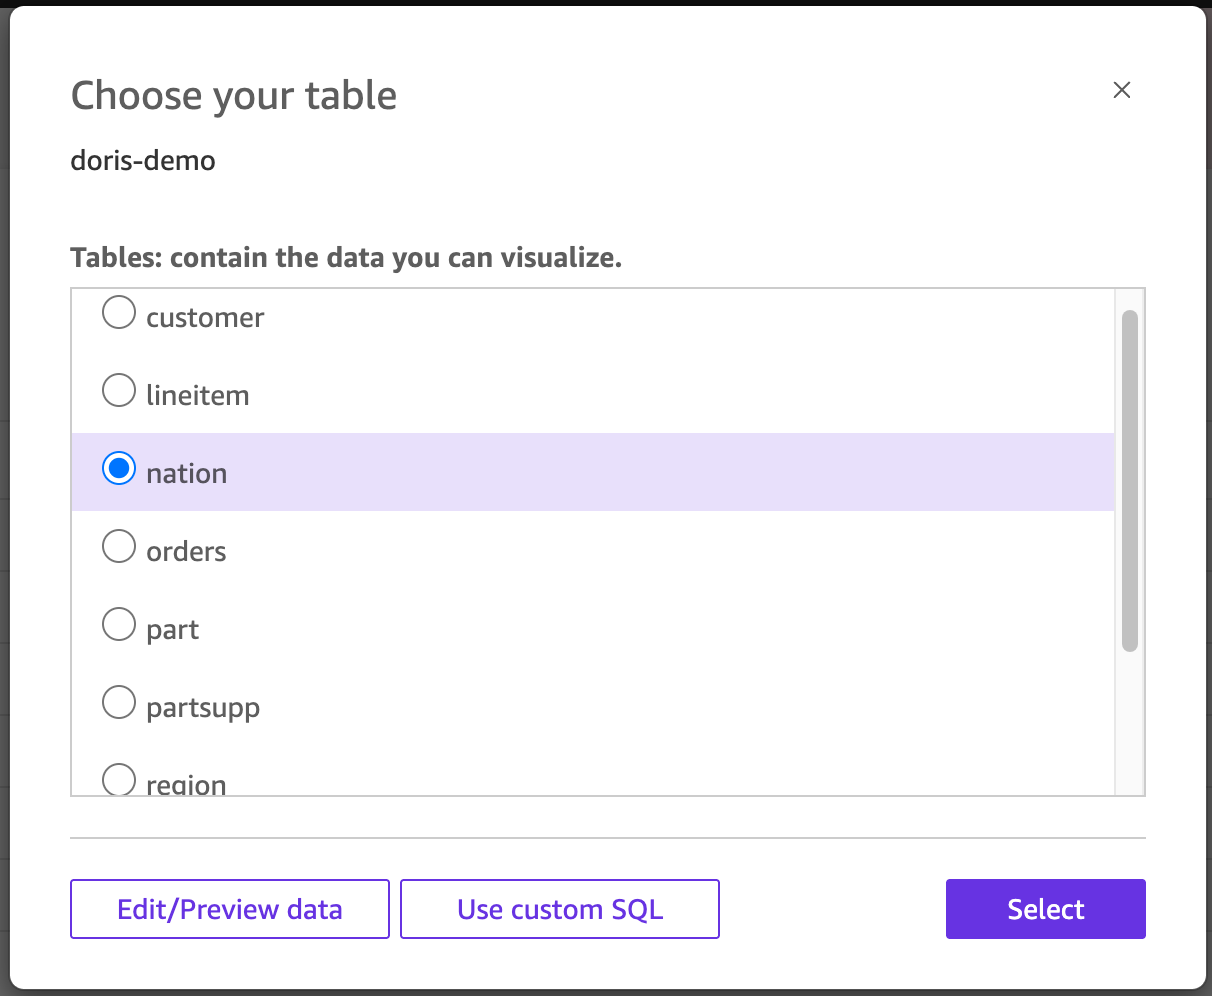
Select the Doris table you want to analyze from the list.
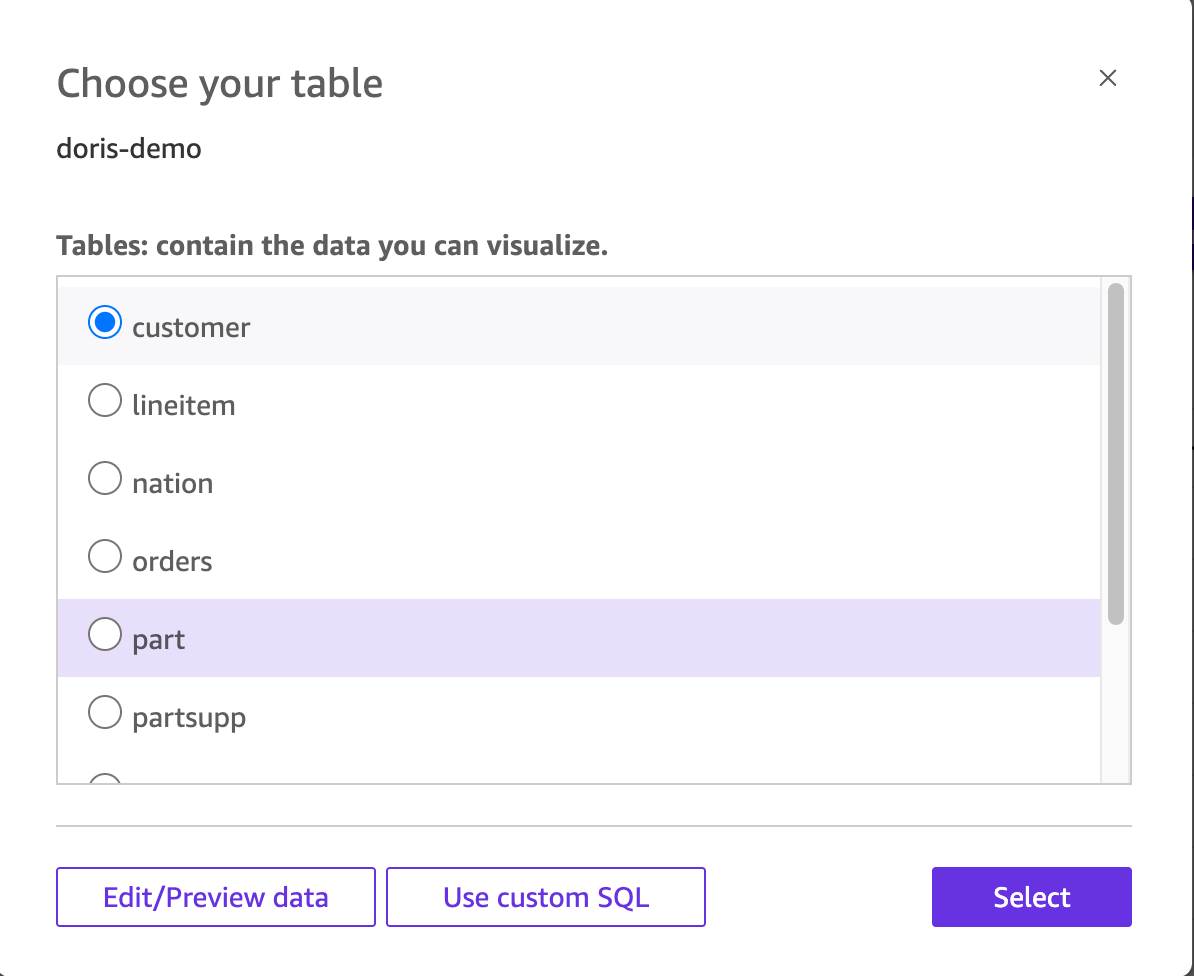
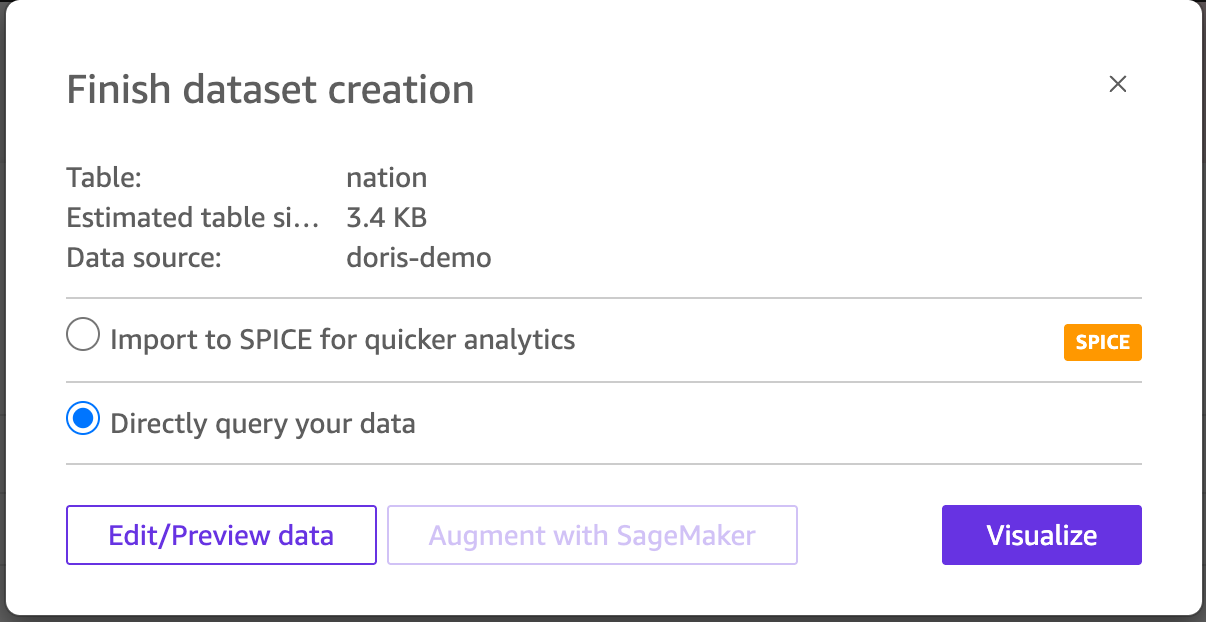
Selecting Directly query mode is recommended.
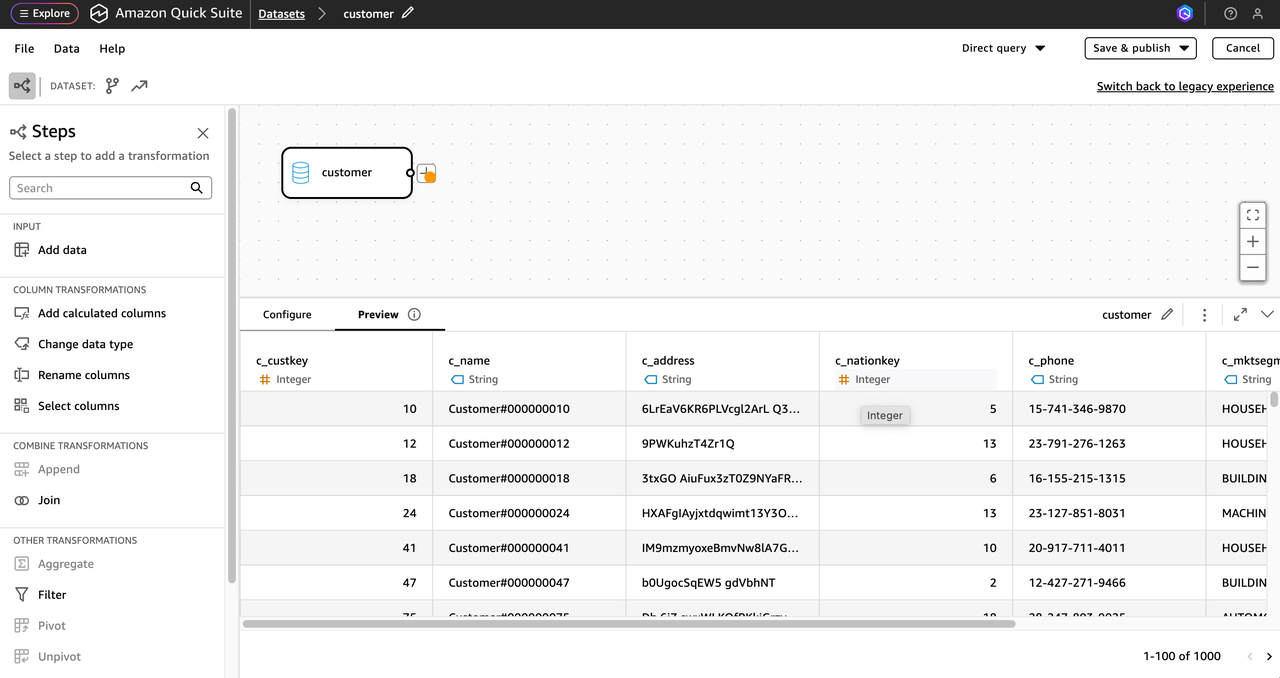
After clicking Edit/Preview data, you can view the table schema, adjust custom SQL, and modify the Dataset here.
Step 5: Publish the Dataset and create a visualization
After the Dataset configuration is complete, you can publish the dataset and create a new visualization.
Build a visualization in QuickSight
This section uses TPC-H data as the data source to demonstrate how to build a visualization dashboard based on multi-table associations in QuickSight. For instructions on building the Doris TPC-H data source, see the TPC-H benchmark documentation.
The example goal is to count the number of orders for each country across different order statuses. Because Doris delivers good query performance for multi-table association scenarios, this document uses the customer, nation, and orders tables for associated analysis.
Step 1: Create a Dataset based on a Doris table
-
Use the Data source created earlier to add the following tables as Datasets:
customernationorders
-
Click Create dataset.
-
Select the data source created earlier.
-
Select the required table.
-
Select Directly query mode.
-
Click Visualize to create the data source, and follow the same steps to create data sources for the other tables.
Step 2: Add multiple Datasets to the analysis
-
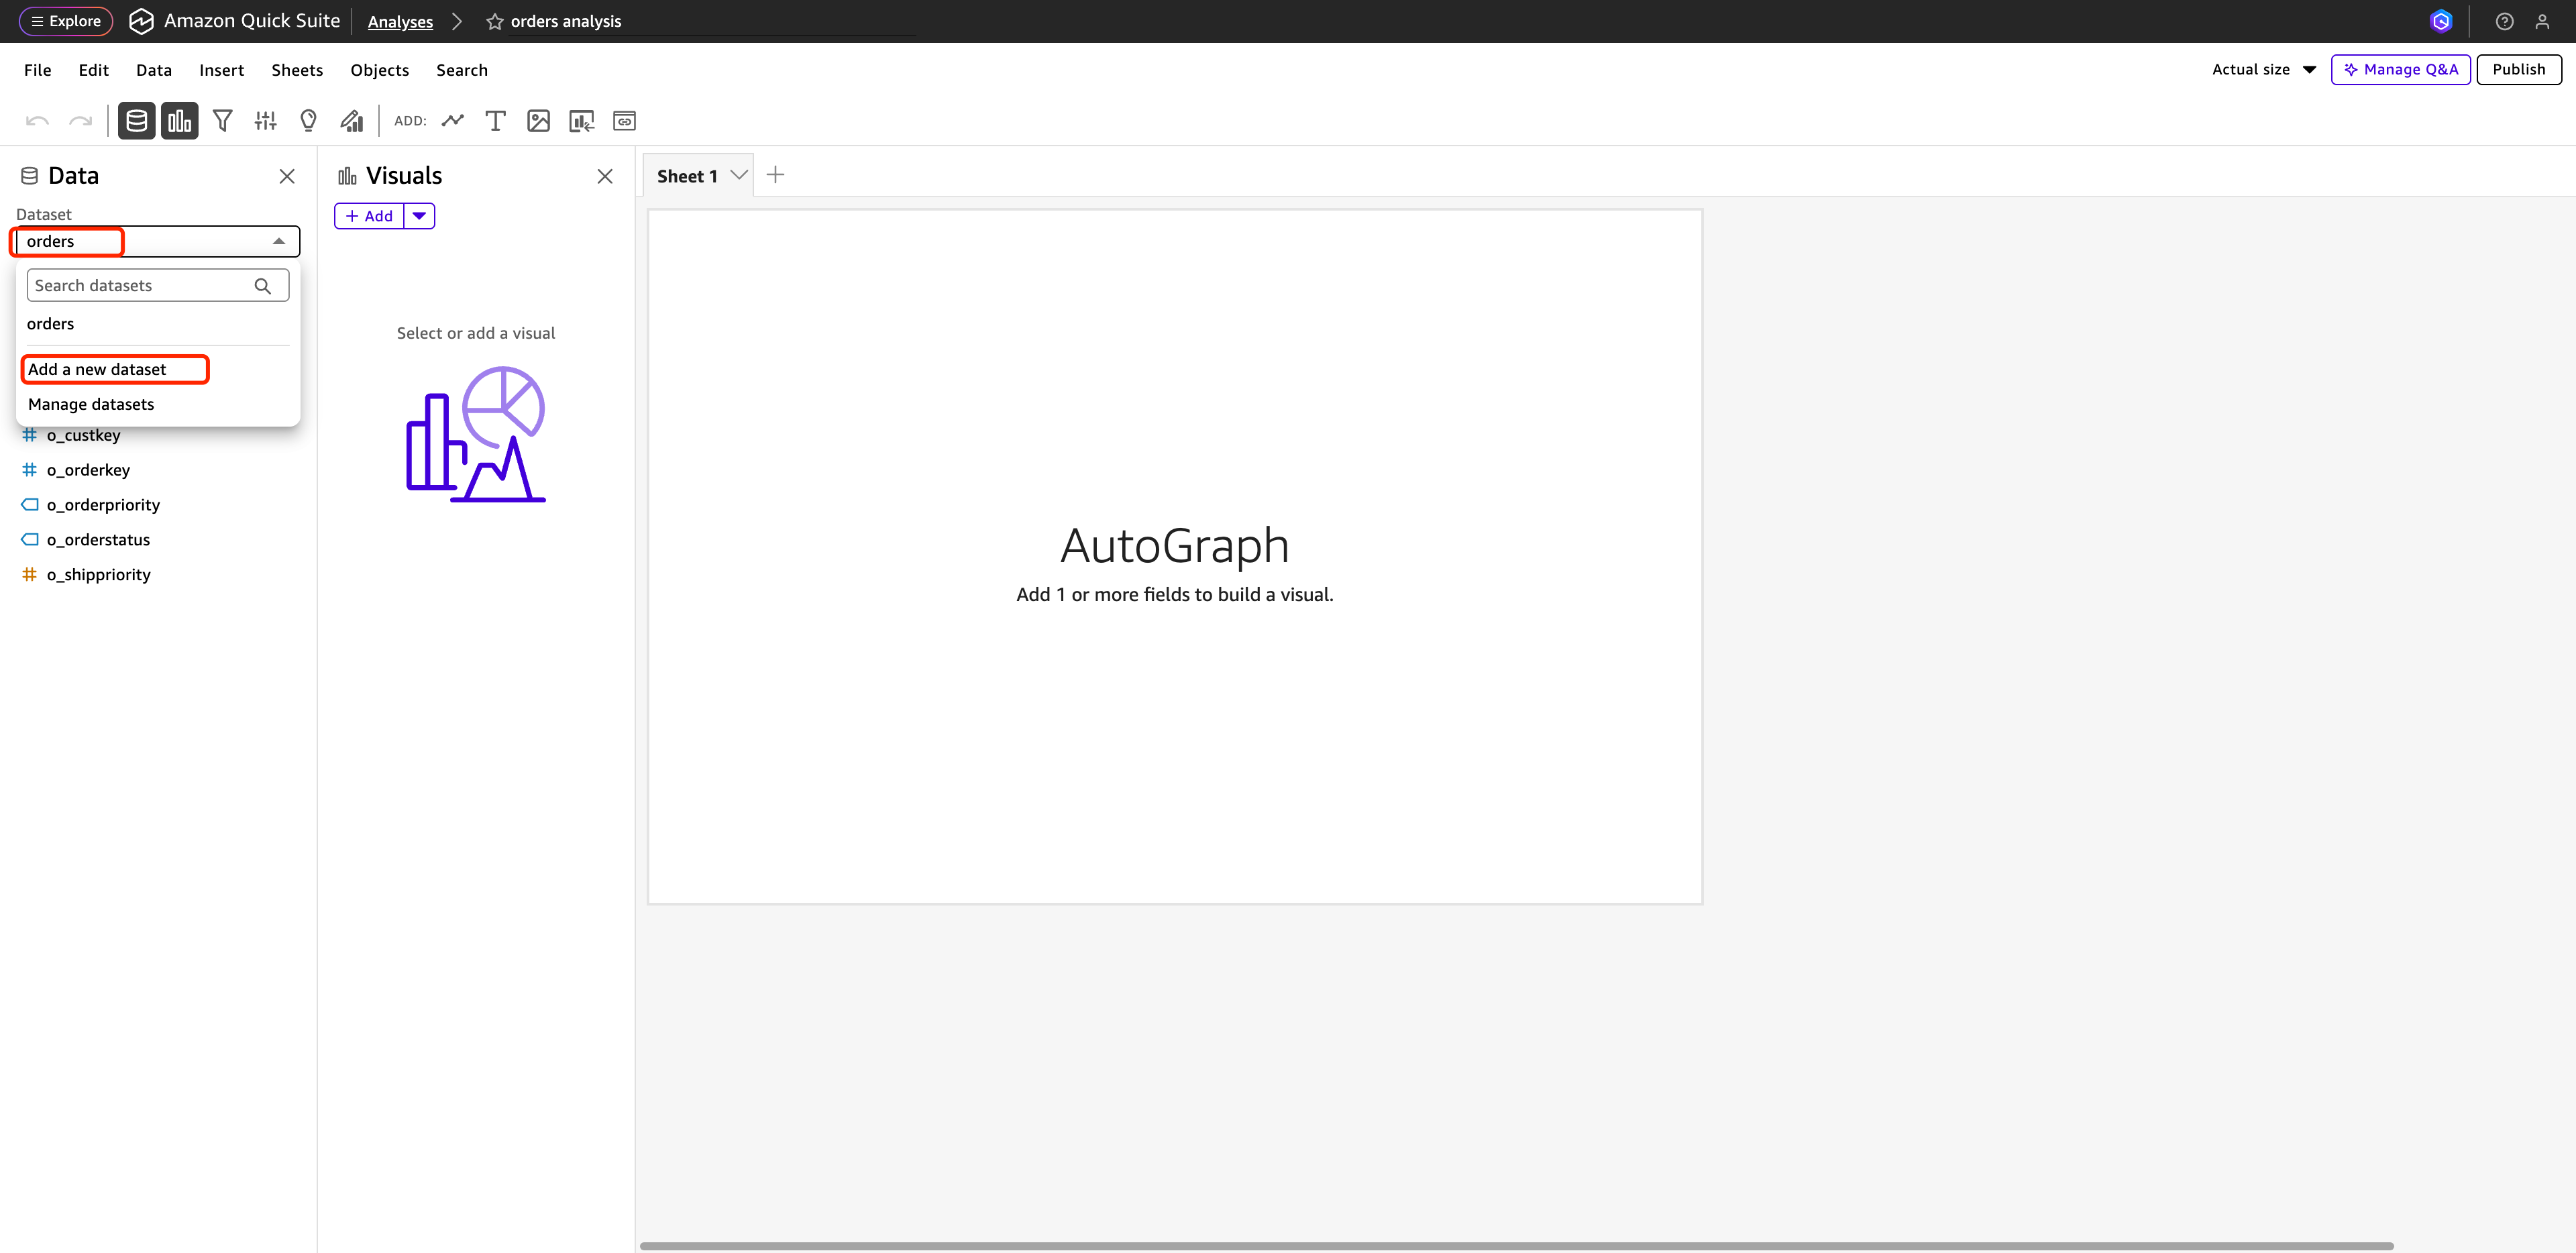
Open the dashboard authoring workspace, click the current Dataset dropdown, and select Add new dataset.
-
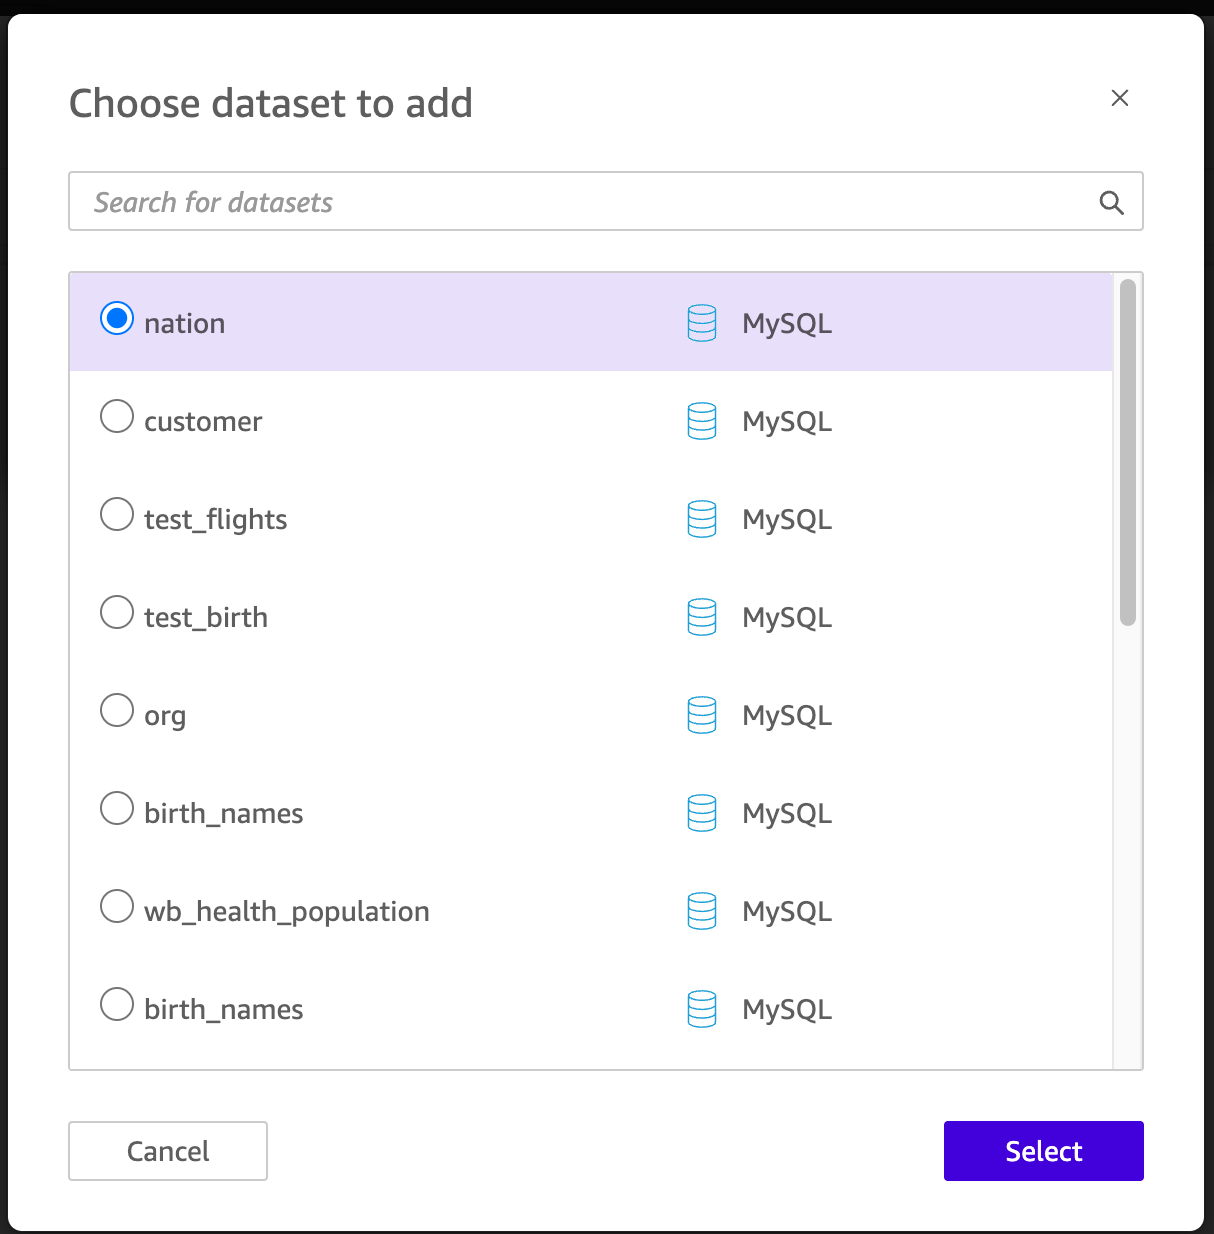
Select all the datasets you want to use, and click Select to add them to the current dashboard.
Step 3: Configure Dataset associations
-
After adding the datasets, click the action entry for
nationto open the dataset edit interface.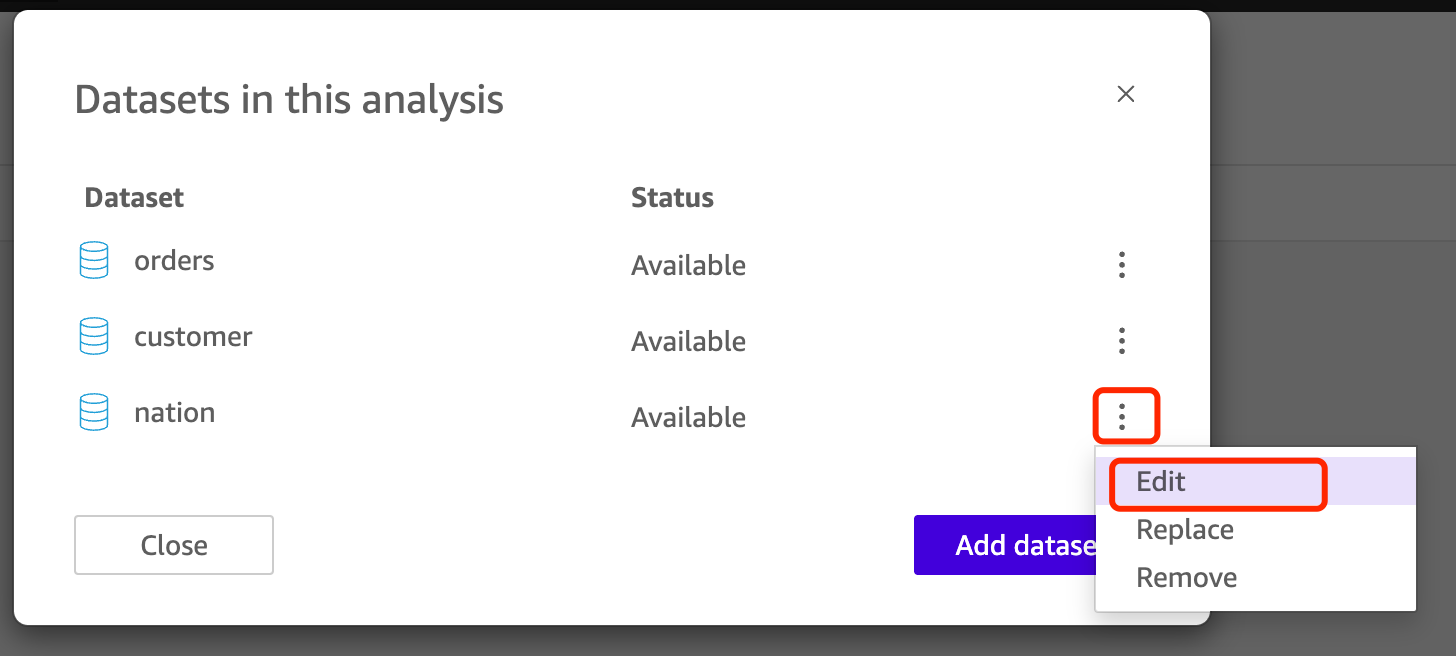
-
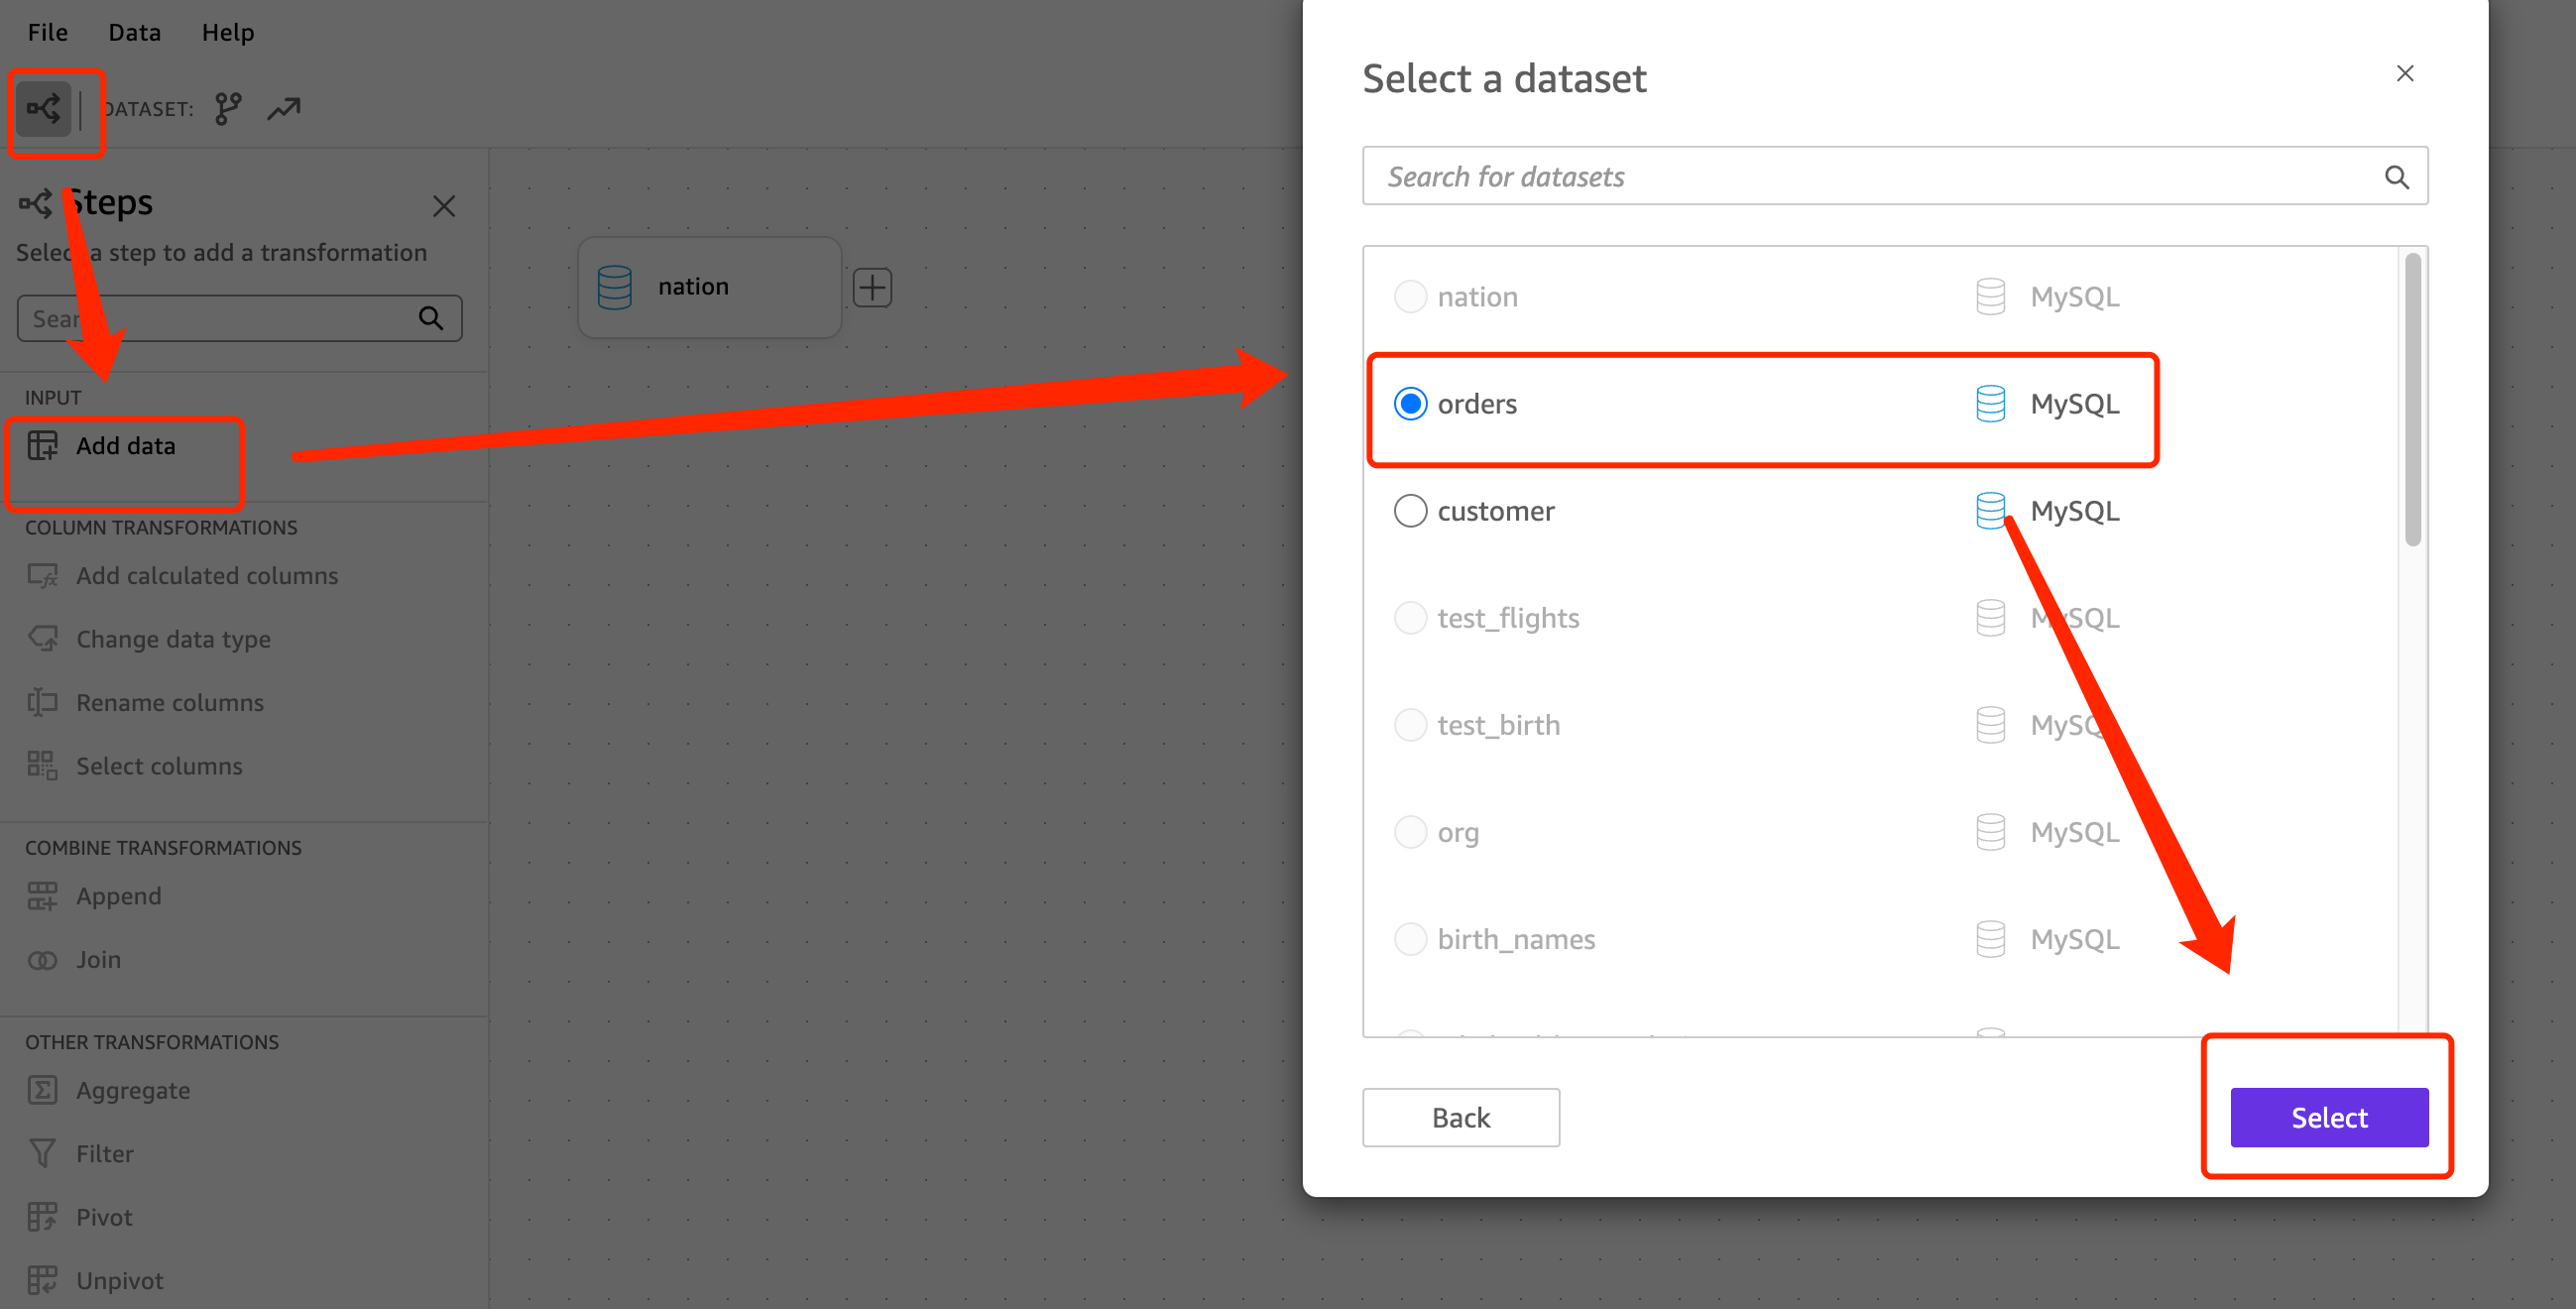
Click Add data to add a data source.
-
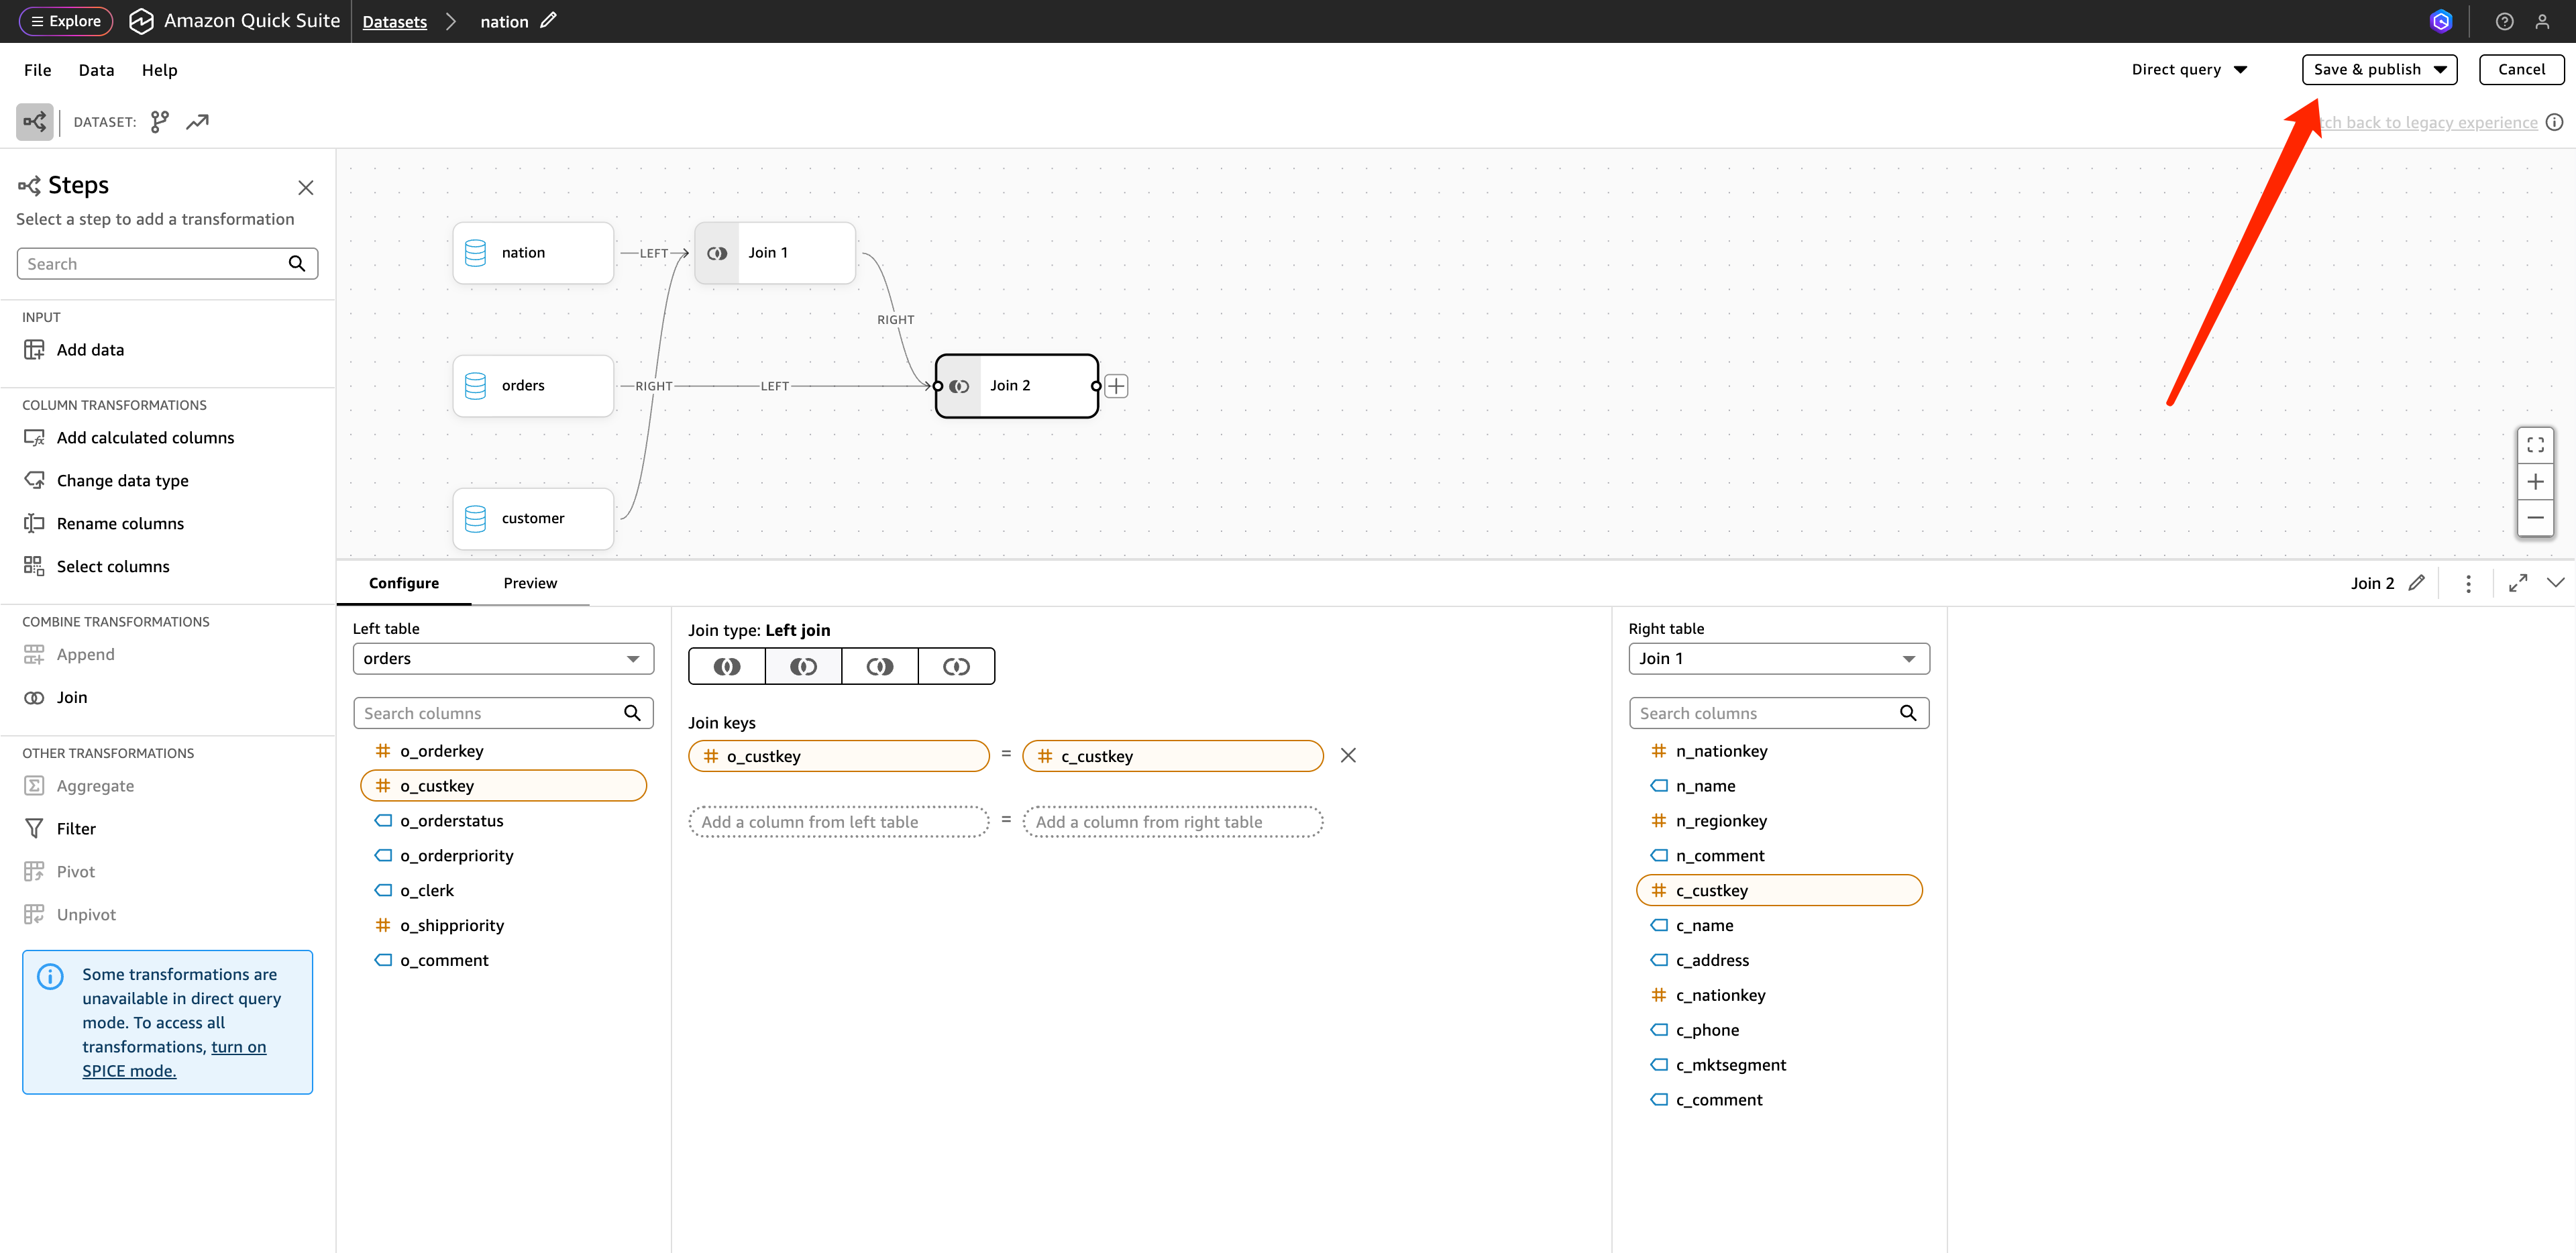
After adding all three tables, configure the association keys. The associations are as follows:
Left table Left field Right table Right field customerc_nationkeynationn_nationkeycustomerc_custkeyorderso_custkey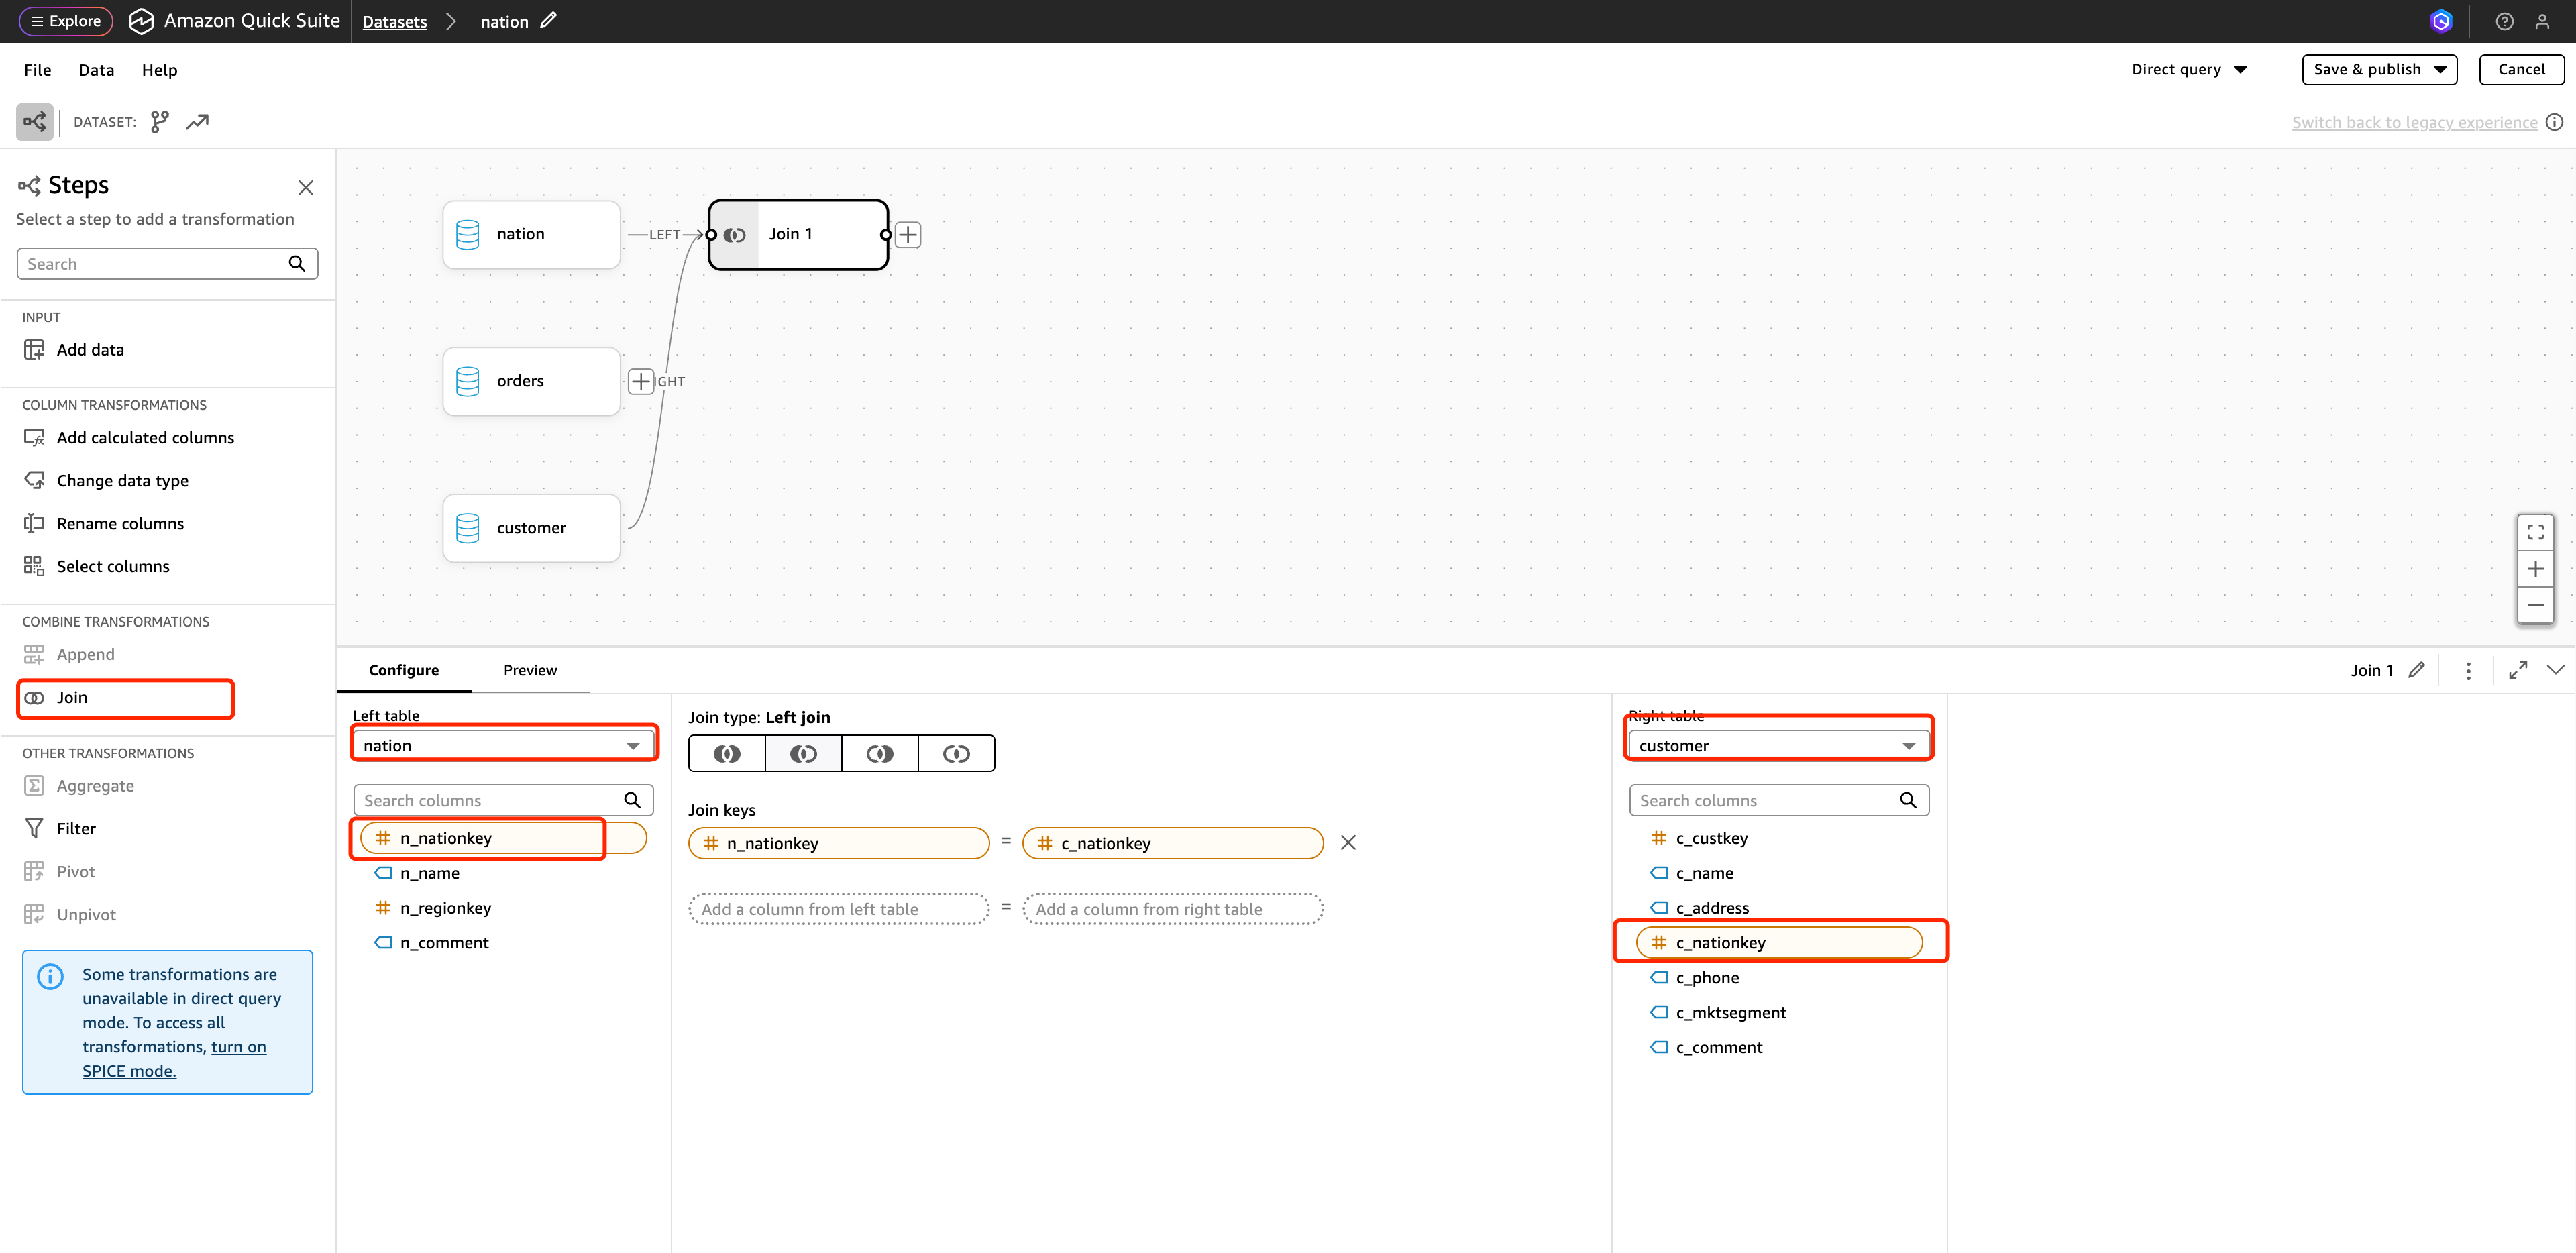
-
After the associations are configured, click Save & publish in the upper-right corner to publish.
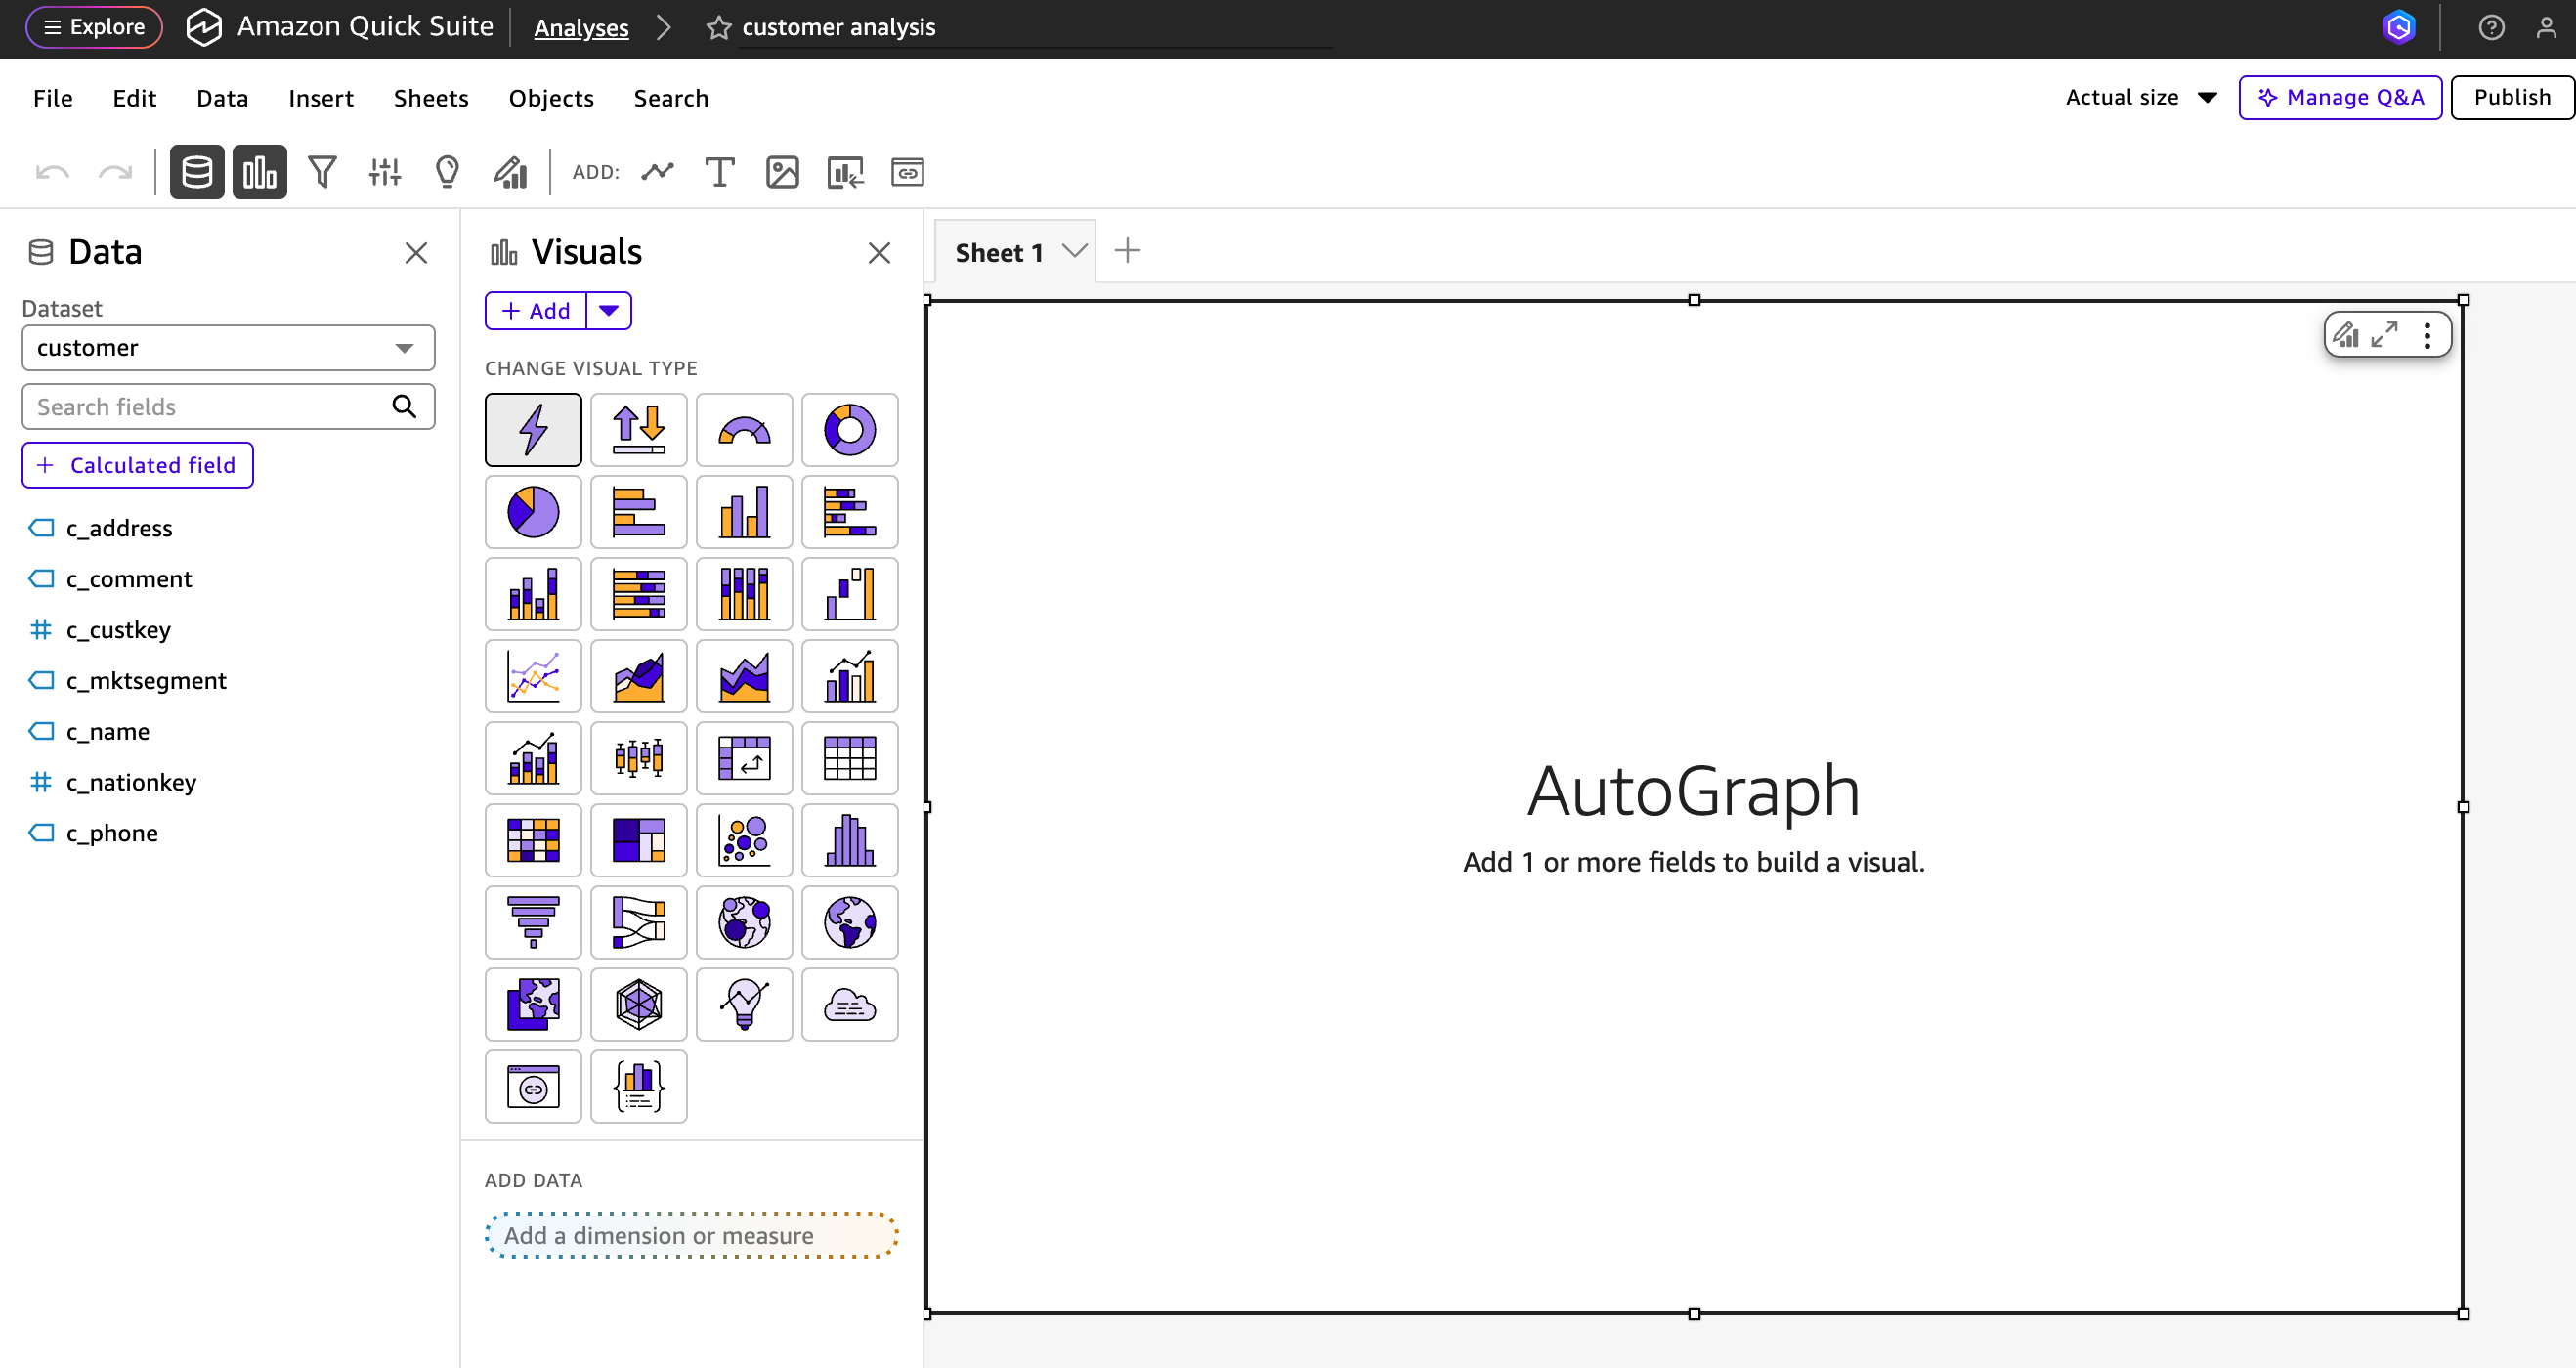
Step 4: Configure charts and publish the dashboard
-
Return to the Analyses interface where the three data sources have been added, and click
n_nameto generate a chart that counts the total number of orders by country name.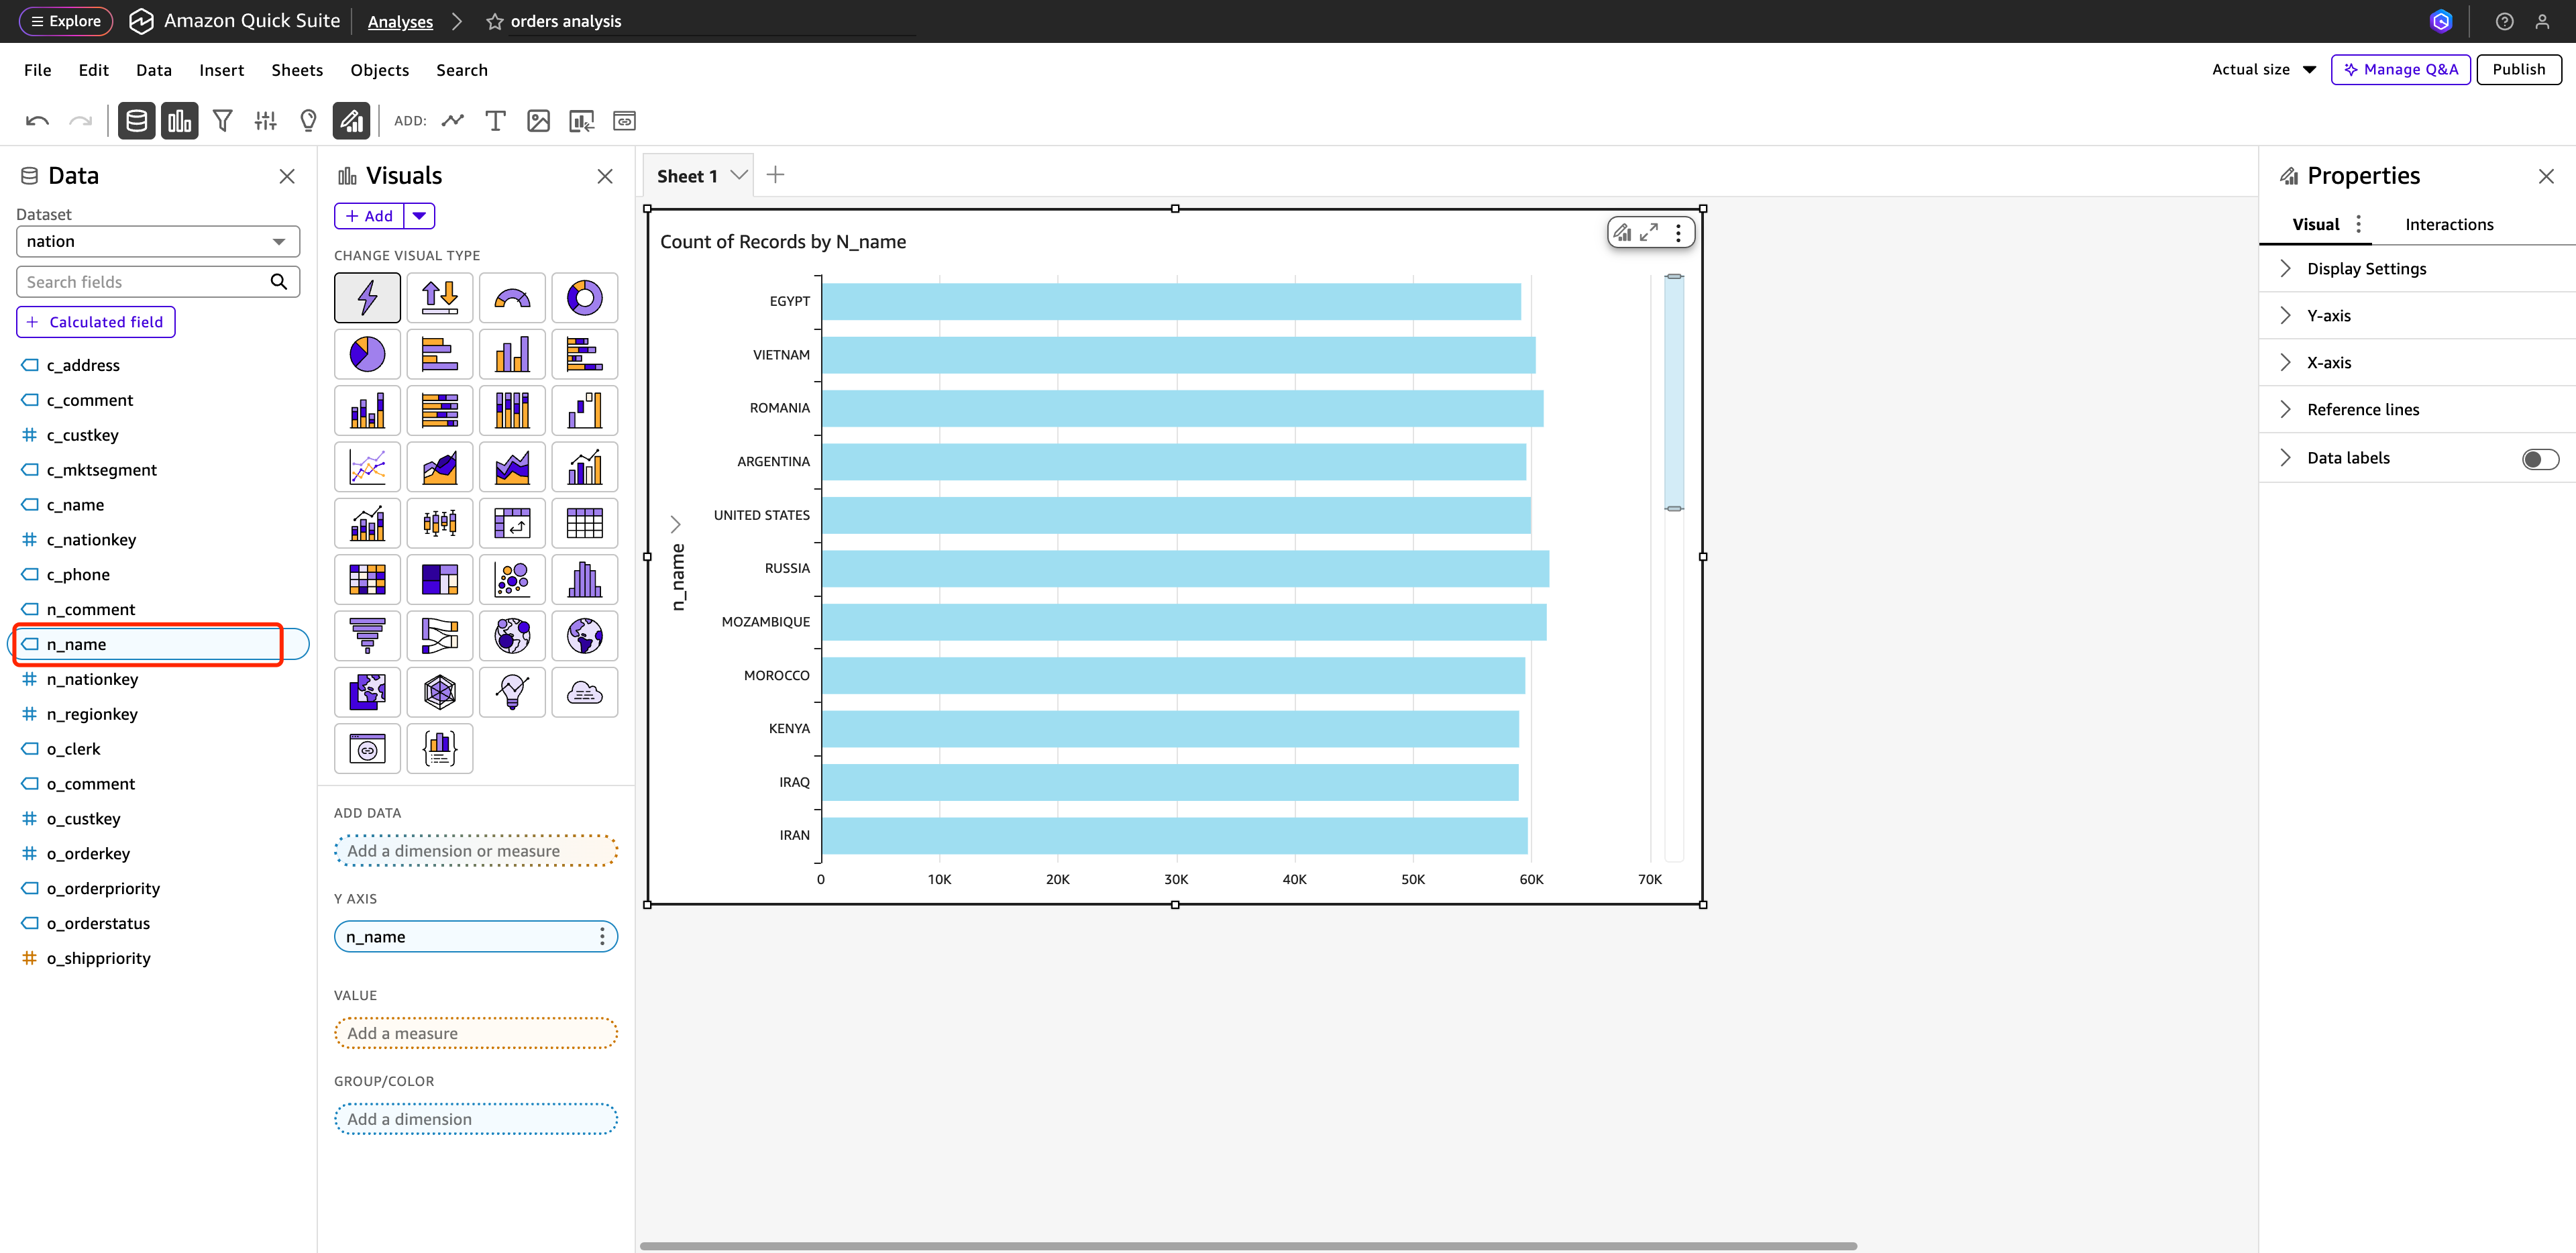
-
Select
o_orderkeyin VALUE ando_orderstatusin GROUP/COLOR to obtain a dashboard that counts the number of orders by country and order status.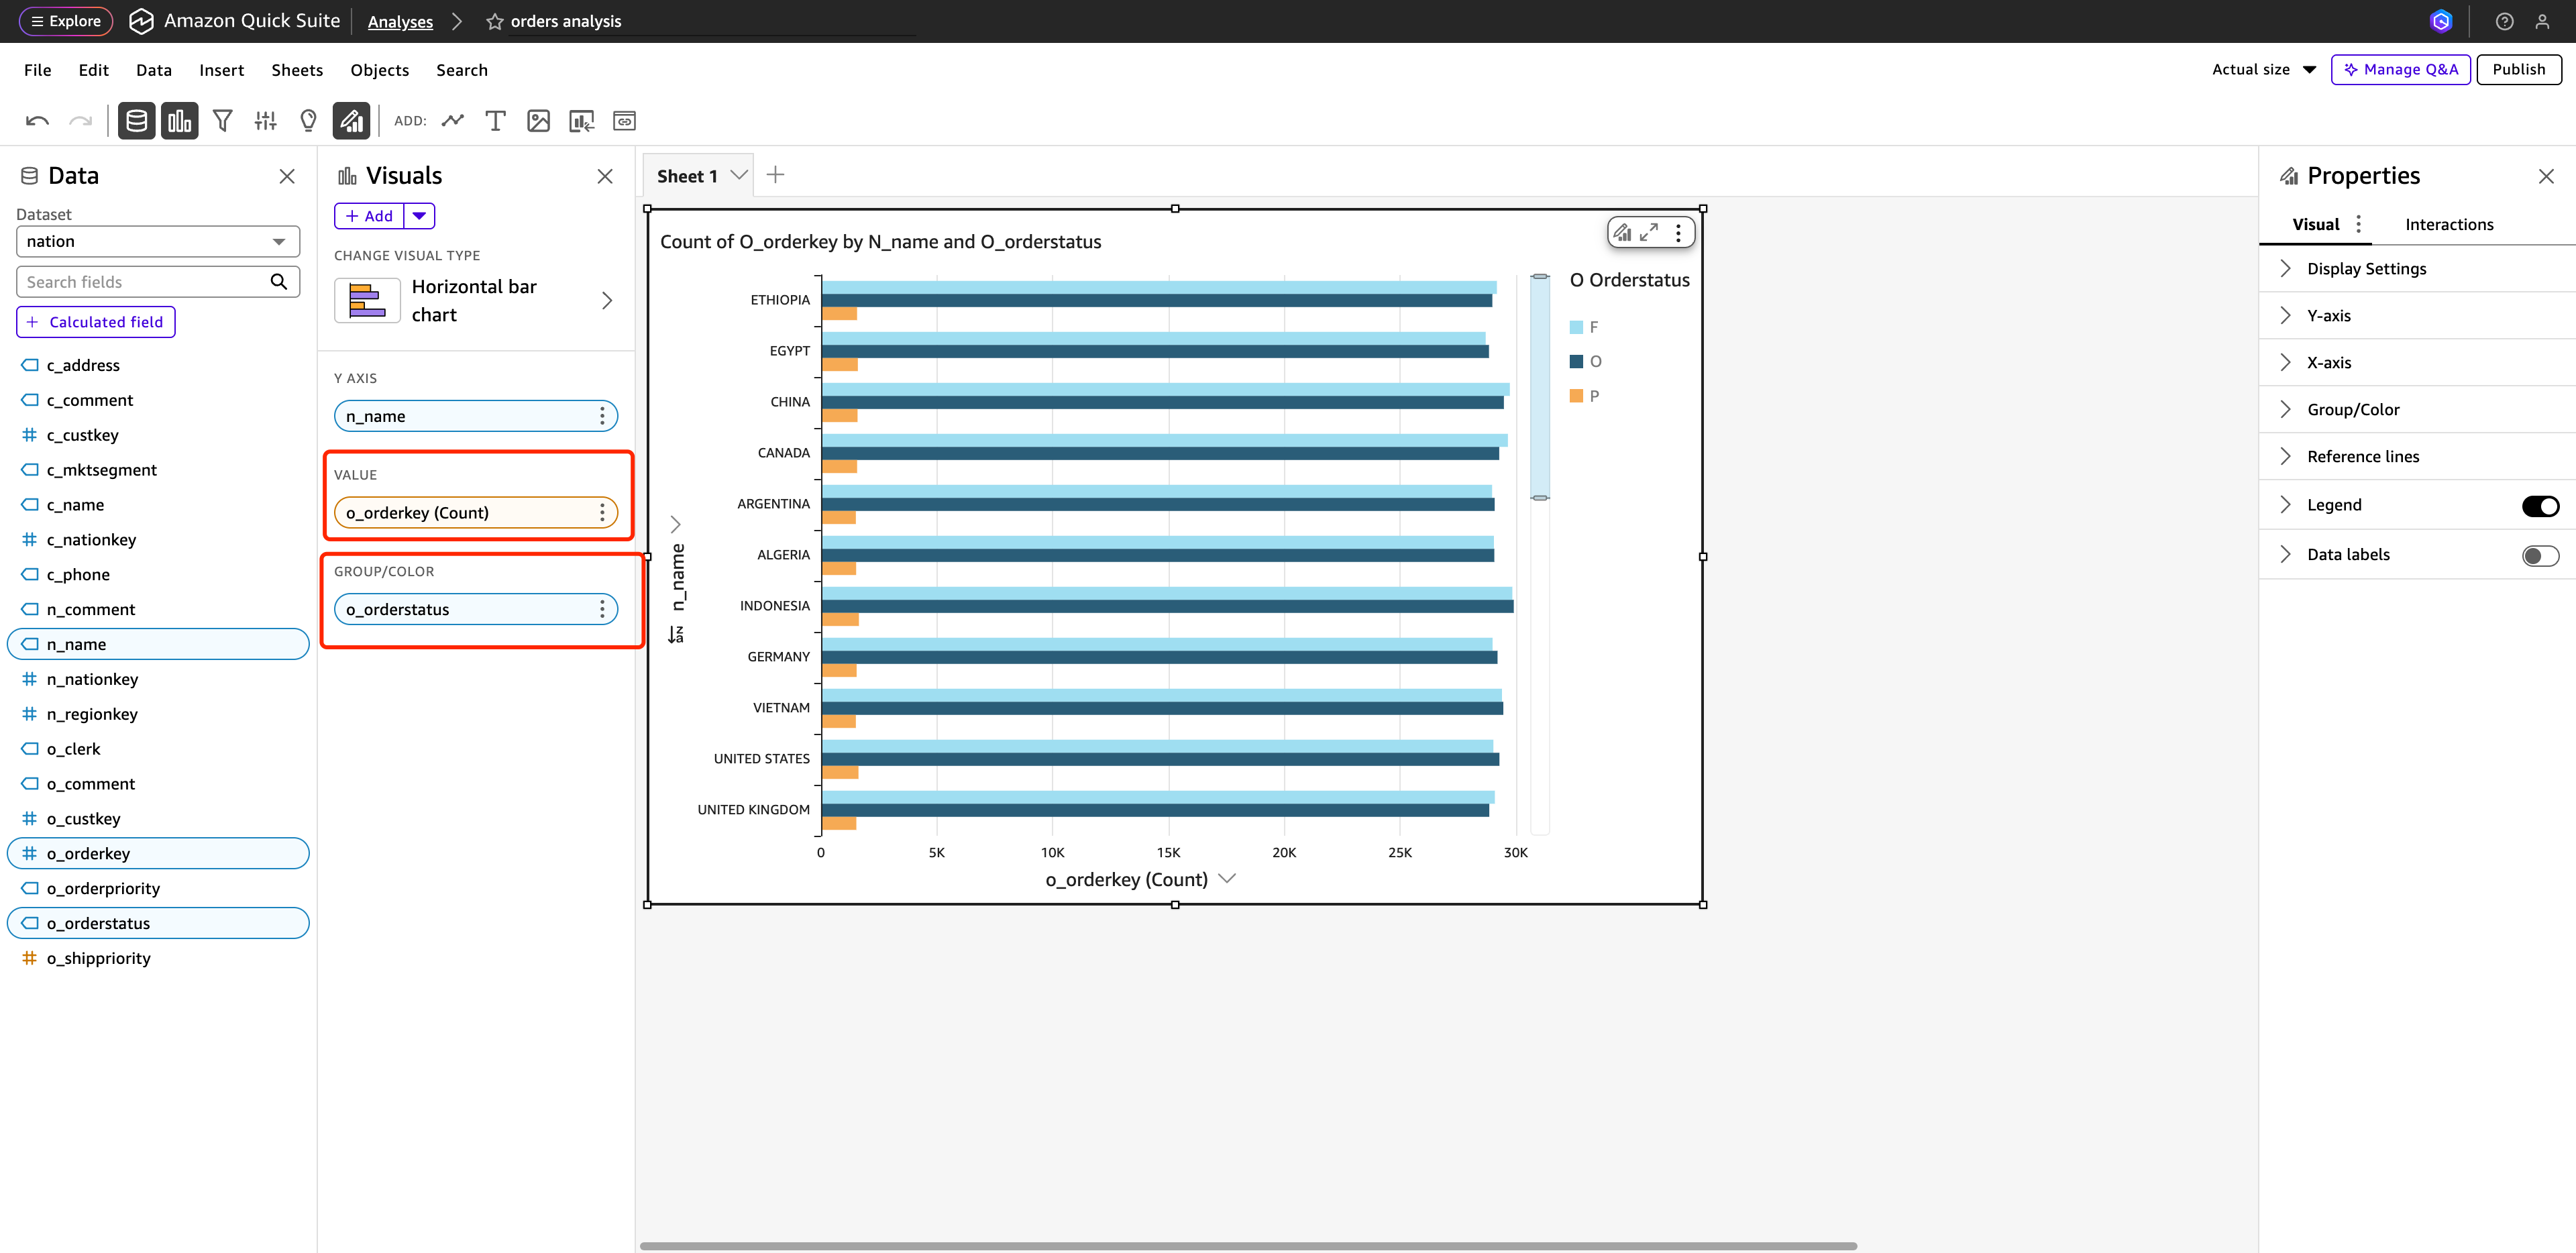
-
Click Publish in the upper-right corner to complete the dashboard publication.
Result
You have now successfully connected QuickSight to Apache Doris and built data analysis and visualization dashboards.