Tableau
Tableau is a leading business intelligence (BI) and data visualization tool. Apache Doris is compatible with the MySQL protocol, so you can connect to it directly through Tableau's official MySQL connector (based on the MySQL JDBC Driver), without any dedicated plugin.
This document targets the following typical scenarios:
- You have an existing Apache Doris cluster and want to perform data exploration and report development in Tableau.
- You need to use detail data or aggregated results from Doris as the data source for Tableau workbooks.
- You want to publish analytical results from Doris through Tableau dashboards.
After completing the steps in this document, you will be able to:
- Install and configure Tableau Desktop and the MySQL JDBC driver in your local environment.
- Create a data source connection from Tableau to Apache Doris.
- Build visual charts and dashboards in Tableau on top of Doris data sources.
Prerequisites
Before you start, make sure the following requirements are met:
| Item | Requirement |
|---|---|
| Apache Doris cluster | Accessible, with the FE MySQL protocol port (default 9030) open |
| Database account | Has read permission on the target database |
| Tableau Desktop | Latest version installed (download page) |
| MySQL JDBC Driver | Version 8.3.0 (download link) |
Step 1: Install Tableau and the JDBC driver
-
Download and install Tableau Desktop.
-
Download MySQL JDBC Driver 8.3.0.
-
Place the JDBC driver jar file in the directory designated by Tableau:
Operating System Driver Path macOS ~/Library/Tableau/DriversWindows %tableau_path%\Drivers\(defaulttableau_path = C:\Program Files\Tableau) -
Restart Tableau Desktop so that the driver takes effect.
Step 2: Configure the Apache Doris data source in Tableau
After installing the driver, you can create a data source in Tableau that connects to Doris (the example uses the tpch database).
1. Prepare connection information
The parameters required to connect to Apache Doris through JDBC are as follows:
| Parameter | Description | Example |
|---|---|---|
| Server | Host address of the Doris FE | 127.0.0.1 |
| Port | MySQL protocol port of the Doris FE | 9030 |
| Database | Database name | tpch |
| Username | User name | testuser |
| Password | Password | (fill in based on your account) |
| Init SQL Statement | Initialization SQL automatically executed after the connection is established | select * from database.table |
2. Create the connection
-
Start Tableau Desktop. If it is already running, restart it to load the driver.
-
In the left-hand menu, under To a Server, click More, then search for MySQL in the connector list:
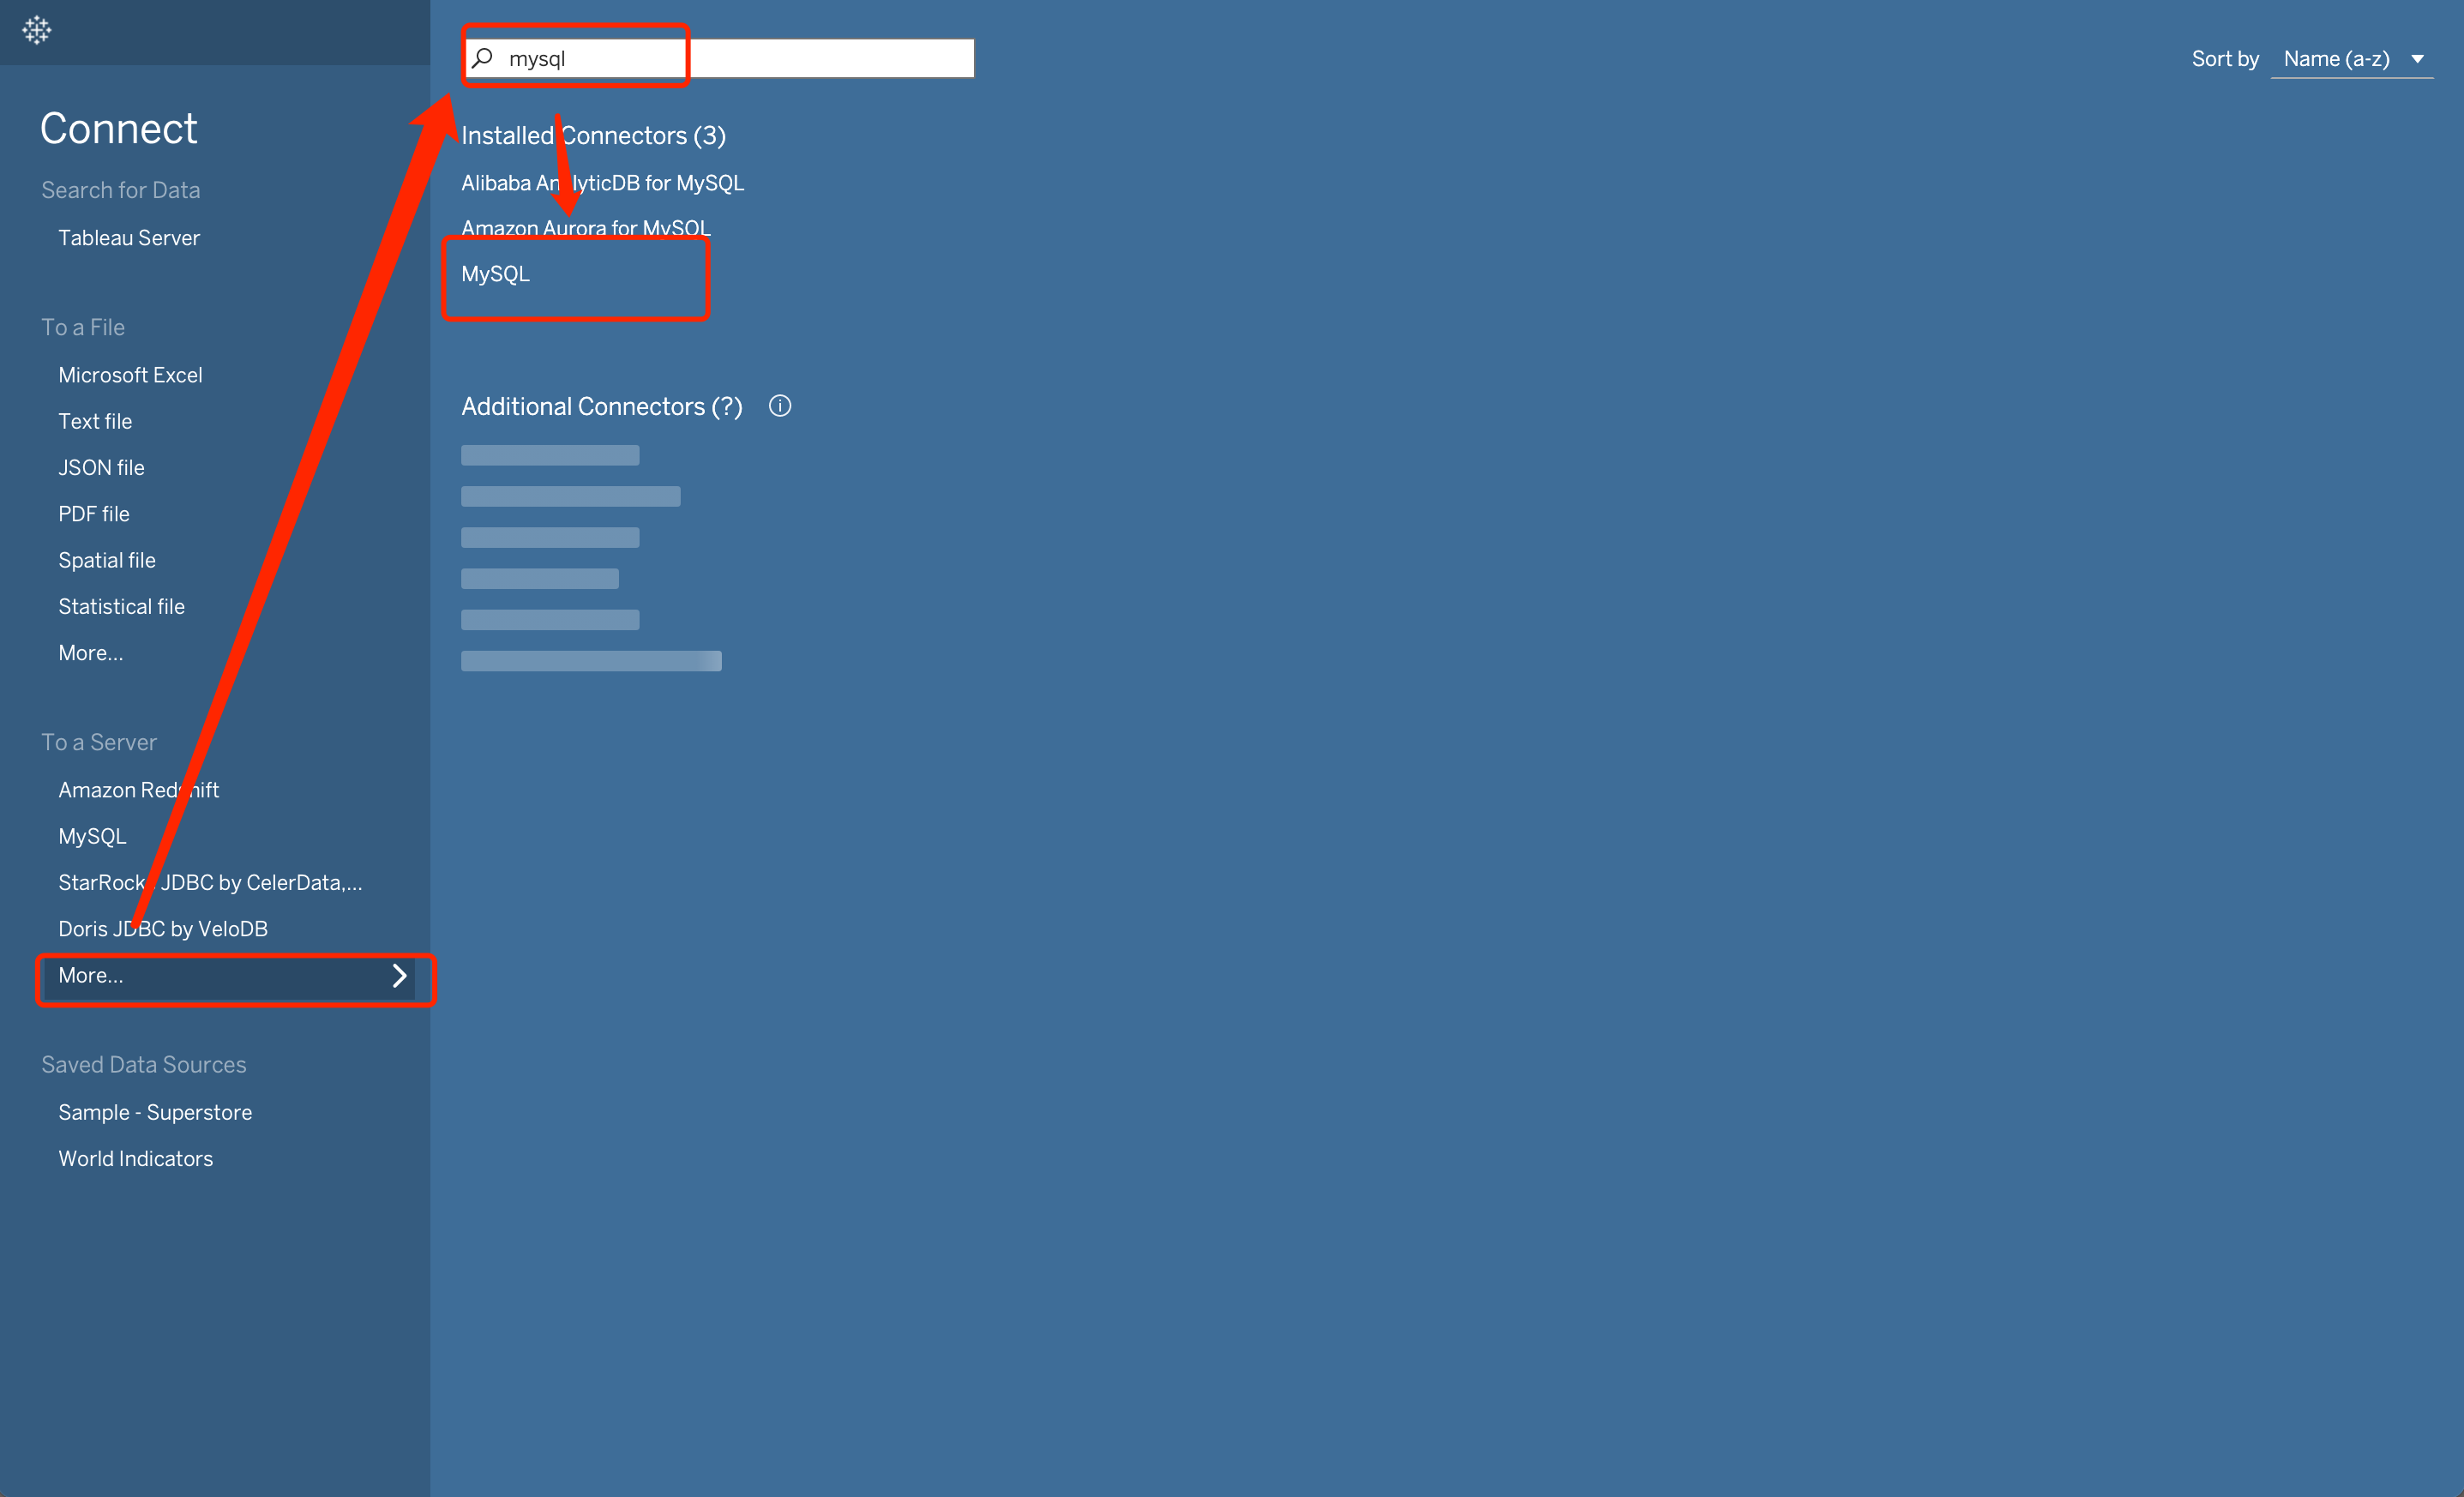
-
Click MySQL to open the connection configuration dialog:
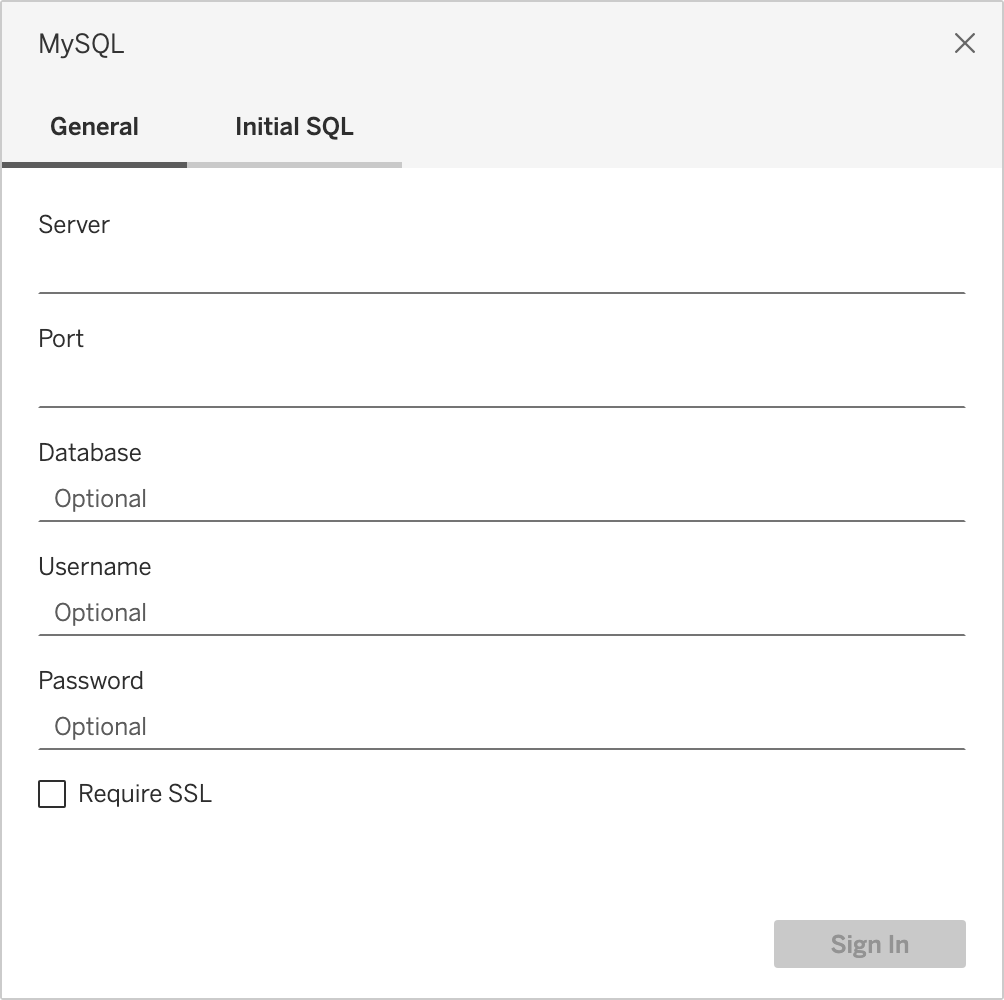
-
Fill in the connection information you prepared in the previous step, following the prompts in the dialog.
-
Click Sign In. After the connection succeeds, a new Tableau workbook opens:
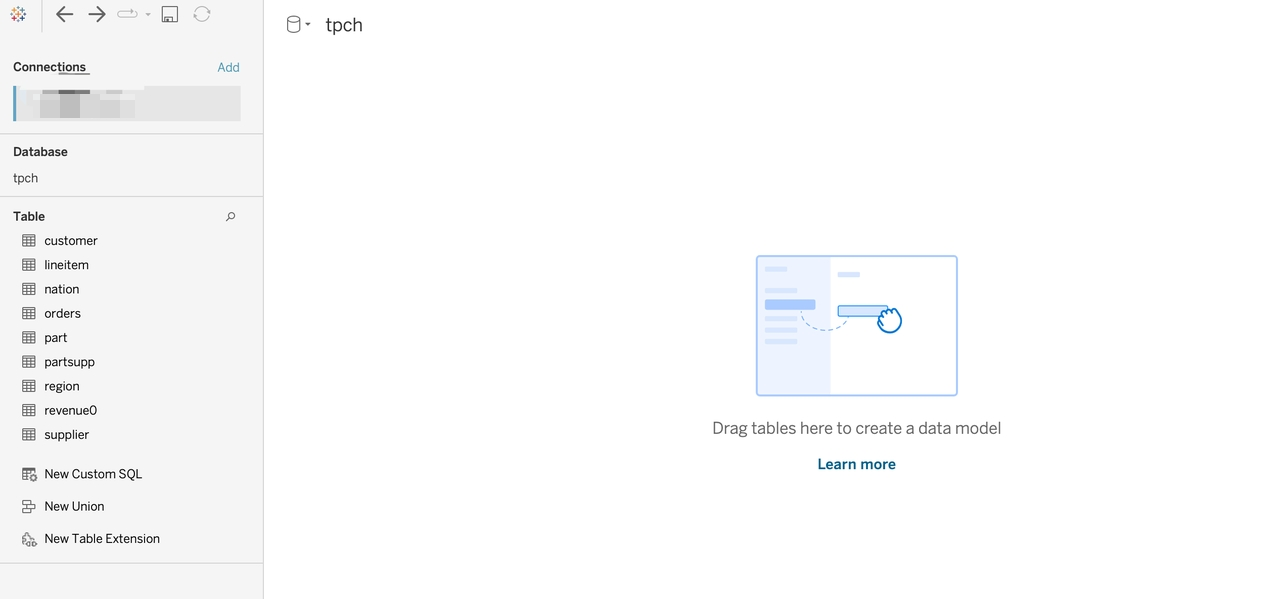
Step 3: Build visualizations in Tableau
The following example uses the TPC-H dataset to demonstrate how to build visualizations on top of a Doris data source. For instructions on building TPC-H data, see the TPC-H Benchmark documentation.
1. Join the data tables
-
Drag the
customerandorderstables into the workbook, and set the join field toCustkeyin the panel below: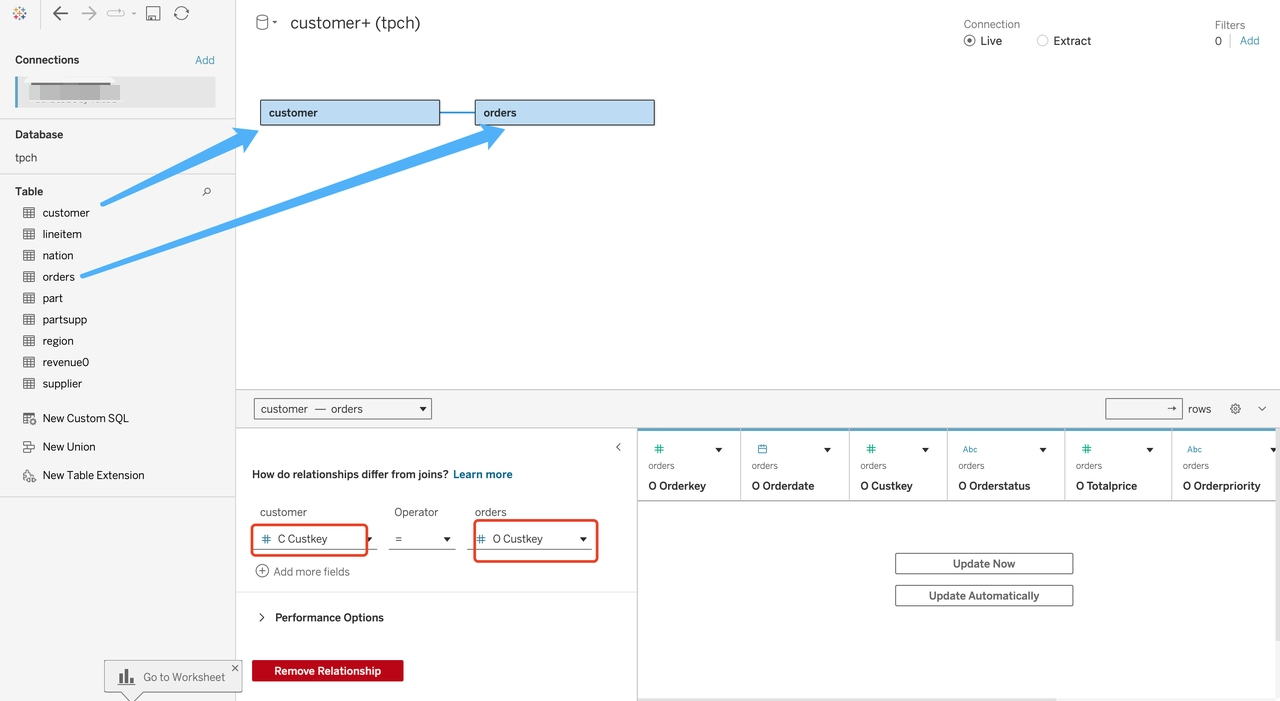
-
Drag the
nationtable into the workbook and set the join field withcustomertoNationkey: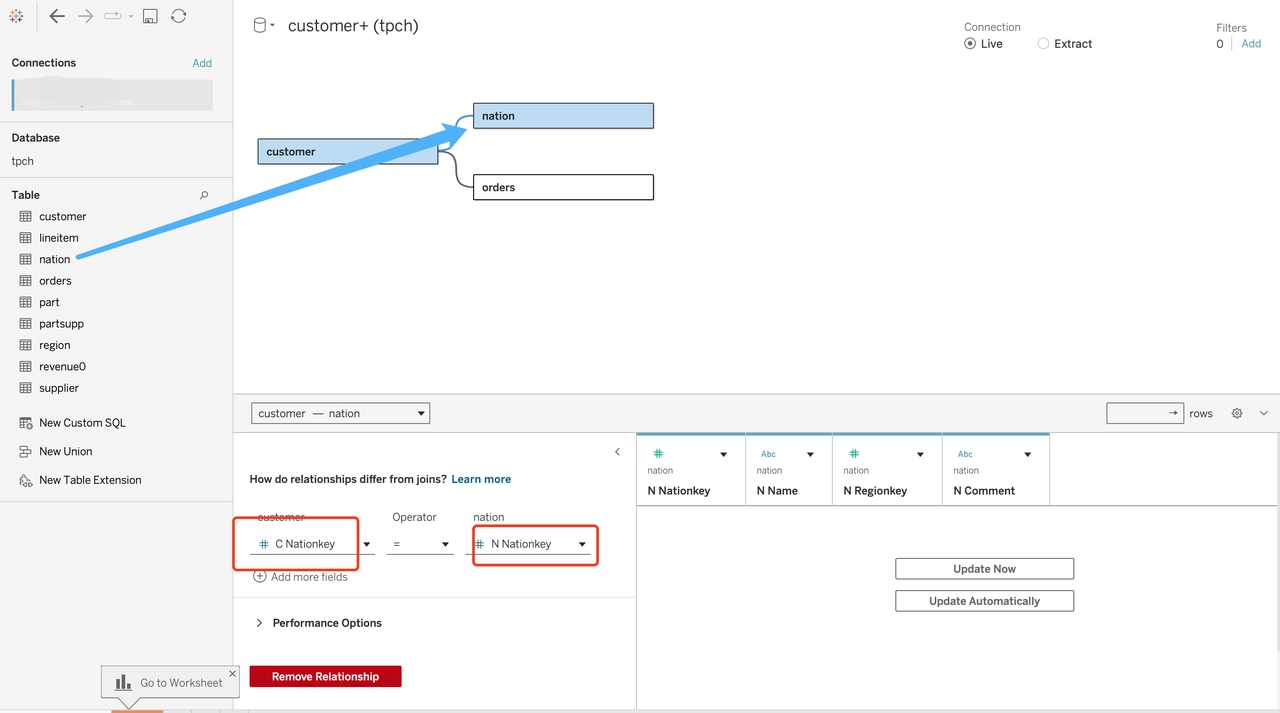
-
After joining the three tables, you have a data source ready for analysis. Click the
Sheet 1tab at the bottom of the workbook to enter the worksheet: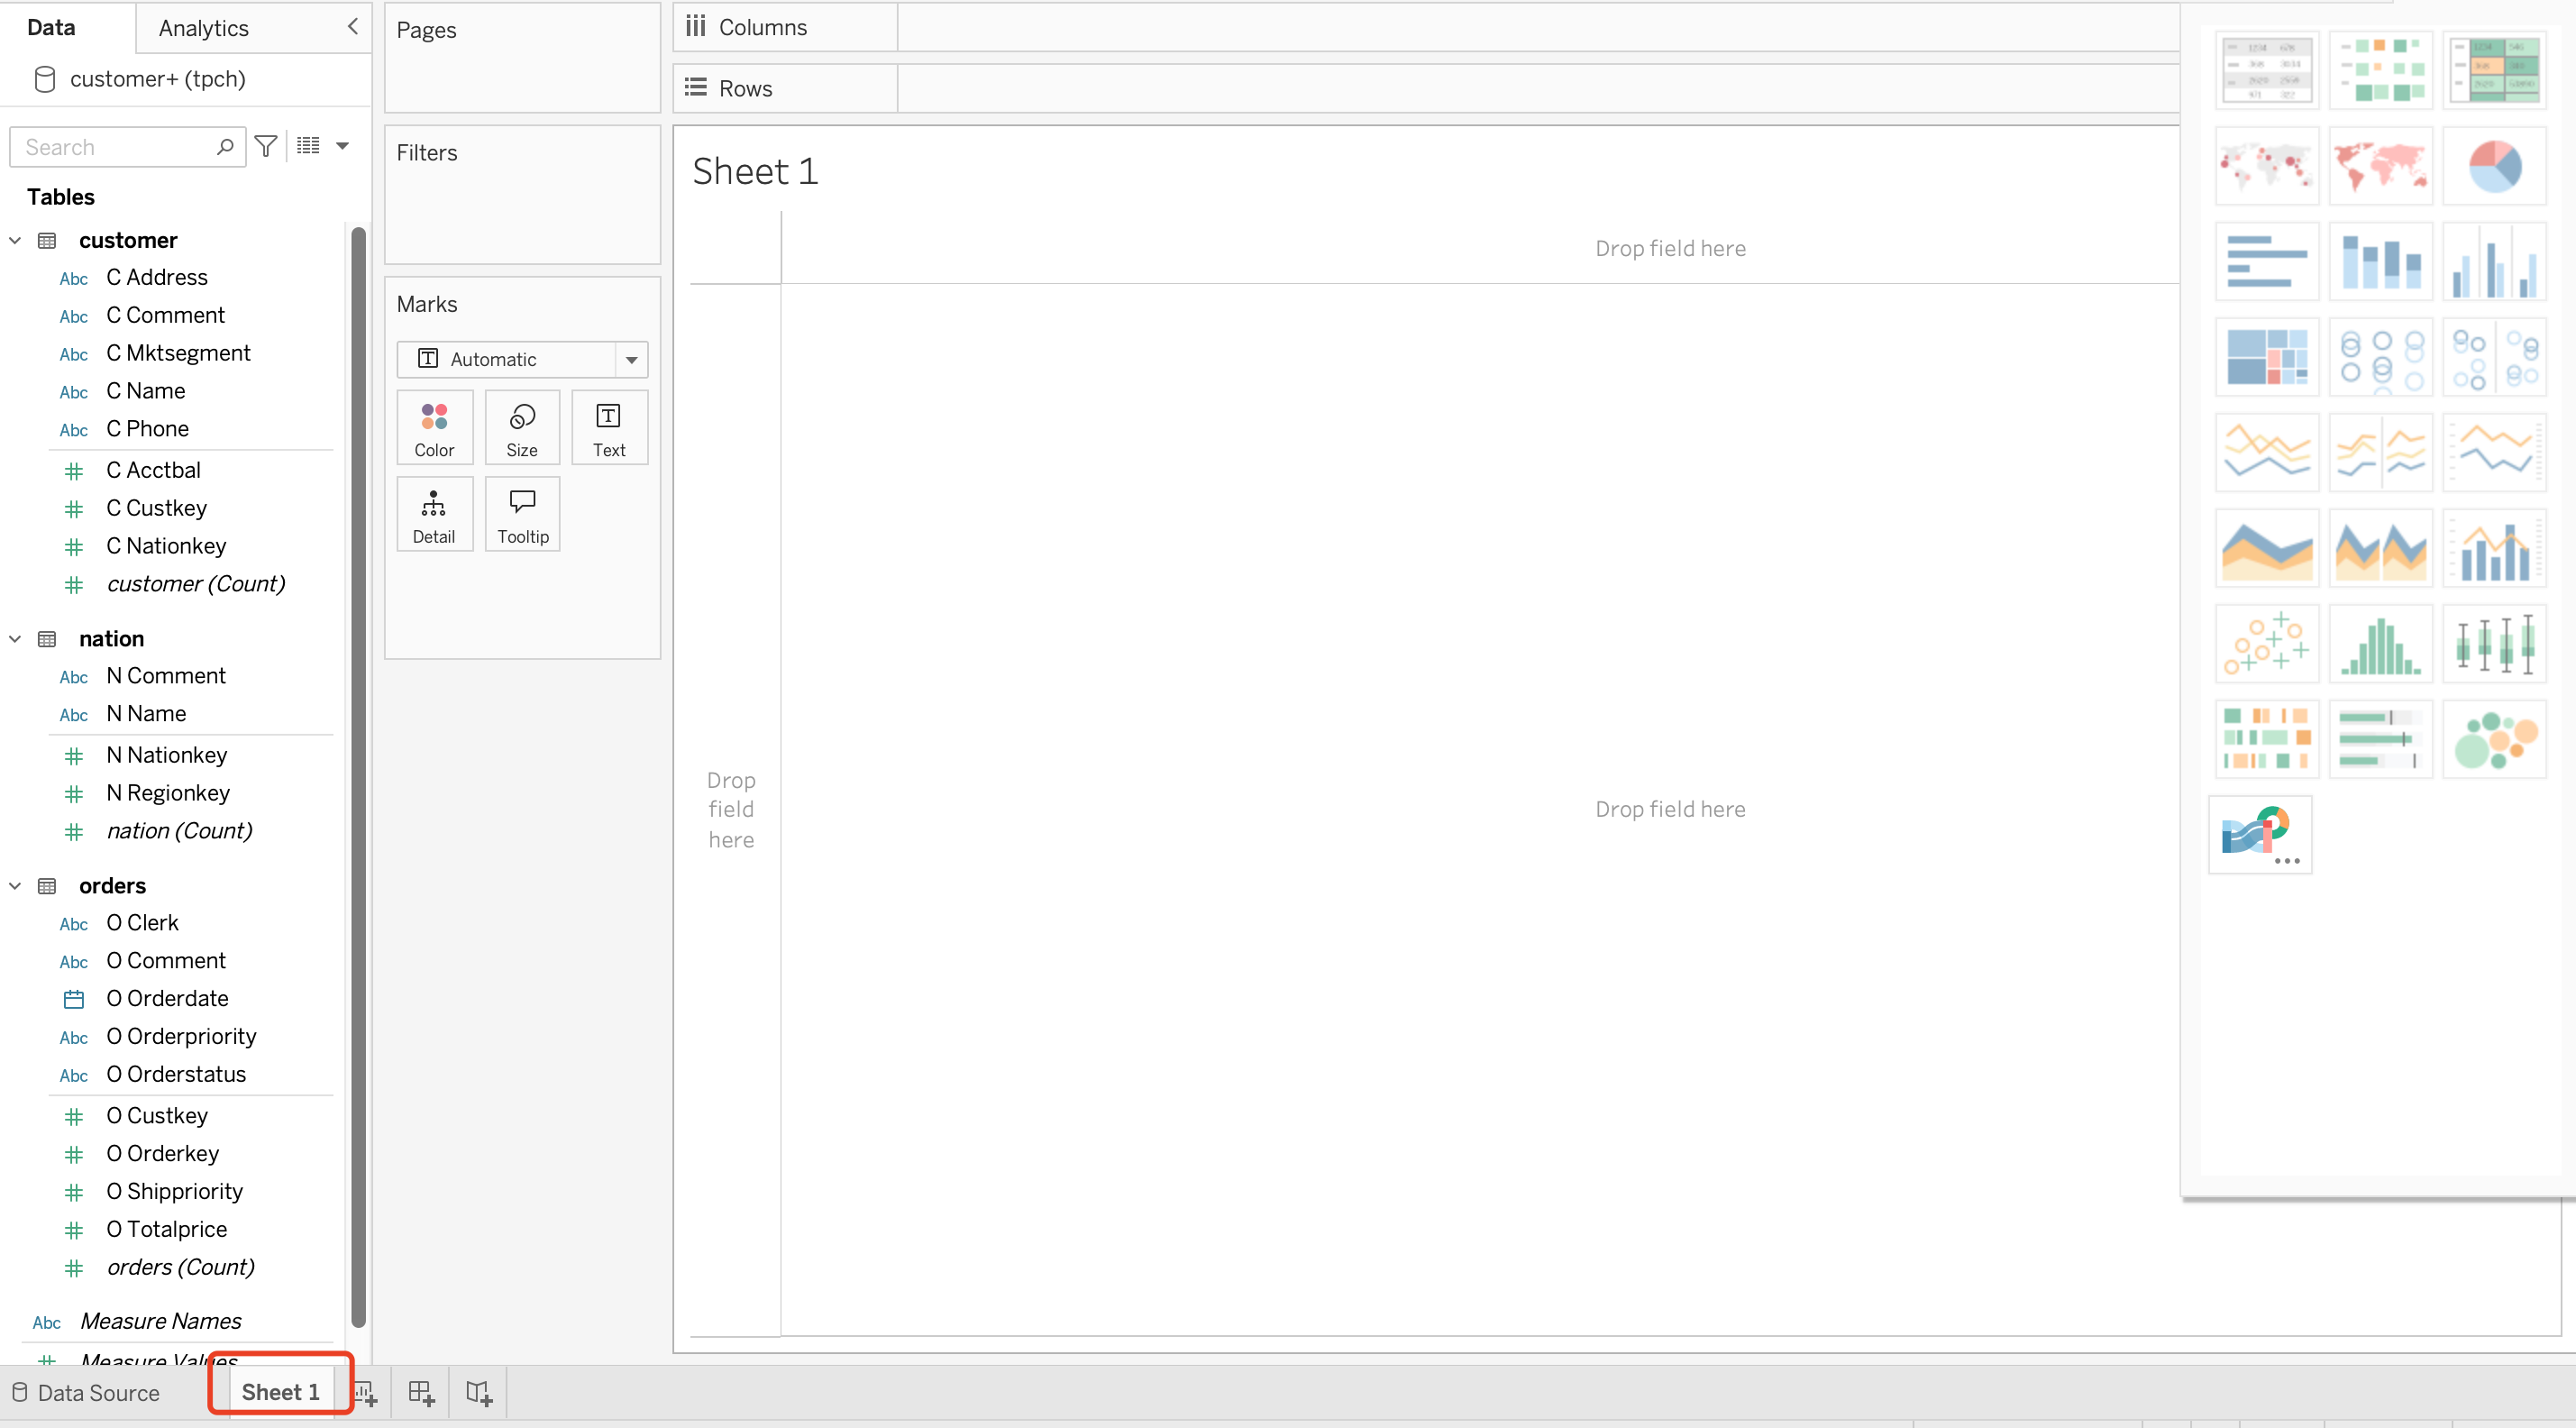
2. Scenario A: Annual customer count summary (line chart)
Drag OrderDate (from orders) into Columns, and drag customer(count) (from customer) into Rows. Tableau then generates a line chart:
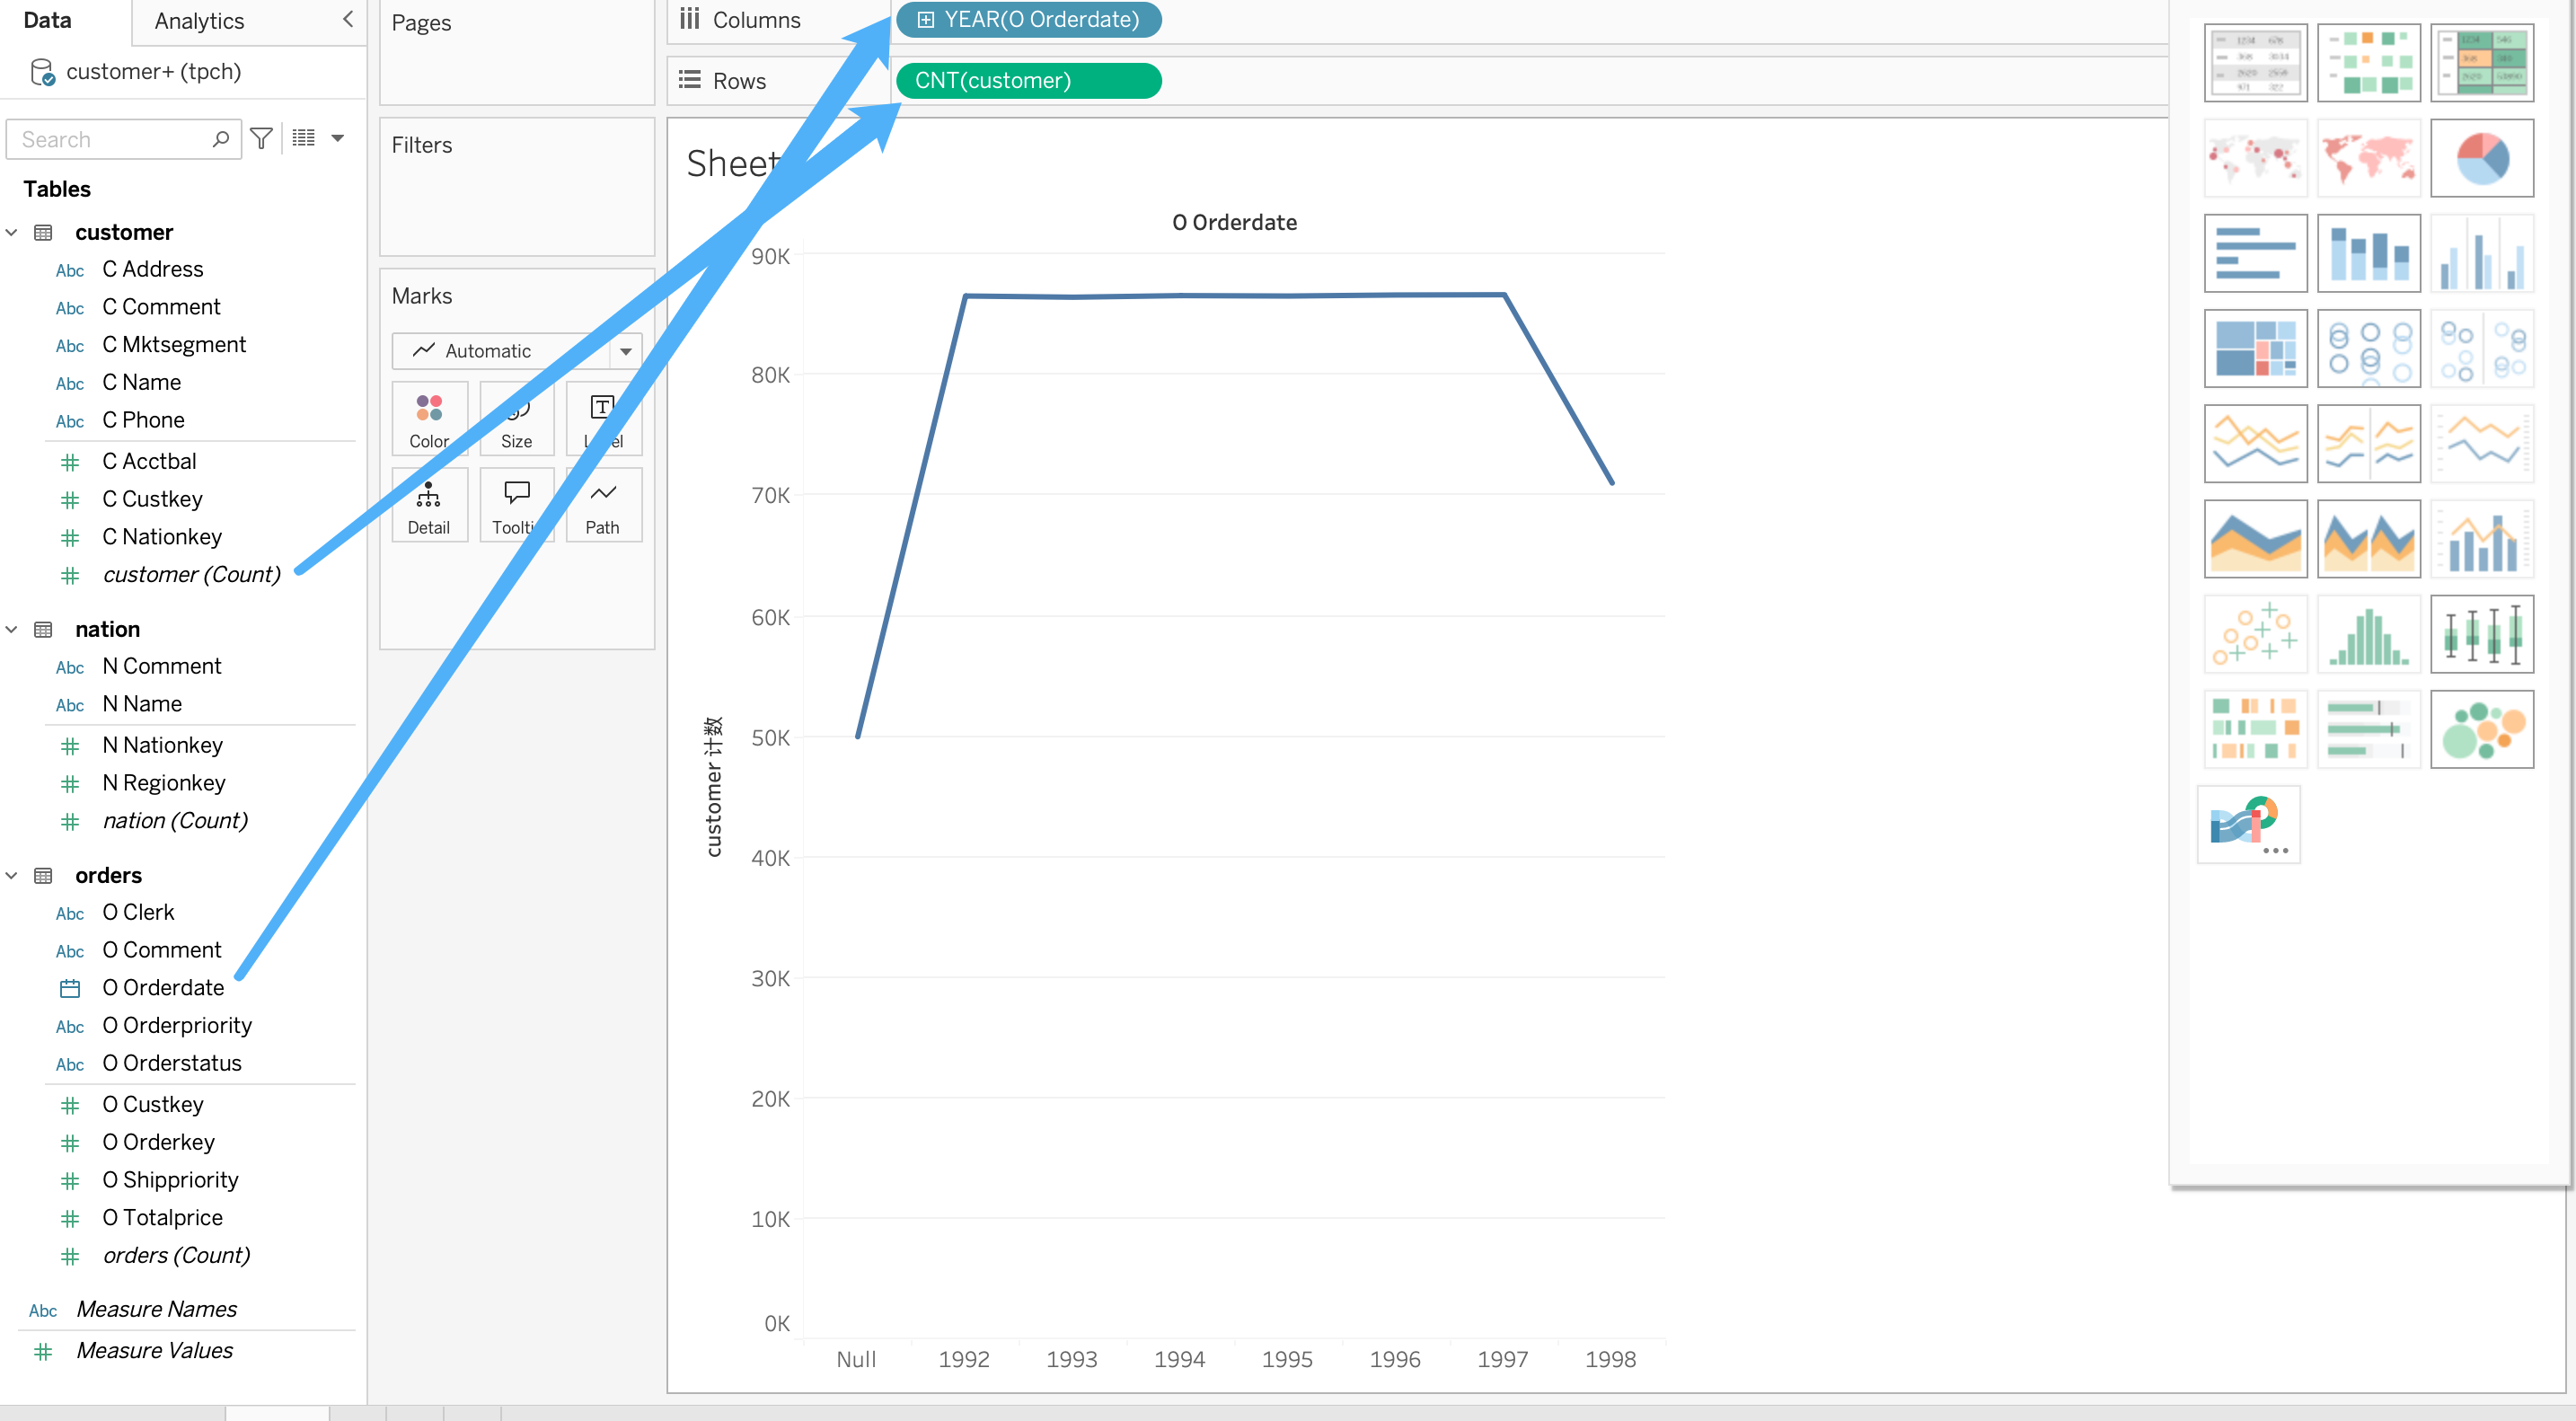
The TPC-H dataset is generated by a script using default rules and is not real business data. The results are intended only for feature demonstration and connectivity verification.
3. Scenario B: Average order amount by region and year
-
Click
New Worksheetto create a new sheet. -
Drag
Name(fromnation) intoRows. -
Drag
OrderDate(fromorders) intoColumns.At this point, the table shows
Abcplaceholder values because no aggregated measure has been specified. -
Drag
Totalprice(fromorders) into the center of the table. The default aggregation isSUM: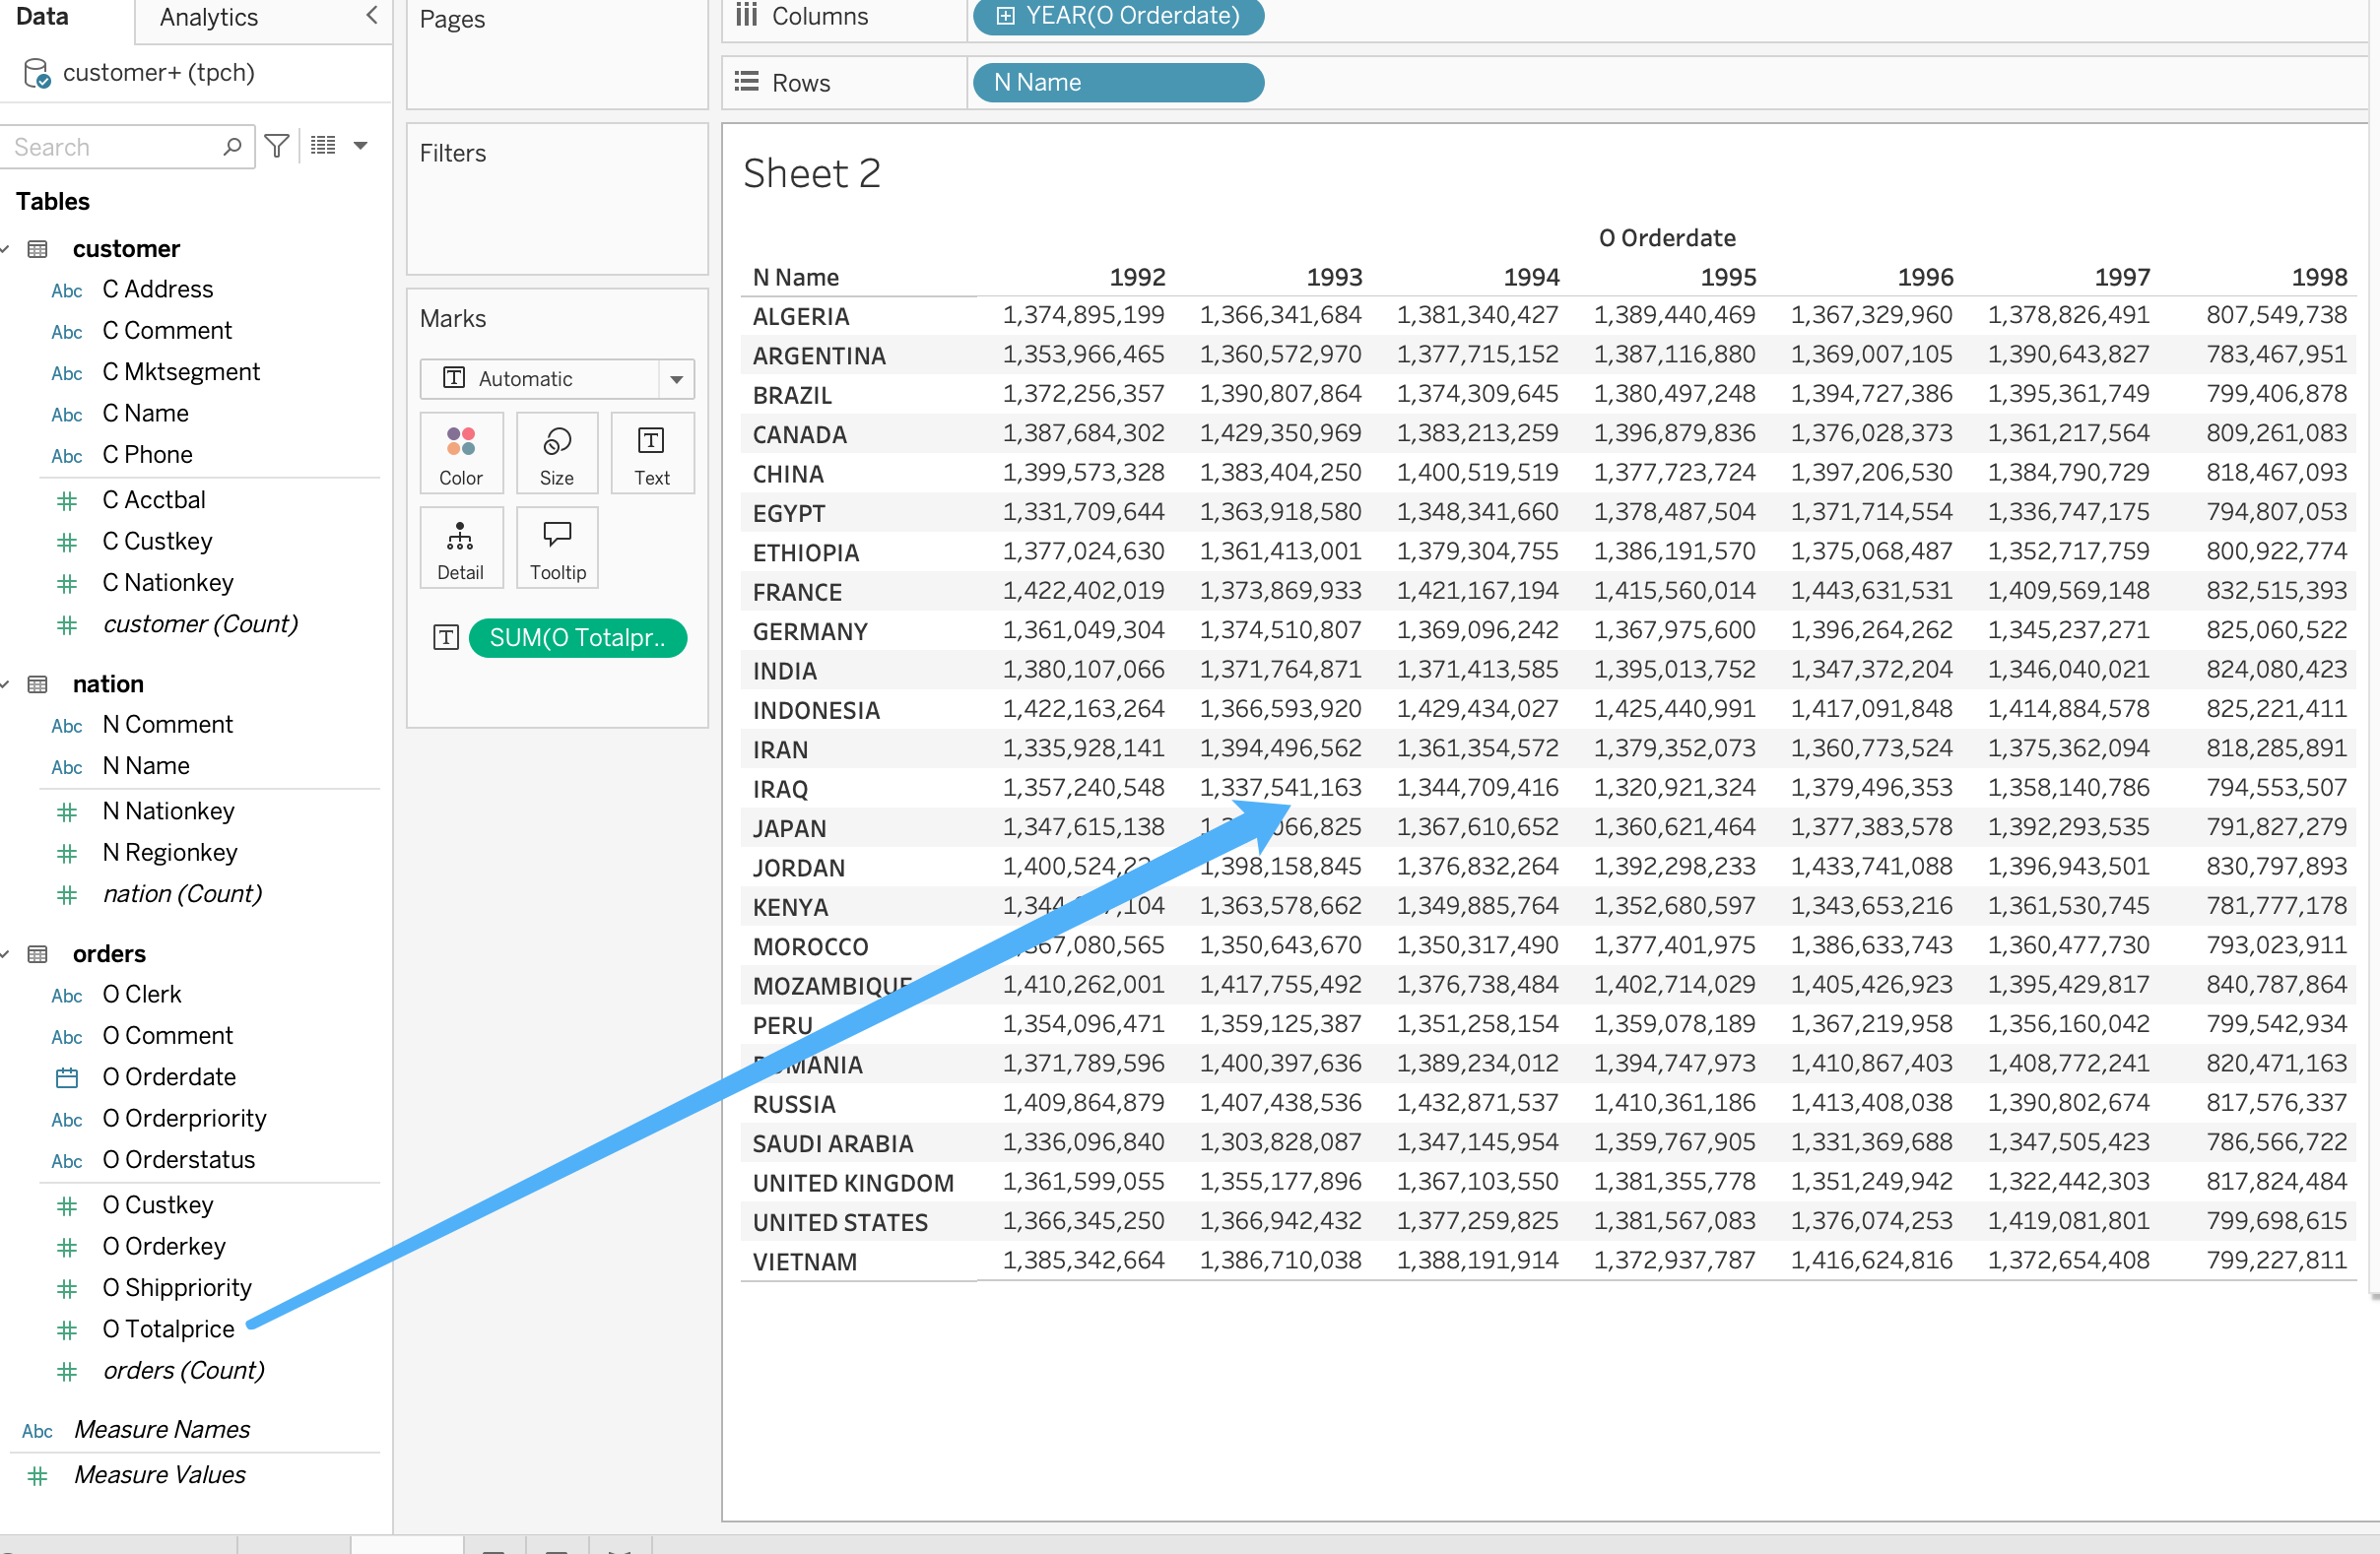
-
Click
SUMand changeMeasuretoAverage: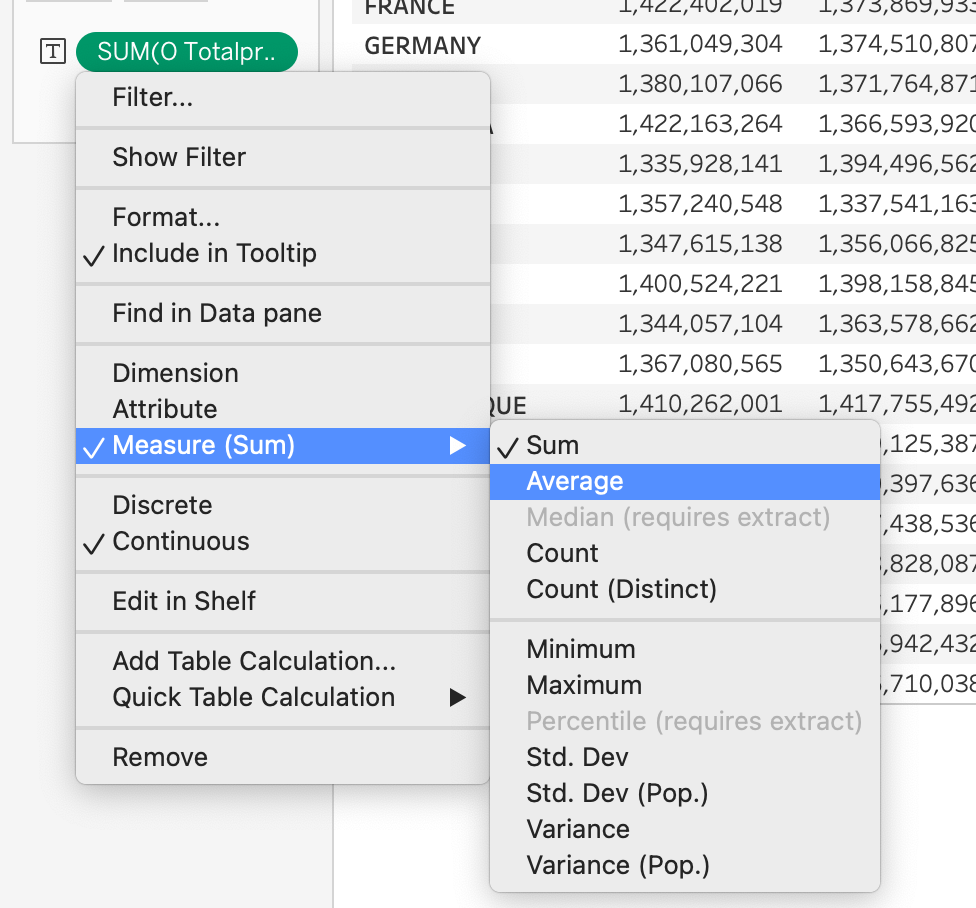
-
In the same drop-down menu, choose
Format, then setNumberstoCurrency (Standard):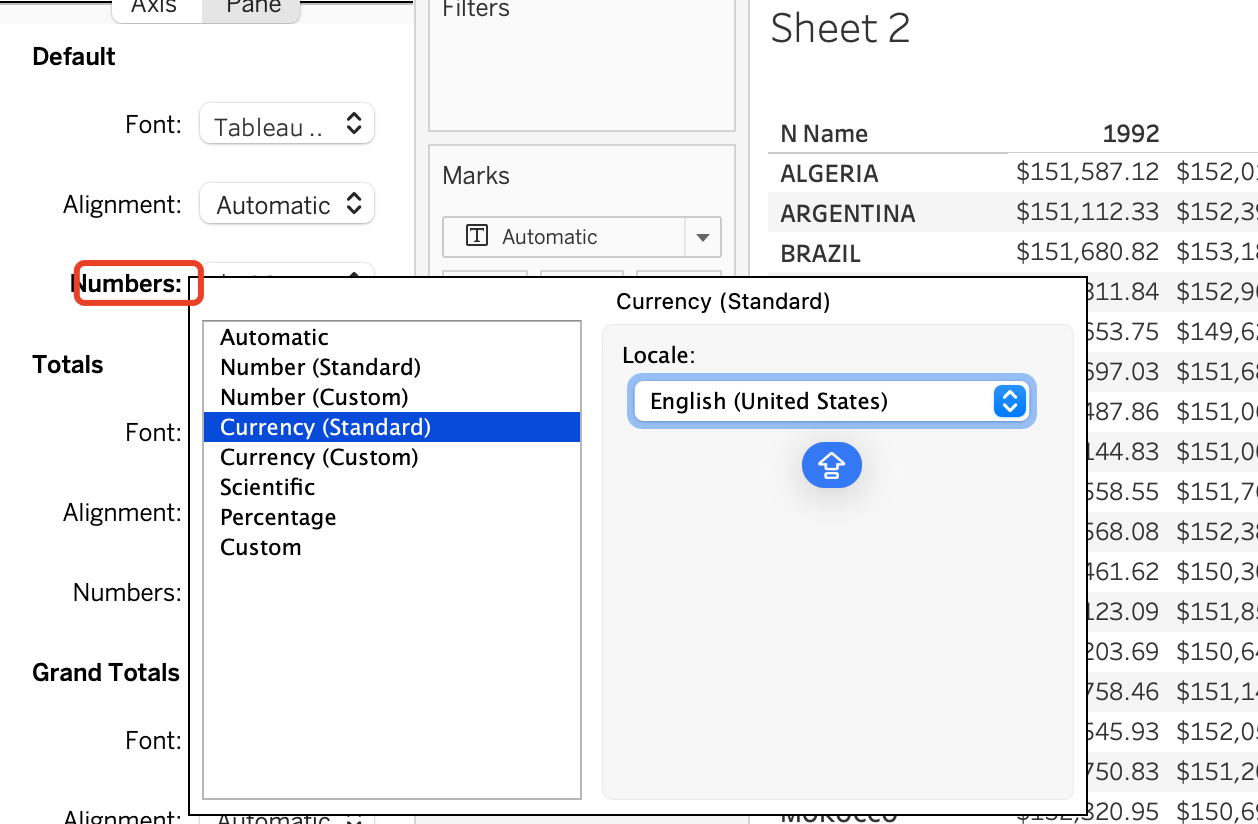
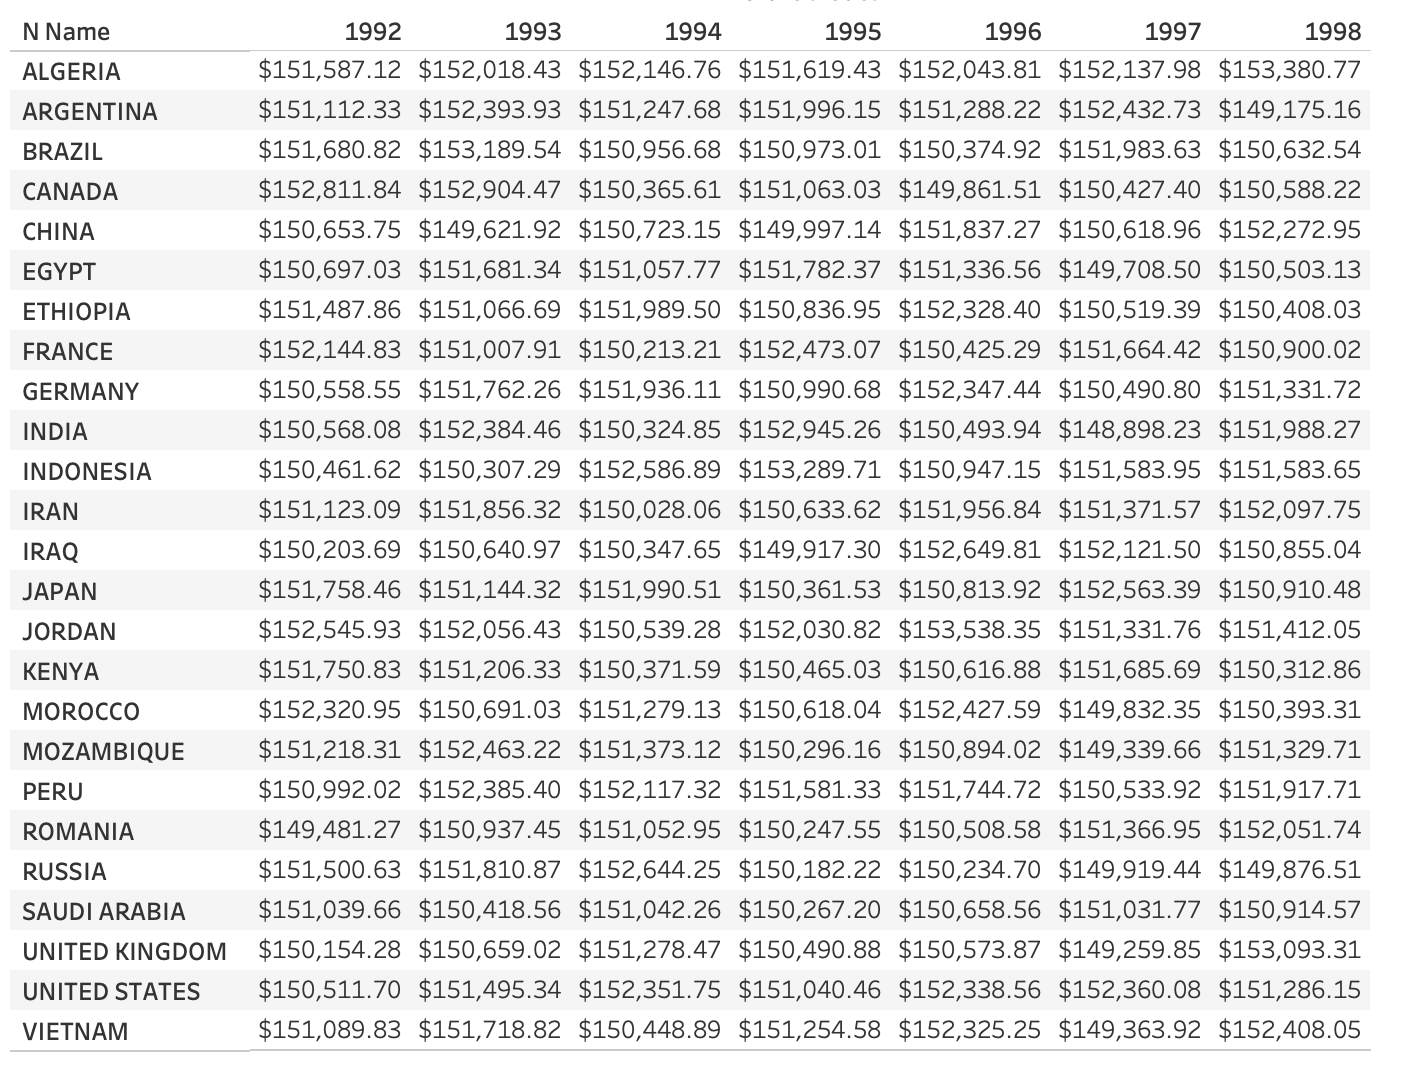
-
The final report matches the expected output:
At this point, you have successfully connected Tableau to Apache Doris and built data analysis and visualization dashboards.
Best practices
Performance optimization
- Design table schemas carefully: Design partitioning and bucketing for Doris tables based on query patterns to reduce the volume of scanned data and the cost of data transfer.
- Use materialized views: For high-frequency aggregation queries, create materialized views in Doris to precompute aggregations and speed up Tableau dashboard responses.
- Set a reasonable refresh schedule: Balance refresh frequency against compute resource consumption to keep dashboards timely while controlling cluster load.
Security configuration
- Network isolation: Use VPC private connections instead of accessing Doris directly over the public network.
- Access control: Restrict the source of access to Doris ports through security groups.
- Transport encryption: Enable SSL/TLS encrypted connections.
- Principle of least privilege: Configure Doris user roles and permissions in a fine-grained way to avoid over-authorization.