Deploy Prometheus and Grafana
This document describes how to deploy Prometheus and Grafana on Kubernetes with Helm and connect them to an Apache Doris compute-storage decoupled cluster for metric collection, visualization, and alerting. Prometheus scrapes the HTTP and bRPC metrics exposed by FE, BE, and Meta Service. Grafana presents the cluster status through dashboards.
Note: This document focuses on the Helm + ServiceMonitor steps on Kubernetes. The cloud dashboard template downloaded in this guide also applies to non-Kubernetes deployments of compute-storage decoupled clusters. For the Doris monitoring architecture, metric format, dashboard panel descriptions, and the full template catalog, see Monitoring and Alerting.
Use Cases
| Scenario | Description |
|---|---|
| New cluster onboarding | Set up monitoring before the Doris compute-storage decoupled cluster goes into production so anomalies can be detected in time. |
| Day-to-day operations | Continuously observe the key metrics of FE, BE, and Meta Service, along with node resource usage. |
| Troubleshooting | Use historical metrics, dashboard views, and alerts to quickly pinpoint performance or availability issues. |
| Capacity planning | Evaluate when to scale out based on the trend of node and component metrics. |
Prerequisites
- A usable Kubernetes cluster with
kubectlalready configured. - A compute-storage decoupled cluster already deployed in the
defaultnamespace through Doris Operator, with all three component types (FE, BE/Compute Group, Meta Service) ready. - Nodes have public network access and can download the Helm installation script, Prometheus Community Charts, and the Grafana Dashboard JSON file.
- Permissions to create namespaces, Helm Releases, ServiceMonitors, and other resources in Kubernetes.
Deployment Overview
- Install Helm, and deploy Prometheus, Grafana, and Alertmanager in one step through
kube-prometheus-stack. - Configure a Prometheus
ServiceMonitorso that Prometheus can auto-discover and scrape the HTTP and bRPC metrics of the Doris cluster. - Log in to Grafana, import the official Doris dashboard, and add a node monitoring panel as needed.
Step 1: Deploy Helm, Prometheus, and Grafana
1.1 Install Helm
Purpose: Install Helm 3 on a local machine or operations node to install and manage the monitoring components on Kubernetes.
curl https://raw.githubusercontent.com/helm/helm/main/scripts/get-helm-3 | bash
1.2 Add the Prometheus Community Helm Repository
Purpose: Register the repository that hosts the kube-prometheus-stack Chart, and refresh the local cache.
helm repo add prometheus-community https://prometheus-community.github.io/helm-charts
helm repo update
1.3 Deploy kube-prometheus-stack
Purpose: Deploy Prometheus, Grafana, Alertmanager, and the related Operator in a dedicated monitoring namespace.
# Create the namespace
kubectl create namespace monitoring

# Deploy kube-prometheus-stack
helm install prometheus prometheus-community/kube-prometheus-stack -n monitoring
1.4 Check Pod Status
Purpose: Confirm that all Pods in the monitoring stack are in the Running state before moving on to the next step.
kubectl get pods -n monitoring
A normal output looks like the following:
NAME                                                     READY   STATUS    RESTARTS         AGE
alertmanager-prometheus-kube-prometheus-alertmanager-0   2/2     Running   8 (5h28m ago)    4d23h
prometheus-grafana-7994c77c7-8nk7j                       3/3     Running   12 (5h28m ago)   5d
prometheus-kube-prometheus-operator-5576477887-dgp8h     1/1     Running   4 (5h28m ago)    5d
prometheus-kube-state-metrics-77885ddddc-hldlw           1/1     Running   4 (5h28m ago)    4d23h
prometheus-prometheus-kube-prometheus-prometheus-0       2/2     Running   0                4h11m
prometheus-prometheus-node-exporter-2tl9s                1/1     Running   4 (5h28m ago)    4d23h
prometheus-prometheus-node-exporter-b58rd                1/1     Running   4 (5h28m ago)    4d23h
prometheus-prometheus-node-exporter-fqp6v                1/1     Running   4 (5h28m ago)    4d23h
Step 2: Configure Prometheus to Scrape Doris Metrics
Create a ServiceMonitor so that Prometheus Operator auto-discovers Doris Services in the default namespace that carry the label app.doris.disaggregated.cluster=test-disaggregated-cluster, and scrapes their metrics grouped by the three component types: FE, BE, and Meta Service.
2.1 Prepare the ServiceMonitor YAML
Purpose: Declare the scrape targets, endpoint paths, and scrape interval, and use relabelings to assign a unified group label to each service by role for dashboard filtering.
apiVersion: monitoring.coreos.com/v1
kind: ServiceMonitor
metadata:
  name: doris-disaggregated-monitor
  namespace: monitoring
  labels:
    release: prometheus
spec:
  namespaceSelector:
    matchNames:
    - default
  selector:
    matchLabels:
      app.doris.disaggregated.cluster: test-disaggregated-cluster
  endpoints:
  - port: http
    path: /metrics
    interval: 15s
    relabelings:
    # 1. Unify the job name
    - action: replace
      targetLabel: job
      replacement: doris-cluster
    # 2. Map Service name suffix to component group: -cg1 -> be, -fe -> fe, -ms -> meta_service
    - sourceLabels: [__meta_kubernetes_service_name]
      regex: .*-cg1
      replacement: be
      targetLabel: group
    - sourceLabels: [__meta_kubernetes_service_name]
      regex: .*-fe
      replacement: fe
      targetLabel: group
    - sourceLabels: [__meta_kubernetes_service_name]
      regex: .*-ms
      replacement: meta_service
      targetLabel: group

  - port: brpc-port
    path: /brpc_metrics
    interval: 15s
    relabelings:
    # 1. Unify the job name
    - action: replace
      targetLabel: job
      replacement: doris-cluster
    # 2. Map Service name suffix to component group: -cg1 -> be, -fe -> fe, -ms -> meta_service
    - sourceLabels: [__meta_kubernetes_service_name]
      regex: .*-cg1
      replacement: be
      targetLabel: group
    - sourceLabels: [__meta_kubernetes_service_name]
      regex: .*-fe
      replacement: fe
      targetLabel: group
    - sourceLabels: [__meta_kubernetes_service_name]
      regex: .*-ms
      replacement: meta_service
      targetLabel: group
2.2 Key Fields of the ServiceMonitor
| Field | Value | Description |
|---|---|---|
metadata.namespace | monitoring | The ServiceMonitor must reside in the same namespace as the Prometheus instance. |
metadata.labels.release | prometheus | Must match the Helm Release name. Prometheus Operator uses this label to discover ServiceMonitors. |
spec.namespaceSelector.matchNames | default | The namespace where the Doris cluster runs. Adjust to match your environment. |
spec.selector.matchLabels | app.doris.disaggregated.cluster: test-disaggregated-cluster | Selects the Service of the Doris compute-storage decoupled cluster. Update the cluster name as needed. |
endpoints[0].port | http | The HTTP port name on which FE, BE, and Meta Service expose /metrics. |
endpoints[1].port | brpc-port | The bRPC port name on which BE exposes /brpc_metrics. |
endpoints[*].interval | 15s | Scrape interval. Adjust based on data volume and precision requirements. |
The group label in relabelings | be / fe / meta_service | Divides metrics into three component categories by Service name suffix, for dashboard variable filtering. |
2.3 Apply the YAML and Verify
Purpose: Let Prometheus Operator detect the new ServiceMonitor and refresh its scrape targets.
kubectl apply -f doris-monitor.yaml
In a browser, open Prometheus (default port 9090, for example http://your_ip:9090), navigate to Status → Targets, and confirm that the FE, BE, and Meta Service targets under doris-cluster are all in the UP state.
Step 3: Configure Grafana and the Dashboard
3.1 Log In to Grafana
Purpose: Access the Grafana bundled with kube-prometheus-stack and complete the first login.
-
In a browser, open Grafana (default port
3000, for examplehttp://your_ip:3000). -
The username is
admin. Retrieve the initial password with the following command:kubectl get secret --namespace monitoring prometheus-grafana -o jsonpath="{.data.admin-password}" | base64 --decode ; echo
3.2 Import the Doris Dashboard
Purpose: Use the official Dashboard JSON file to visualize Doris cluster metrics.
-
Download the official Dashboard file: Doris-Dashboard-Cloud.json
-
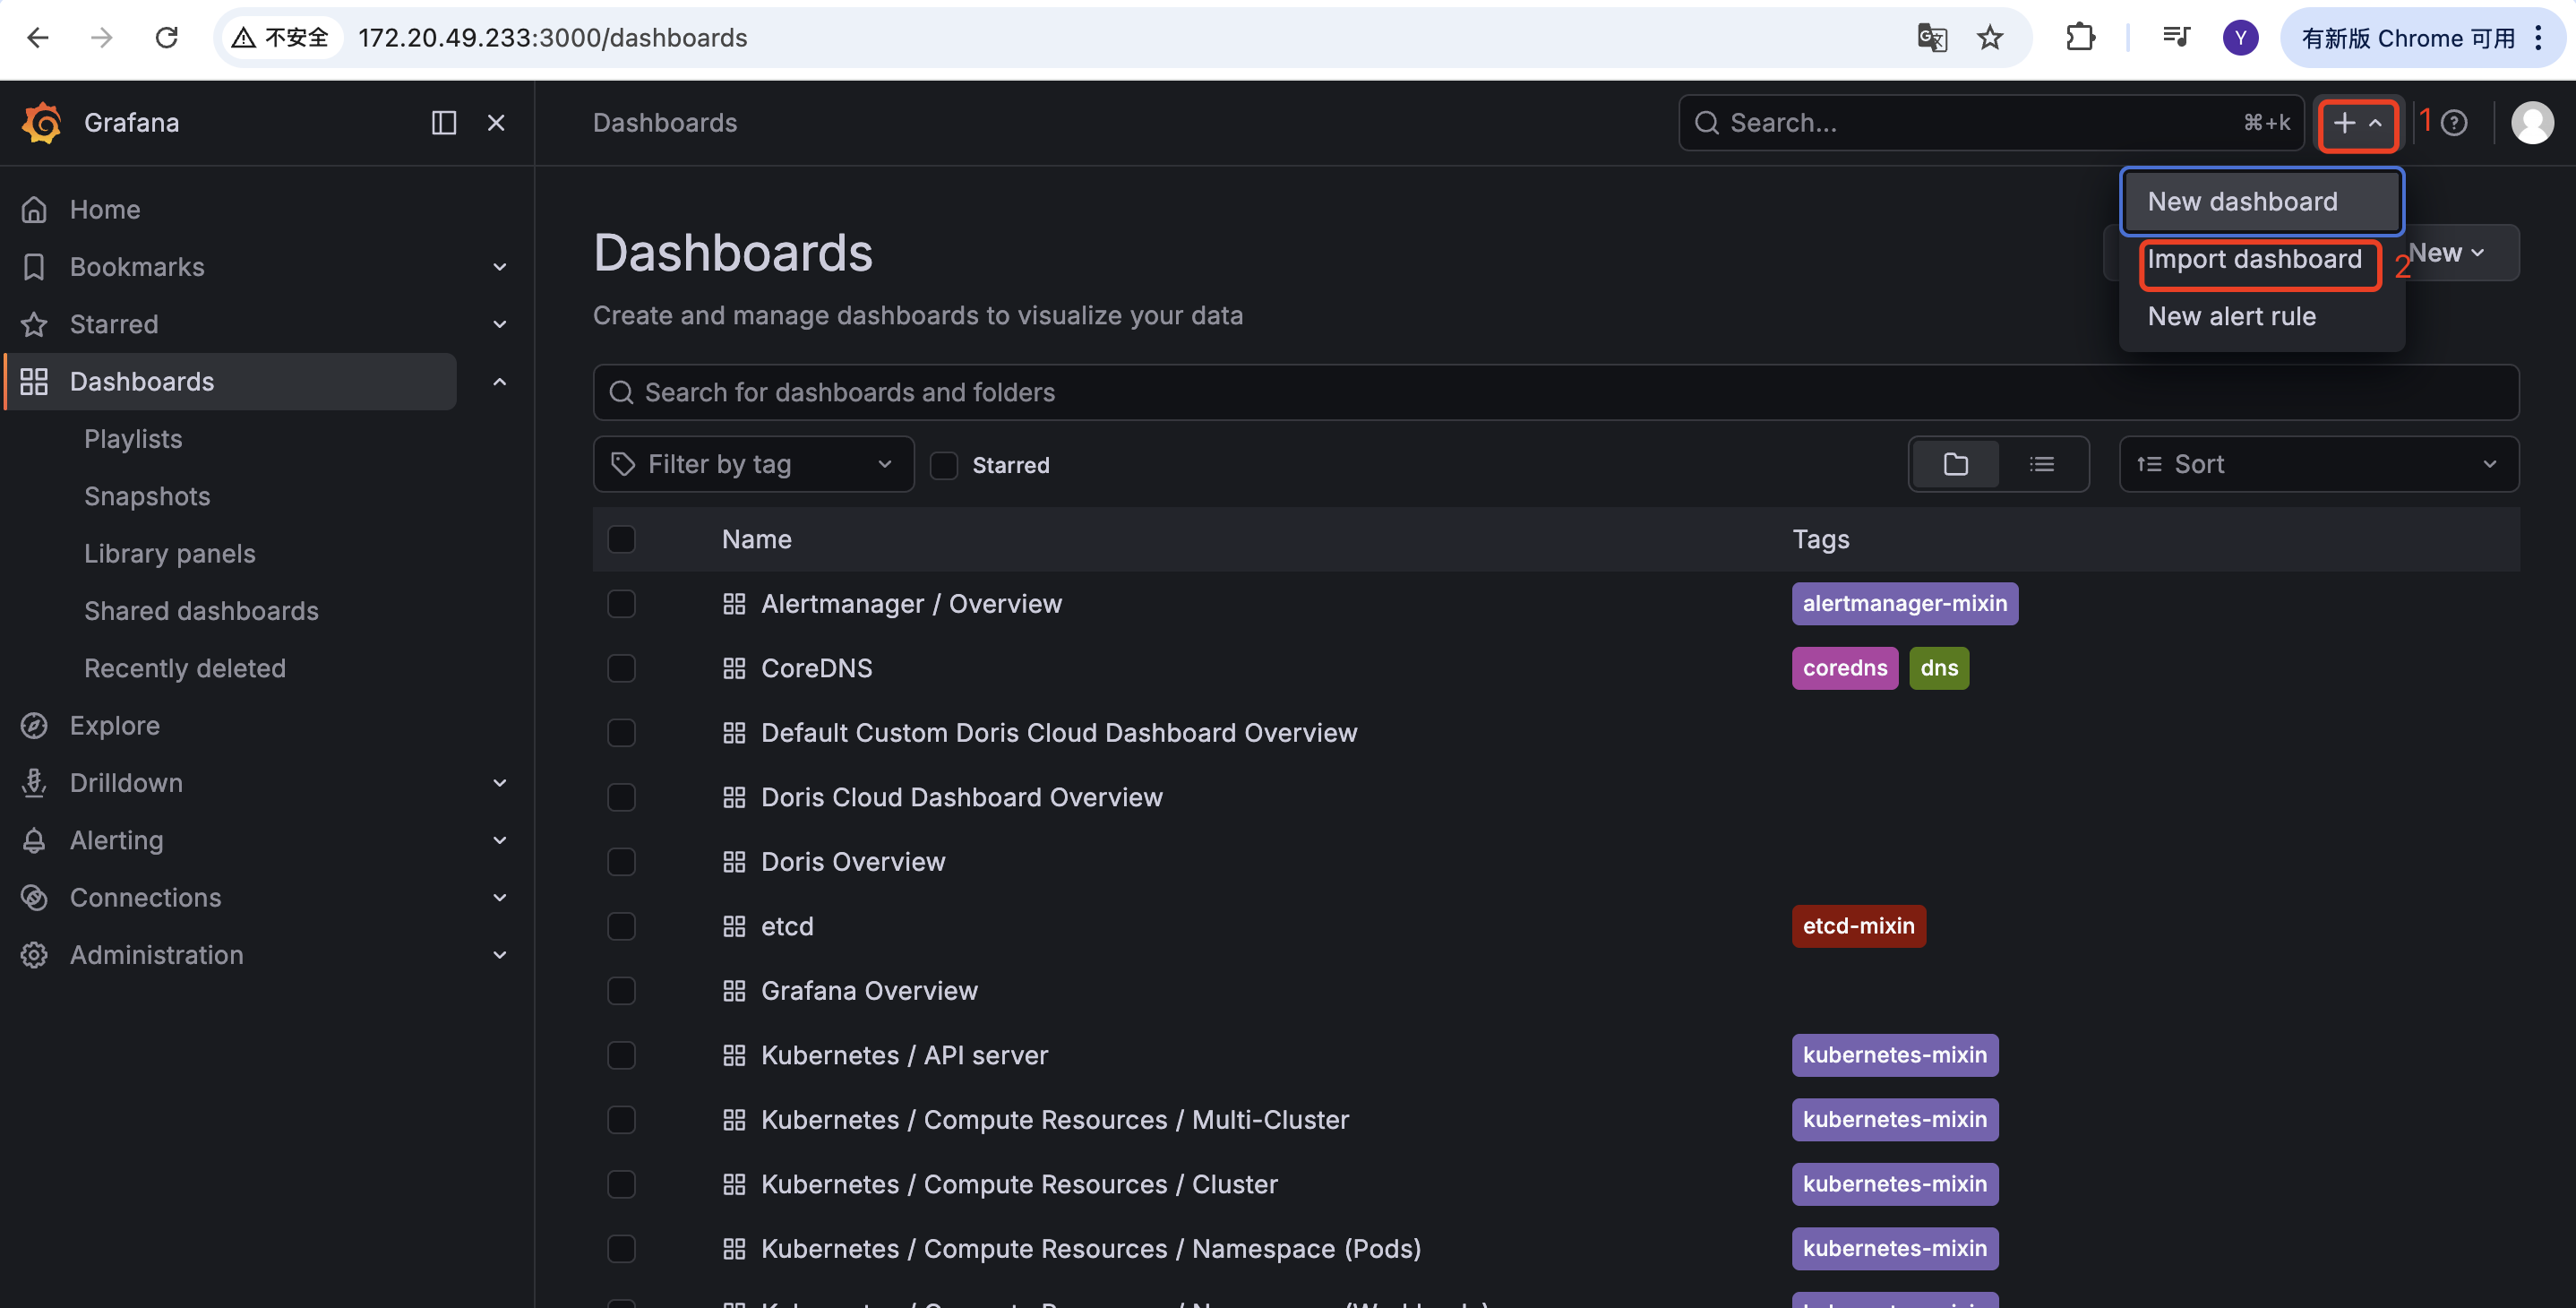
In Grafana, go to Dashboards → New → Import, import the JSON file, and select the bundled Prometheus as the data source.
-
Append
&var-cluster_id=doris-clusterto the dashboard URL to match thejobname set in the ServiceMonitor. For example:http://your_ip:3000/d/3fFiWJ4mz456/doris-cloud-dashboard-overview?orgId=1&var-cluster_id=doris-cluster&refresh=5s
3.3 Add Node Monitoring (Optional)
Purpose: The example JSON file does not include a host node monitoring panel. Use the official Grafana template 1860 to display node-exporter metrics directly.
-
In Grafana, import a dashboard:
-
Select the official template number
1860: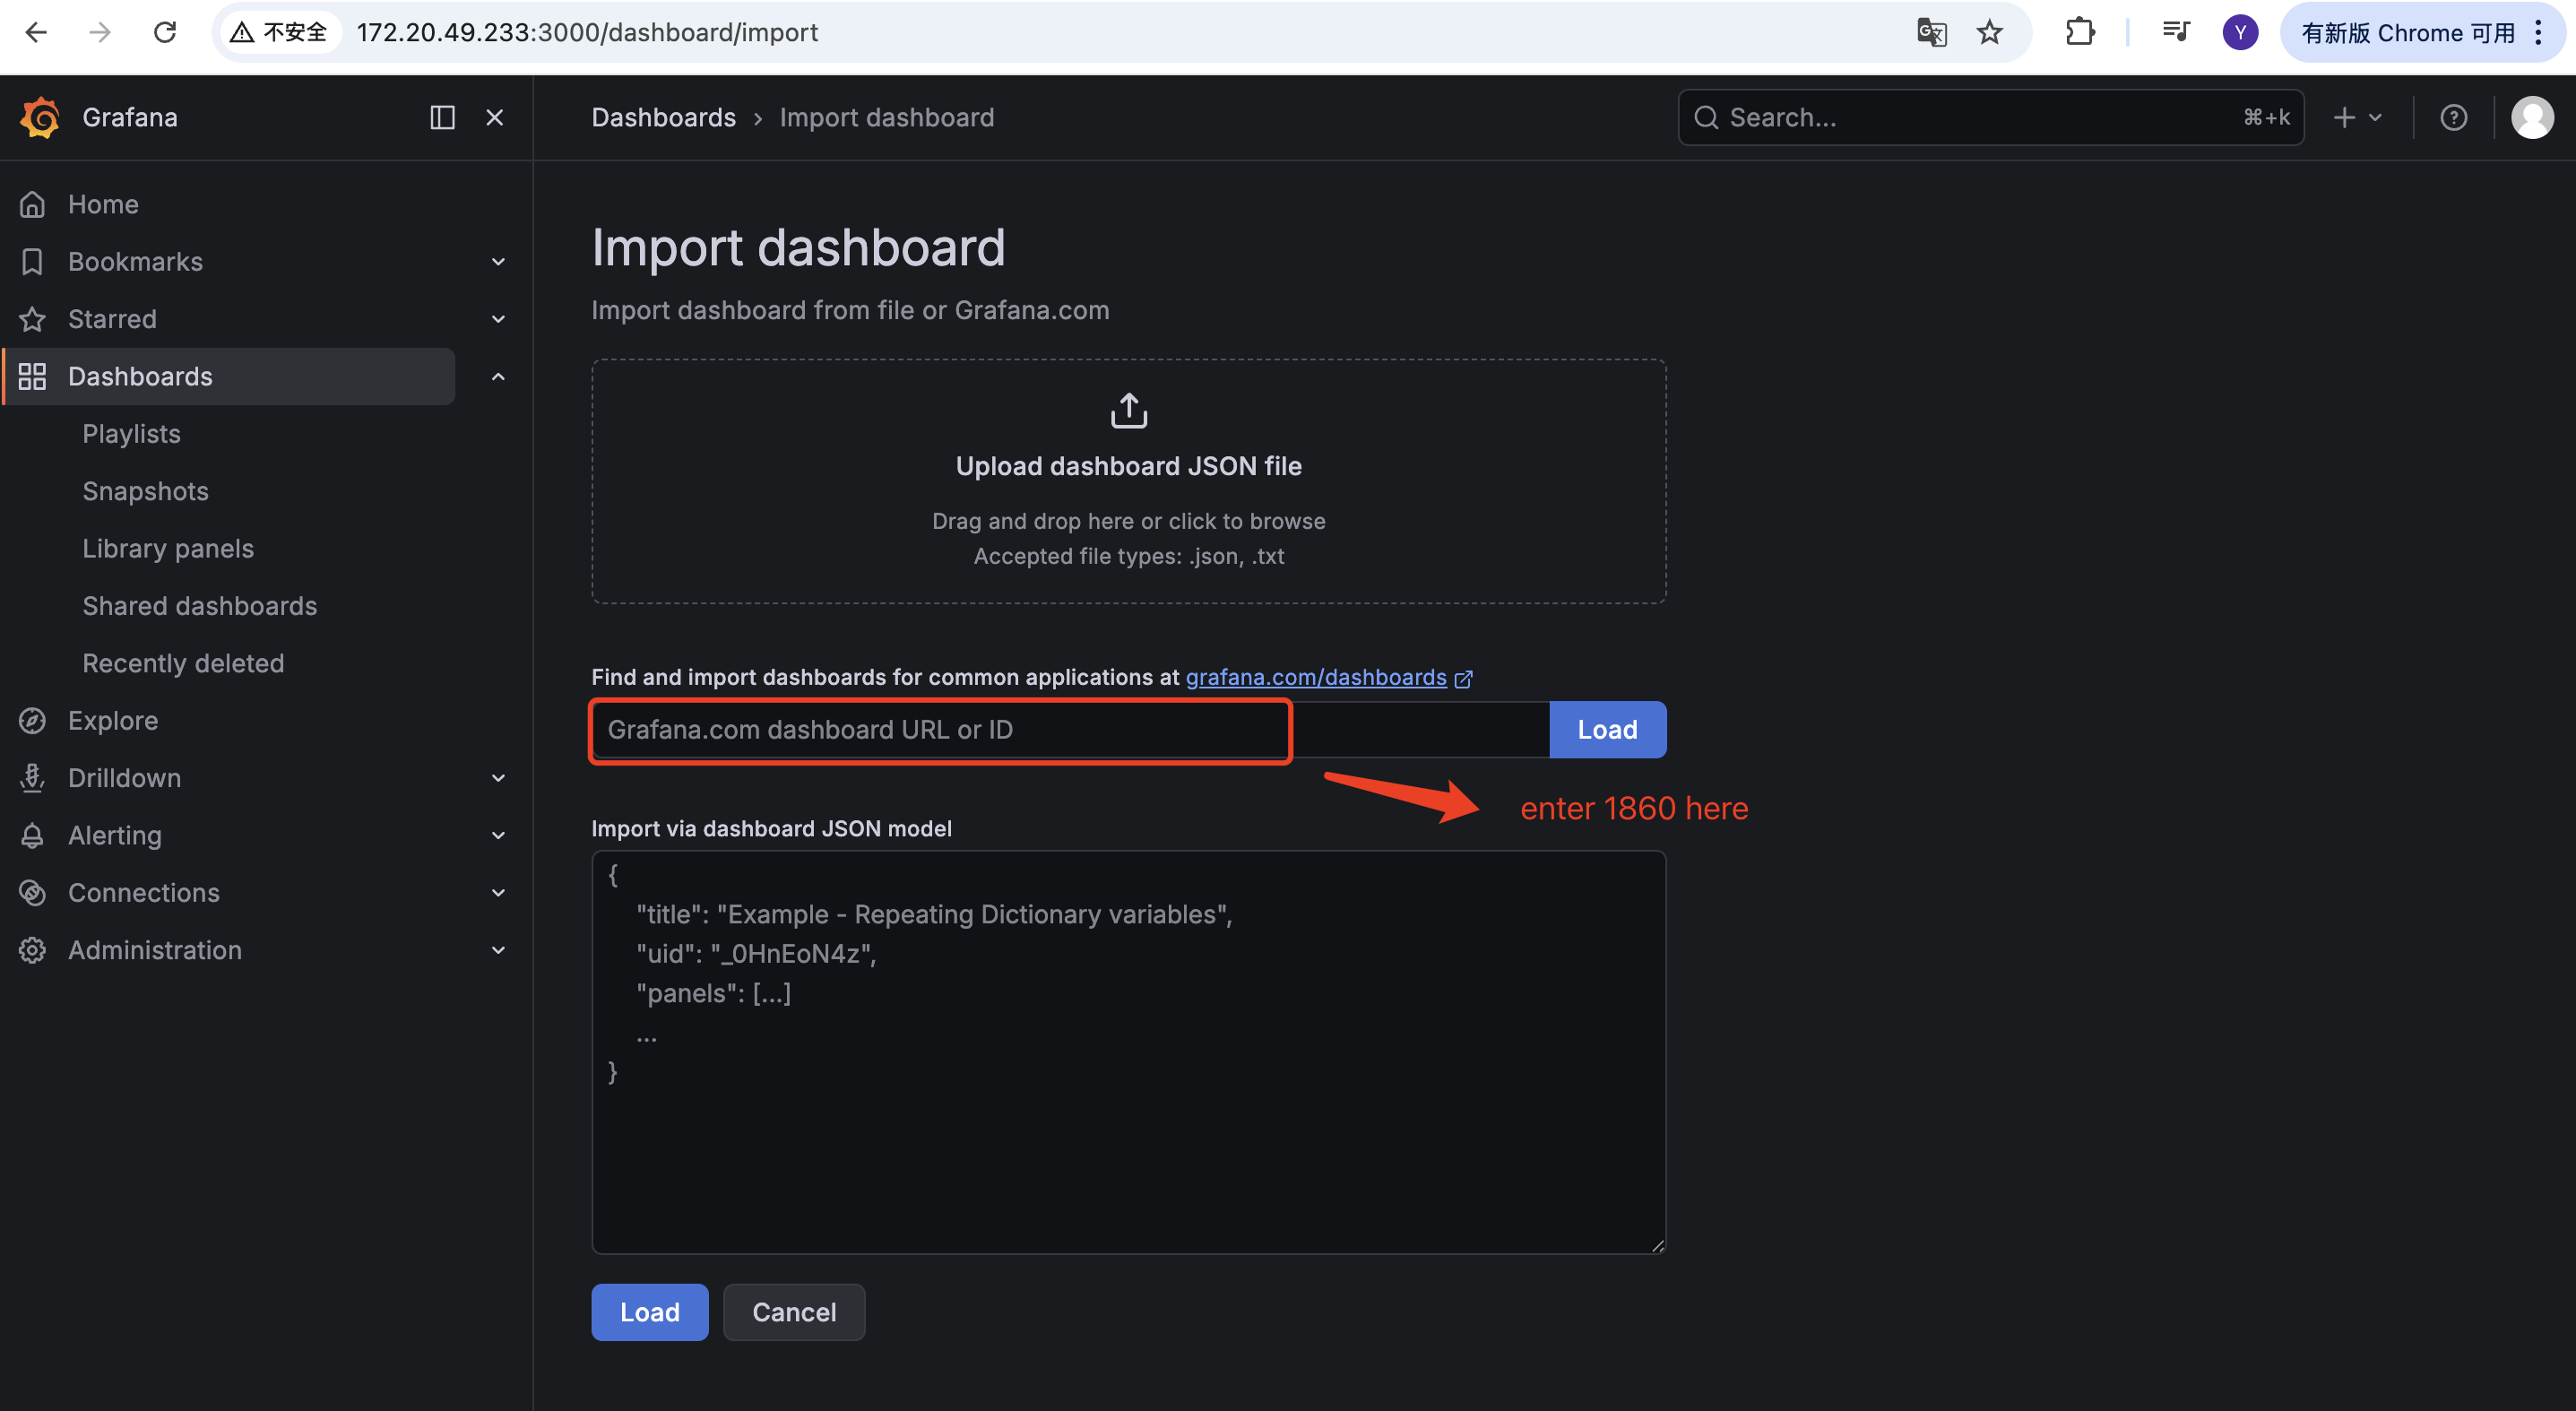
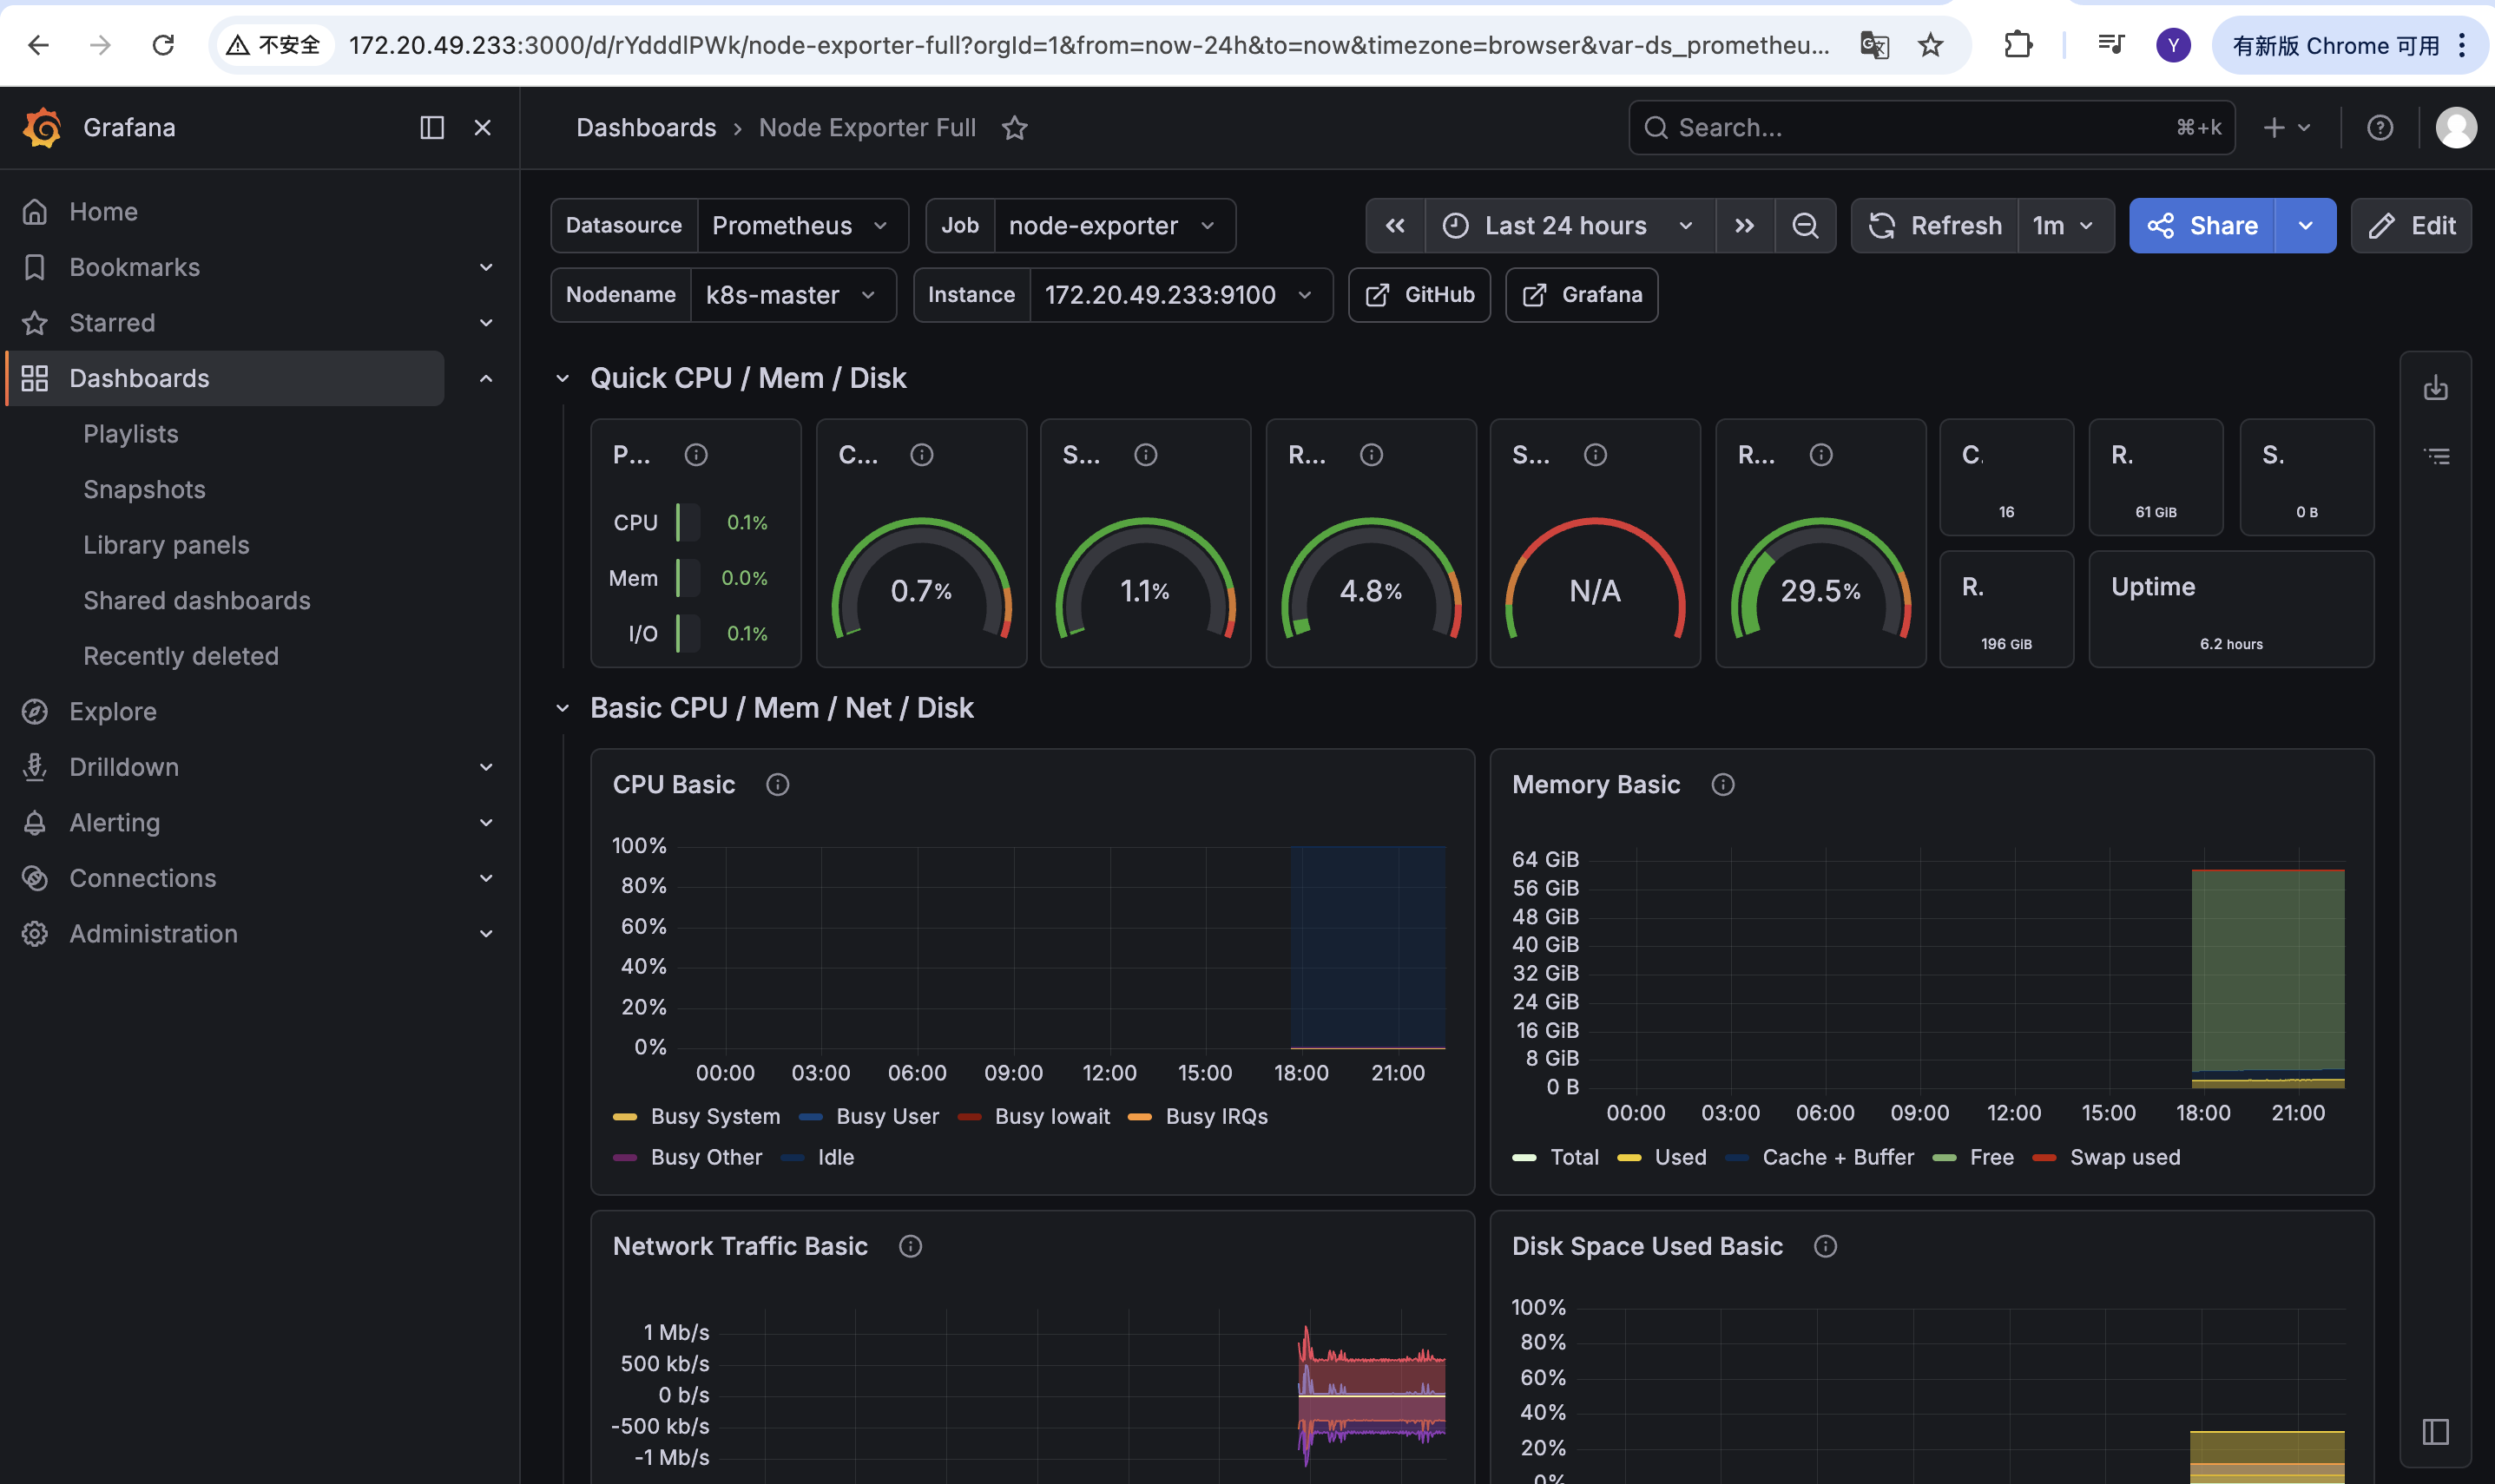
-
After the import completes, you can view the node metrics:
Common Issues
| Issue | Possible cause | Resolution |
|---|---|---|
| Doris targets do not appear under Prometheus Targets | The namespaceSelector or matchLabels of the ServiceMonitor does not match the actual Doris cluster; the release label does not match the Helm Release name. | Verify the cluster namespace, the Service label app.doris.disaggregated.cluster, and confirm that the release label on the ServiceMonitor is set to prometheus. |
Targets are listed but show DOWN | The Pod is not ready, or the http / brpc-port port name does not match the port name that is actually exposed. | Use kubectl get svc -n default and kubectl describe pod to confirm the port names, the readiness state, and that /metrics and /brpc_metrics are accessible inside the container. |
| Grafana dashboard panels are empty | The URL is missing var-cluster_id=doris-cluster, or the job name in the ServiceMonitor has been changed. | Check that the var-cluster_id in the dashboard URL and the job label in the ServiceMonitor are both set to doris-cluster. |
| Cannot access Prometheus on port 9090 or Grafana on port 3000 | The Service type defaults to ClusterIP, which is not reachable from outside the cluster. | Forward the port with kubectl port-forward, or change the corresponding Service type to NodePort or LoadBalancer. |
The command to retrieve the Grafana password returns NotFound | The Helm Release is not named prometheus, so the Secret name differs. | Use kubectl get secret -n monitoring to find the actual Grafana Secret name, then substitute it for prometheus-grafana in the command. |