Last updated on
DOG Stack Open Observability Overview
DOG Stack is an open observability solution built on Doris, OpenTelemetry (including the Doris Exporter), and Grafana (including the Doris App plugin). It is designed to be:
- Open: All components are open source, avoiding vendor lock-in.
- High-performance: Write throughput up to hundreds of GB/s. Sub-second search and query response time over billions of records.
- Cost-efficient: Reduces observability cost by more than 50%, or even 80%, compared with ELK or Datadog.
- Scalable: Easily handles PB- or even EB-scale data volumes.
OpenTelemetry is the de-facto standard for observability data collection. Grafana is the de-facto standard for observability data visualization. That is why Doris chose to build an observability solution on top of them, rather than reinventing new collection and visualization tools. Doris focuses on efficient storage and fast querying of observability data.
Features
DOG Stack offers rich functionality based on OpenTelemetry and Grafana.
- Collection of various observability data
- OpenTelemetry SDKs provide out-of-the-box, even code-free instrumentation for applications in over 10 programming languages.
- The OpenTelemetry Collector ingests local files, host metrics, and container metrics.
- Integration with your existing collection tools such as Vector, Fluentbit, Node Exporter, Telegraf, Logstash, Filebeat, and more.
- Search experience beyond Kibana
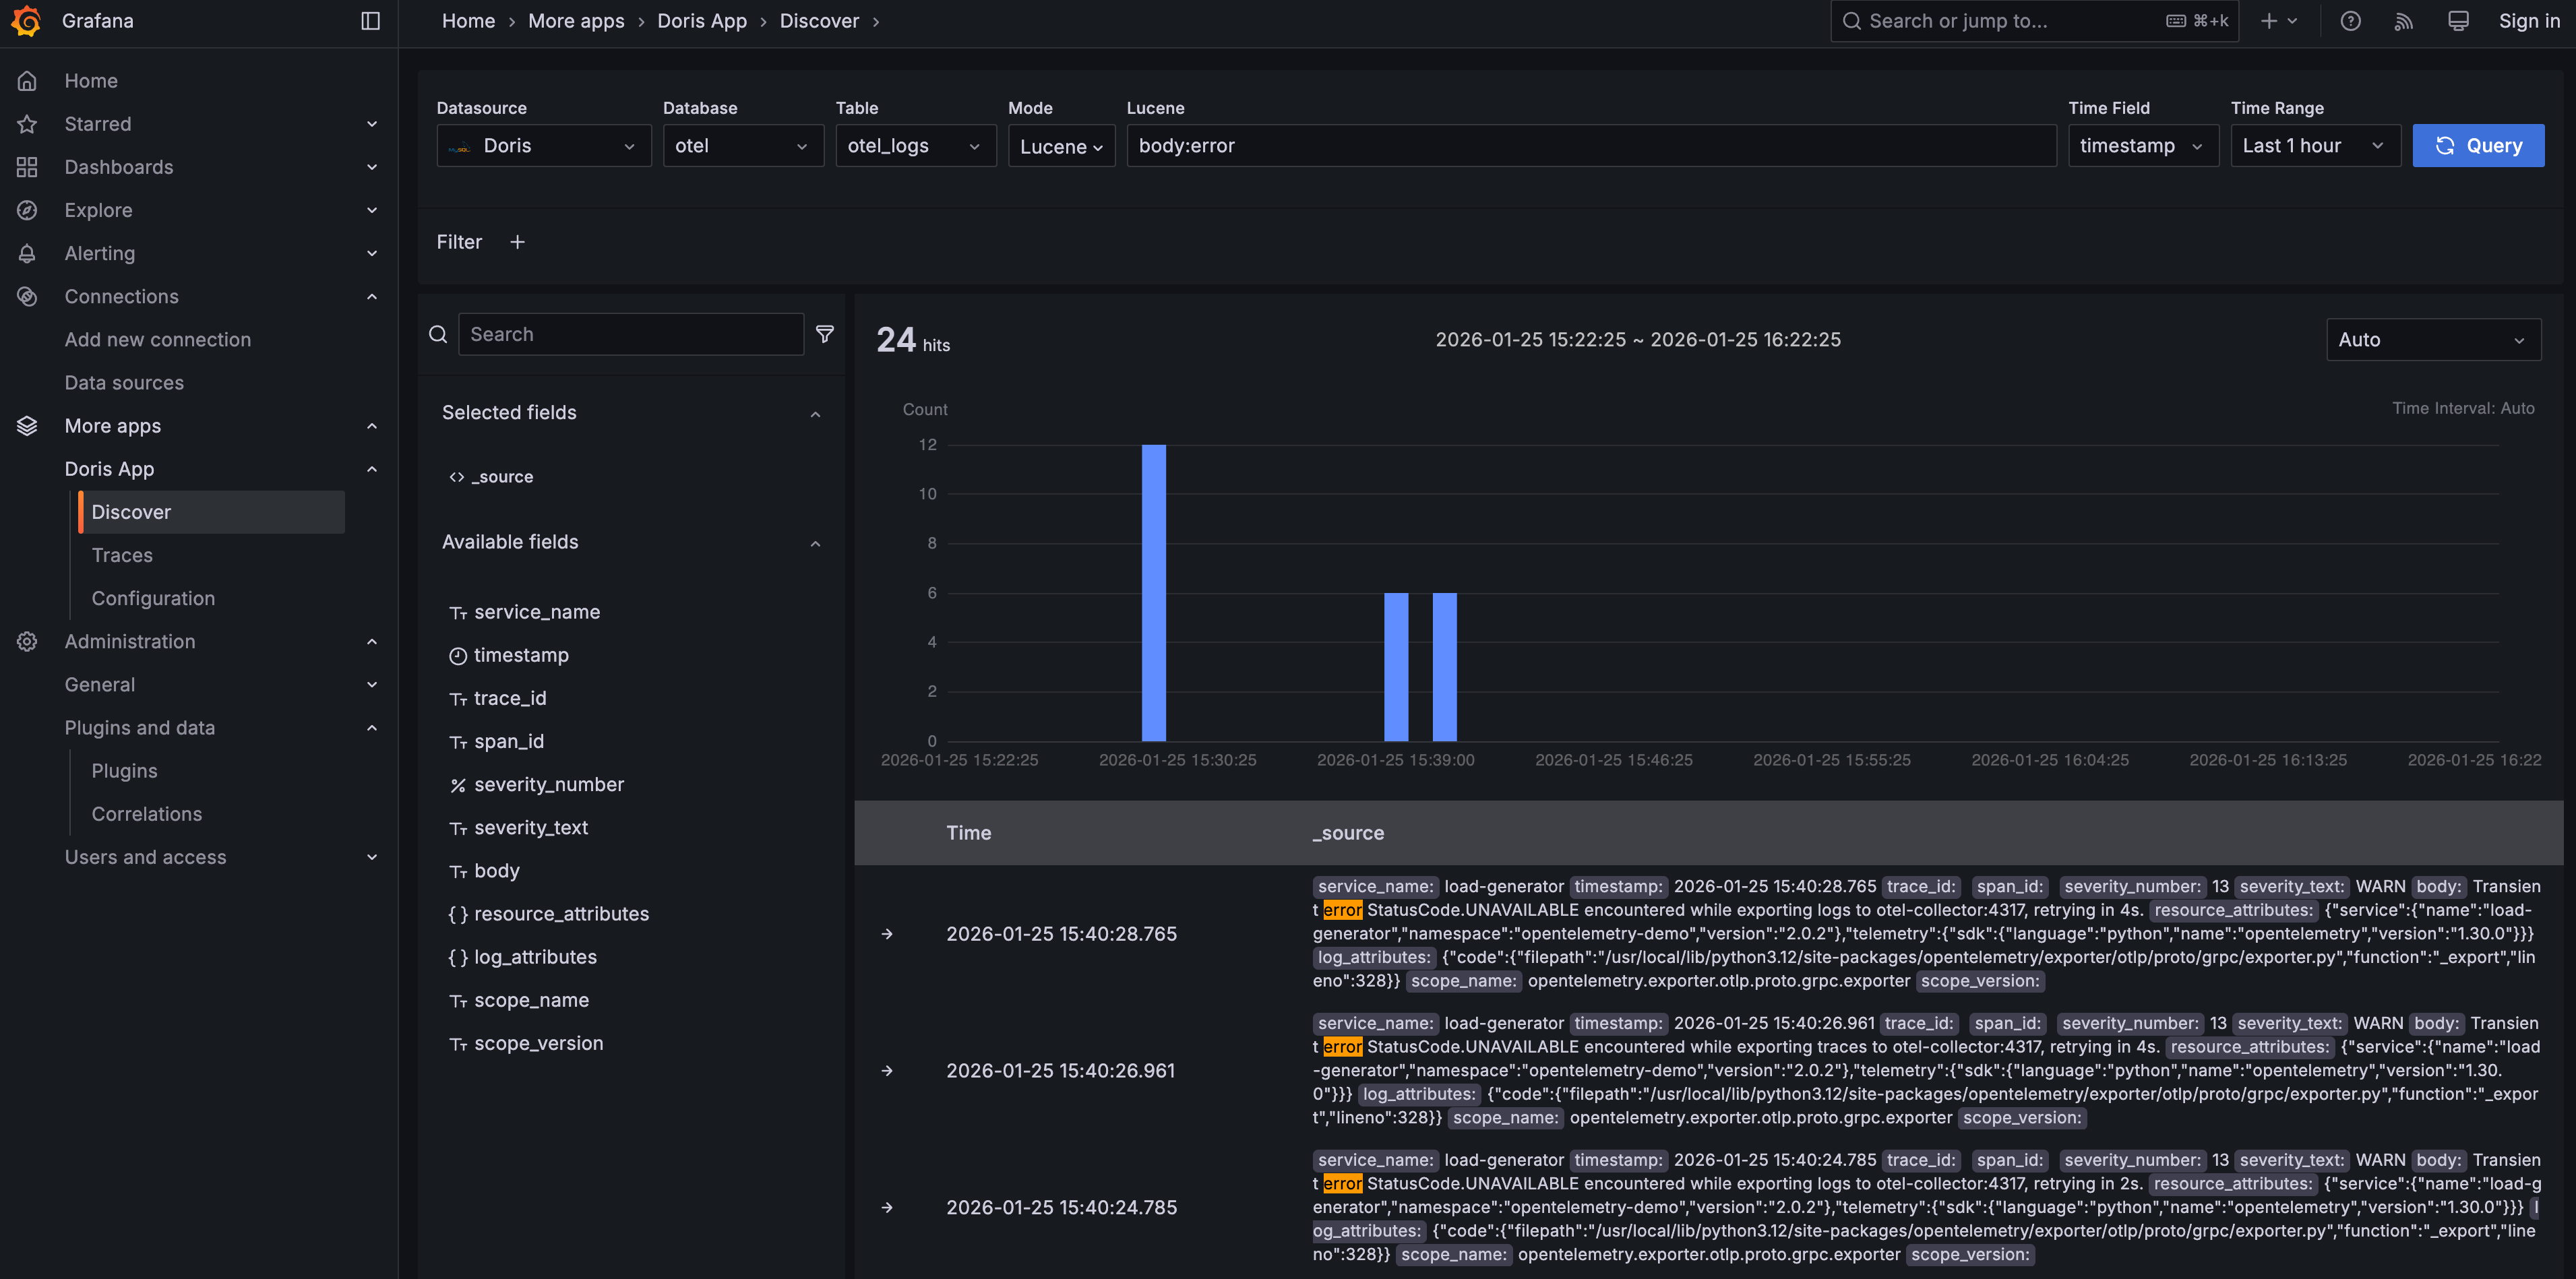
- Supports both Lucene-style search syntax and native SQL syntax.
- One-click correlation between logs and traces.
- View detailed records in table or JSON format.
- View data before and after a specific log or trace in time.
- Interactive time-range selection, field selection, and field filtering.
- Field value distribution statistics.
- Jaeger-like trace experience
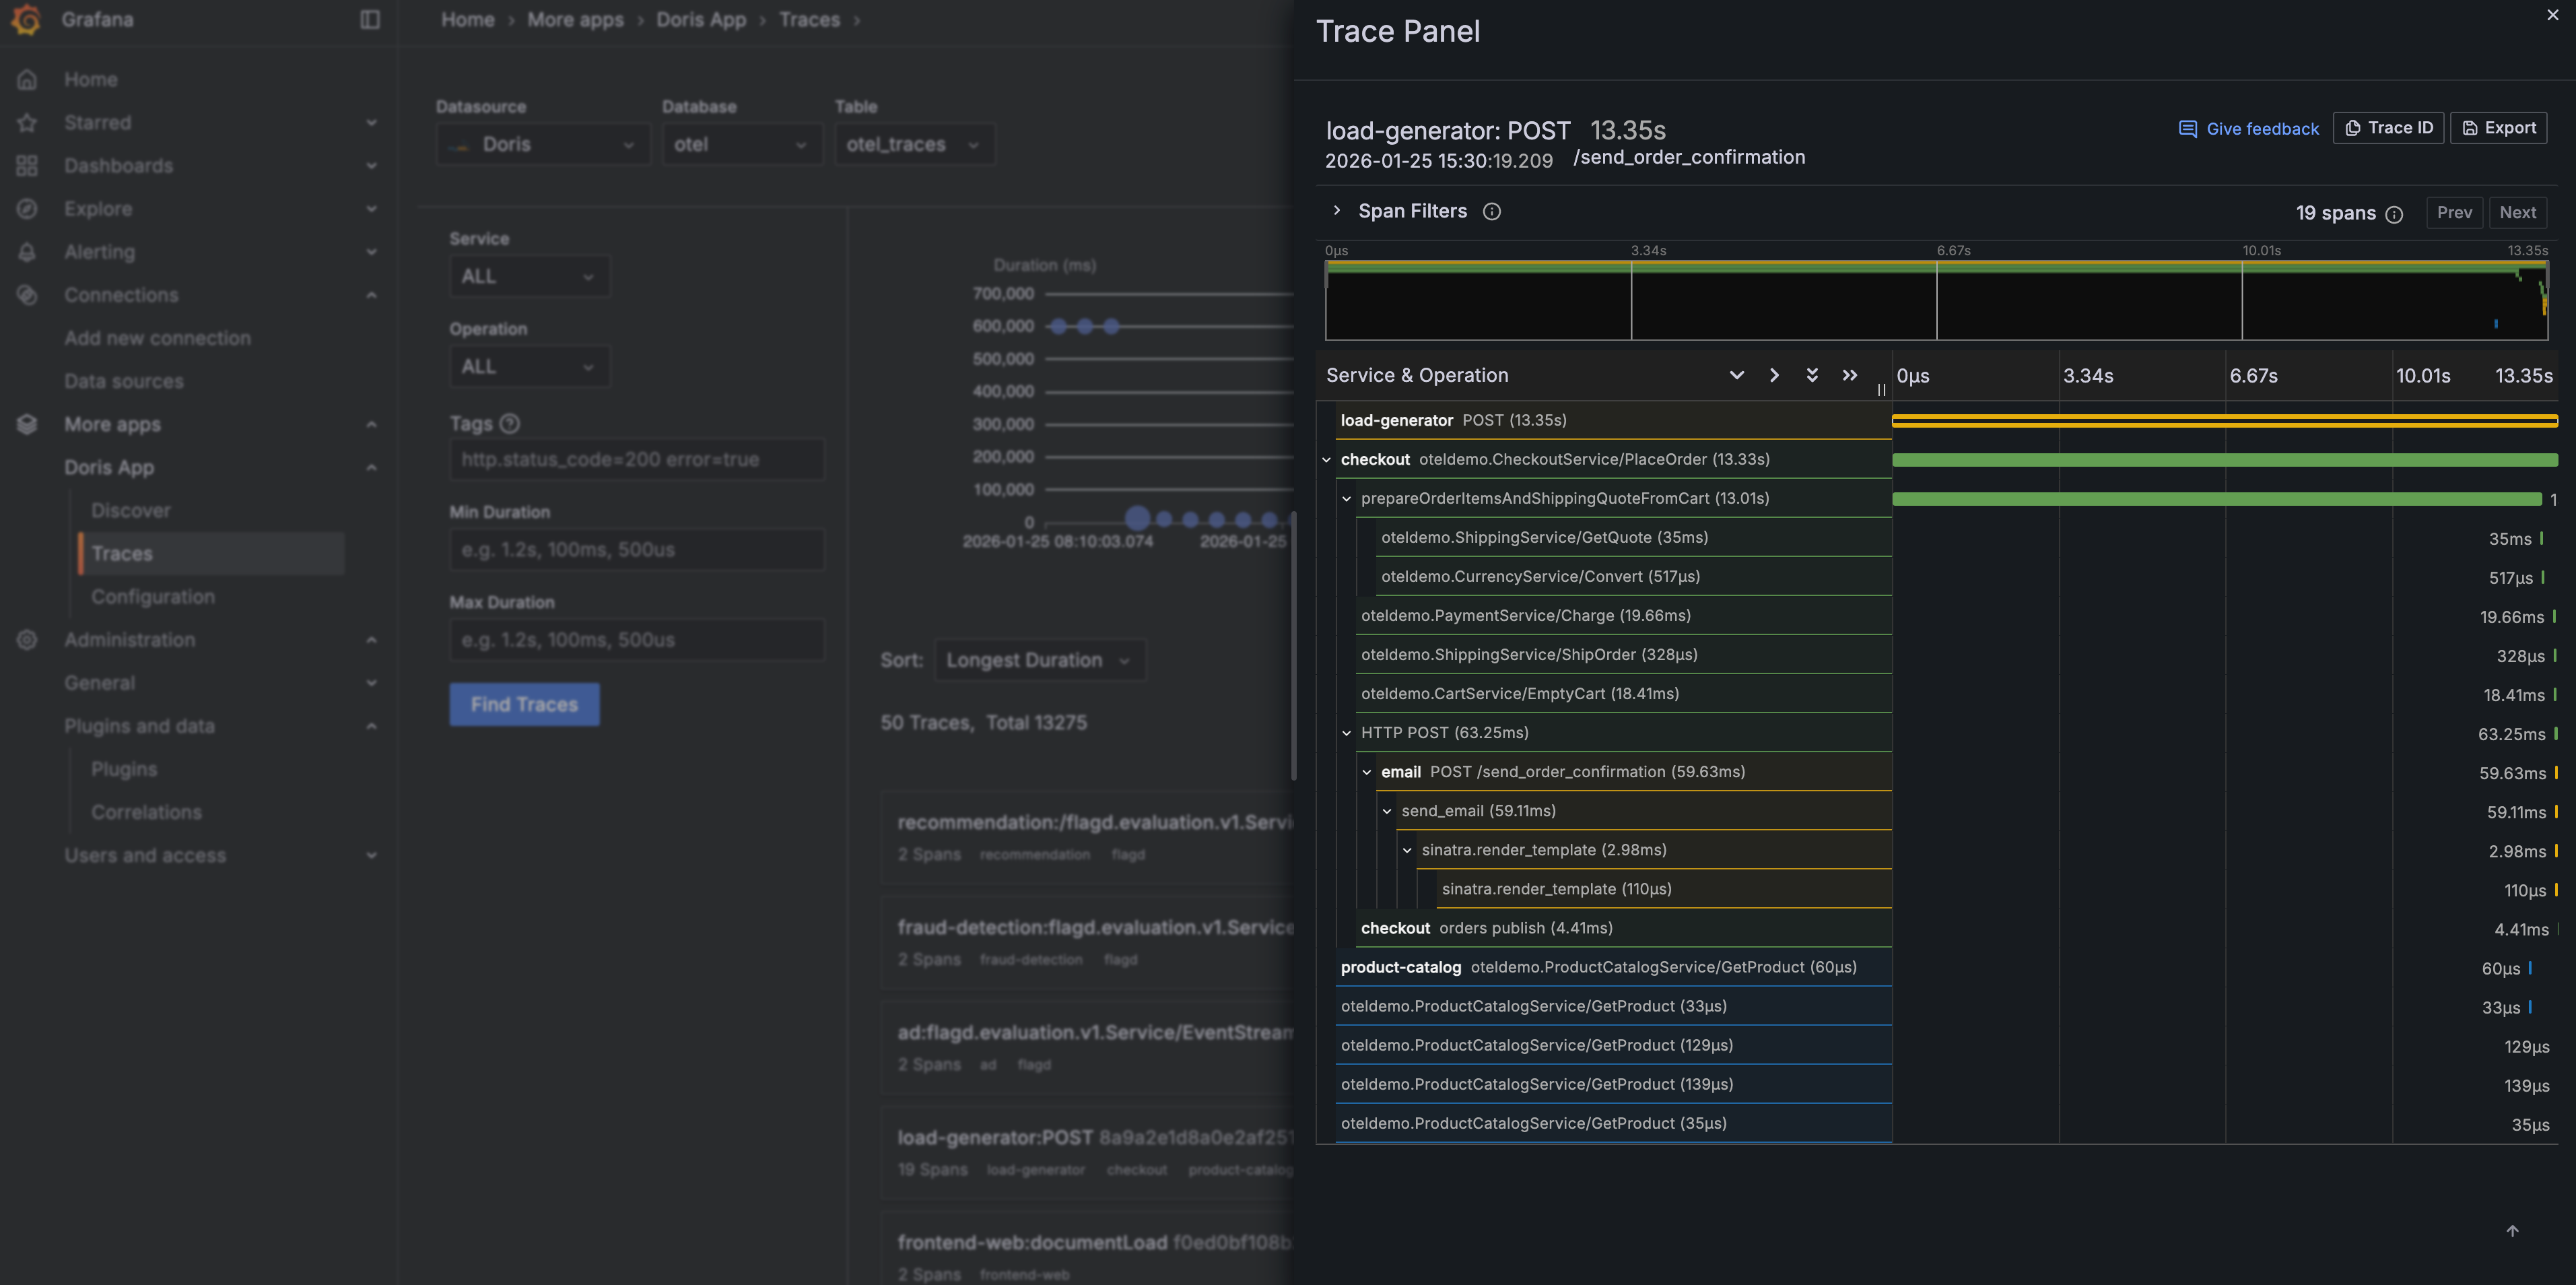
- Filter traces by service name, operation, tags, and duration range.
- Visualize traces by timeline, duration, and span count.
- Sort traces by timestamp, duration, or span count.
- Waterfall visualization for a specific trace.
- Filter spans within a trace by service name, span name, tags, and duration range.
- Dashboards
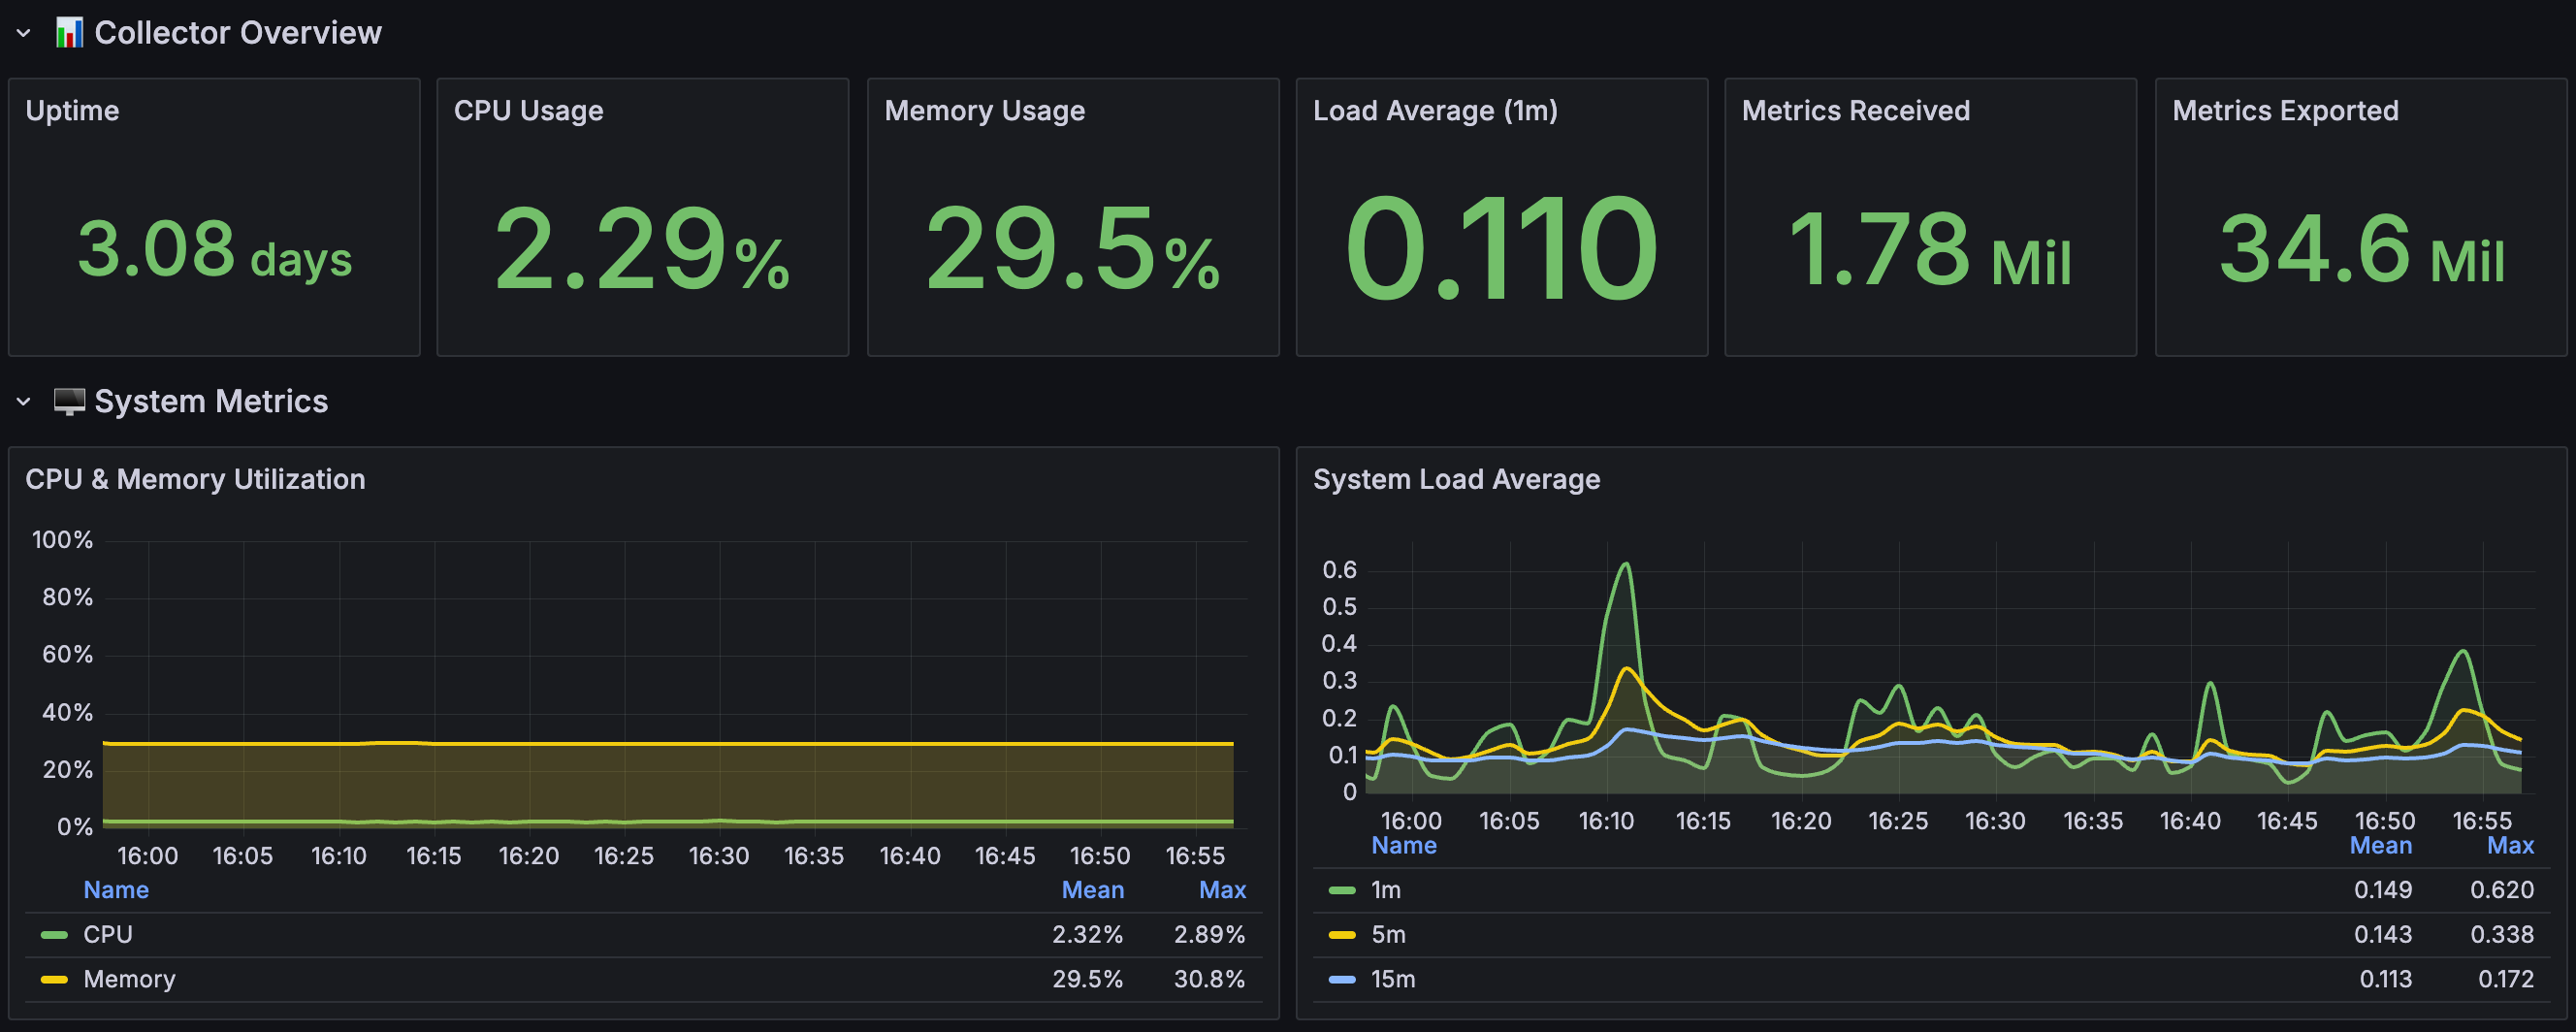
- Over 20 visualization types, including line, bar, pie, gauge, heatmap, histogram, geomap, and more.
- Build dashboards via the visual builder or with raw SQL.
- Use Doris multi-table joins to build dashboards across logs, traces, and metrics.
- Alerting
- Alert rules covering multiple conditions such as no-data / error, threshold, and composite threshold, across metrics such as count, sum, and ratio.
- Over 20 notification channels including email, PagerDuty, Slack, Discord, and Webhook.
- Alert templates for customizing, formatting, and reusing notification messages.
- More features supported by OpenTelemetry and Grafana.
Below are a few quick-look screenshots from Grafana with the Doris App plugin installed.
- Log search
- Trace analysis
- Metrics dashboard
Architecture
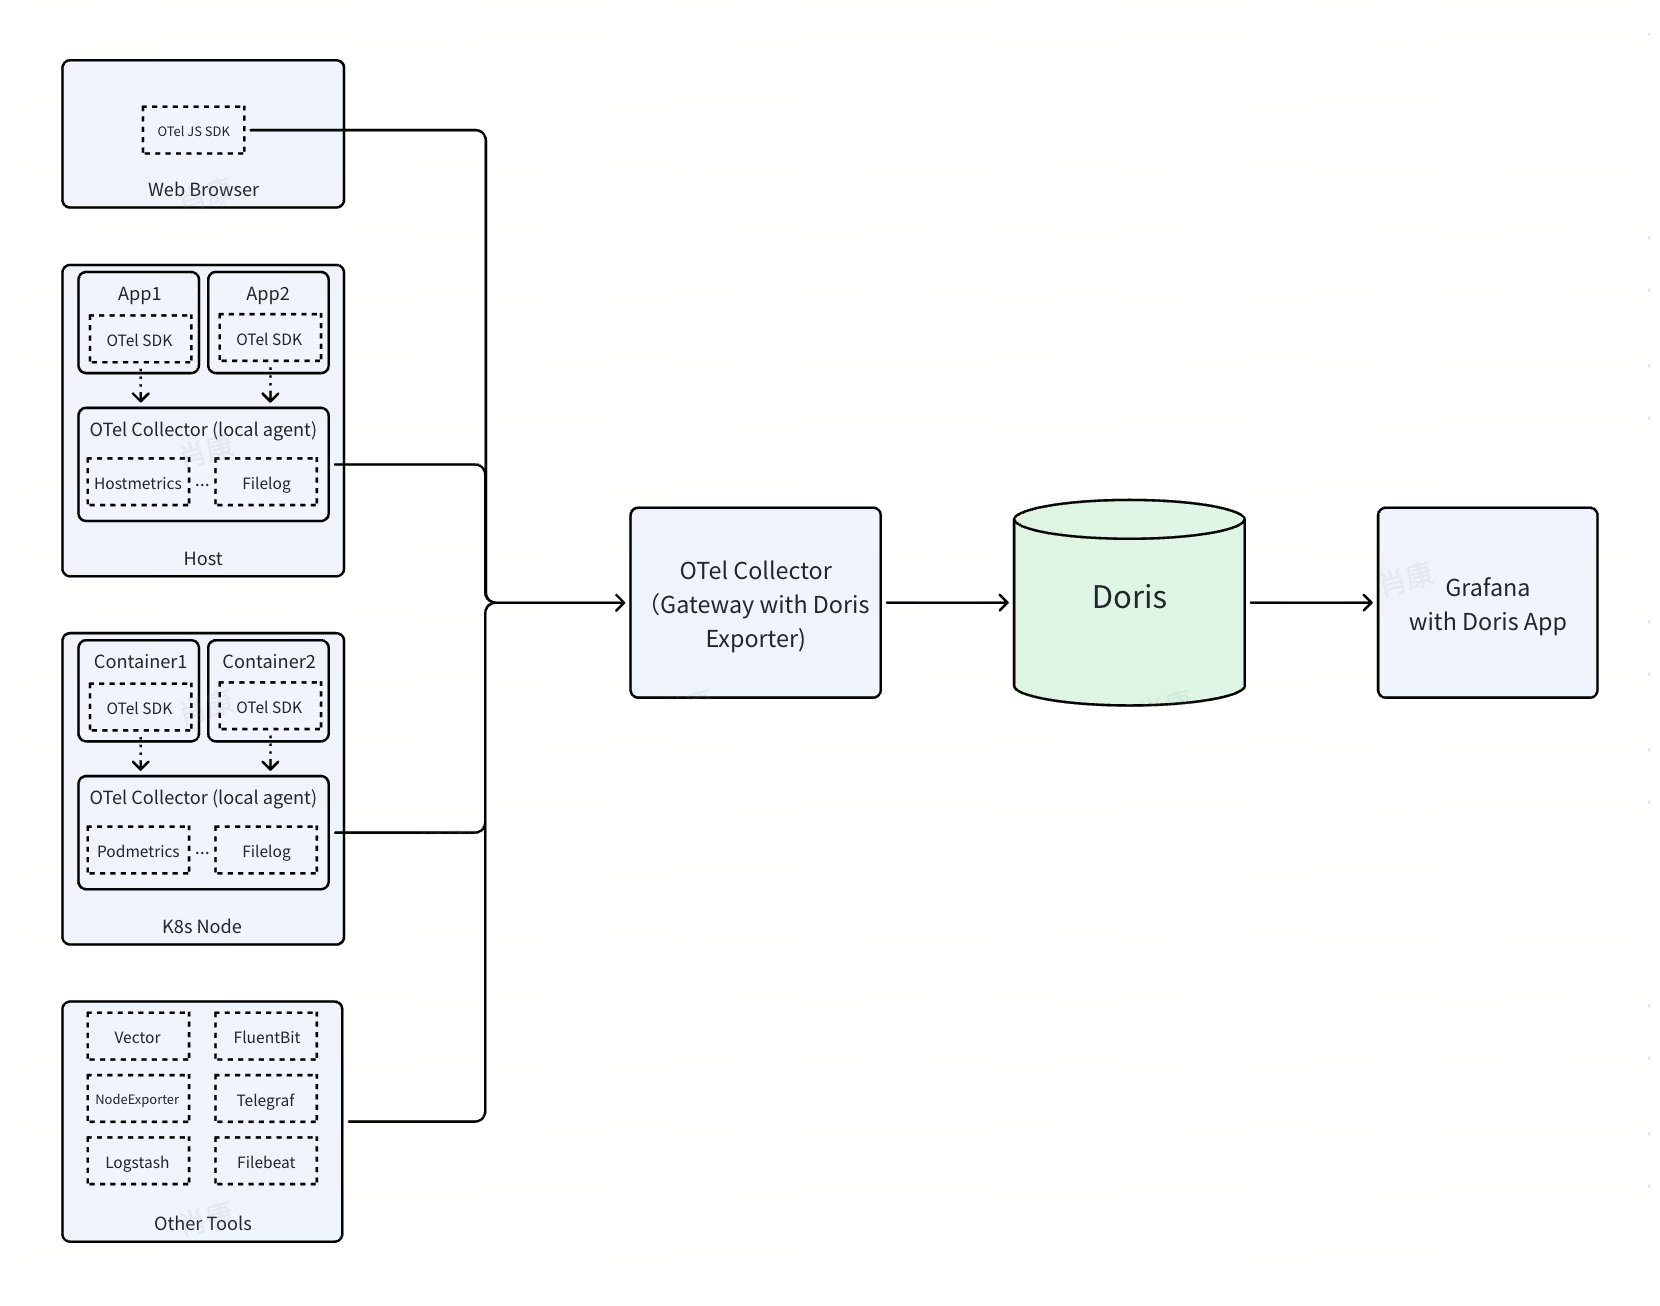
DOG Stack consists of the following components.
- Data collection tools: They collect telemetry such as logs, traces, and metrics. OpenTelemetry provides two kinds of collection tools. One is the OpenTelemetry SDK supporting 10+ languages, used to instrument applications and AI agents — typically collecting trace data. The other is the OpenTelemetry Collector receivers, including the filelog receiver for local files, the hostmetrics receiver for host metrics (CPU, memory, etc.), and the podmetrics receiver for pod metrics in Kubernetes. Many third-party collectors such as Vector, Fluentbit, Node Exporter, and Telegraf can send data to the OpenTelemetry Collector over OTLP and other protocols.
- OpenTelemetry Collector (with Doris Exporter): It receives telemetry data from collection tools, processes it, and persists it into Doris via the Doris Exporter. Typical processing steps include filtering, transforming, enriching, queuing, and batching.
- Doris: It receives telemetry data from the OpenTelemetry Collector and stores it efficiently in indexed columnar storage. Doris provides lightning-fast search through various indexes such as inverted index, bloom filter index, and zone map index. It also offers excellent native performance for analytical queries such as aggregation, sorting, and joins.
- Grafana (with Doris App plugin): It provides rich, easy-to-use visualizations for logs, traces, and metrics. On top of Grafana's strong base capabilities, the Doris App plugin adds practical features. The "Discover" feature delivers a first-class search experience appreciated by Kibana users. The "Traces" feature offers native trace exploration to surface traces worth investigating (such as slow ones), which will feel familiar to Jaeger users.