Slow SQL Diagnostic Tools: Audit Log and Audit Table
Performance diagnostic tools are used to quickly locate problematic business SQL, and they are critical to maintaining database SLAs. By default, Doris treats SQL whose execution time exceeds 5 seconds as slow SQL. The threshold can be configured through config.qe_slow_log_ms.
Pre-start checklist:
- Whether the slow SQL threshold is known (default 5000 ms).
- Whether the
fe/log/fe.audit.logfile on FE nodes is accessible. - Whether you are using Doris 2.1 or later (required for the system table approach).
- Whether Doris Manager is deployed (optional, used for UI-based filtering).
Comparison of the three diagnostic channels:
| Tool | Applicable Scenario | Access Method | Doris Manager Required | Version Requirement |
|---|---|---|---|---|
| Doris Manager logs | UI-based slow SQL filtering | Doris Manager console | Yes | All versions |
Audit Log (fe.audit.log) | Direct inspection of raw logs, text-based filtering | File on FE node | No | All versions |
audit_log system table | SQL-based statistics and aggregation analysis | MySQL client query | No | 2.1+ |
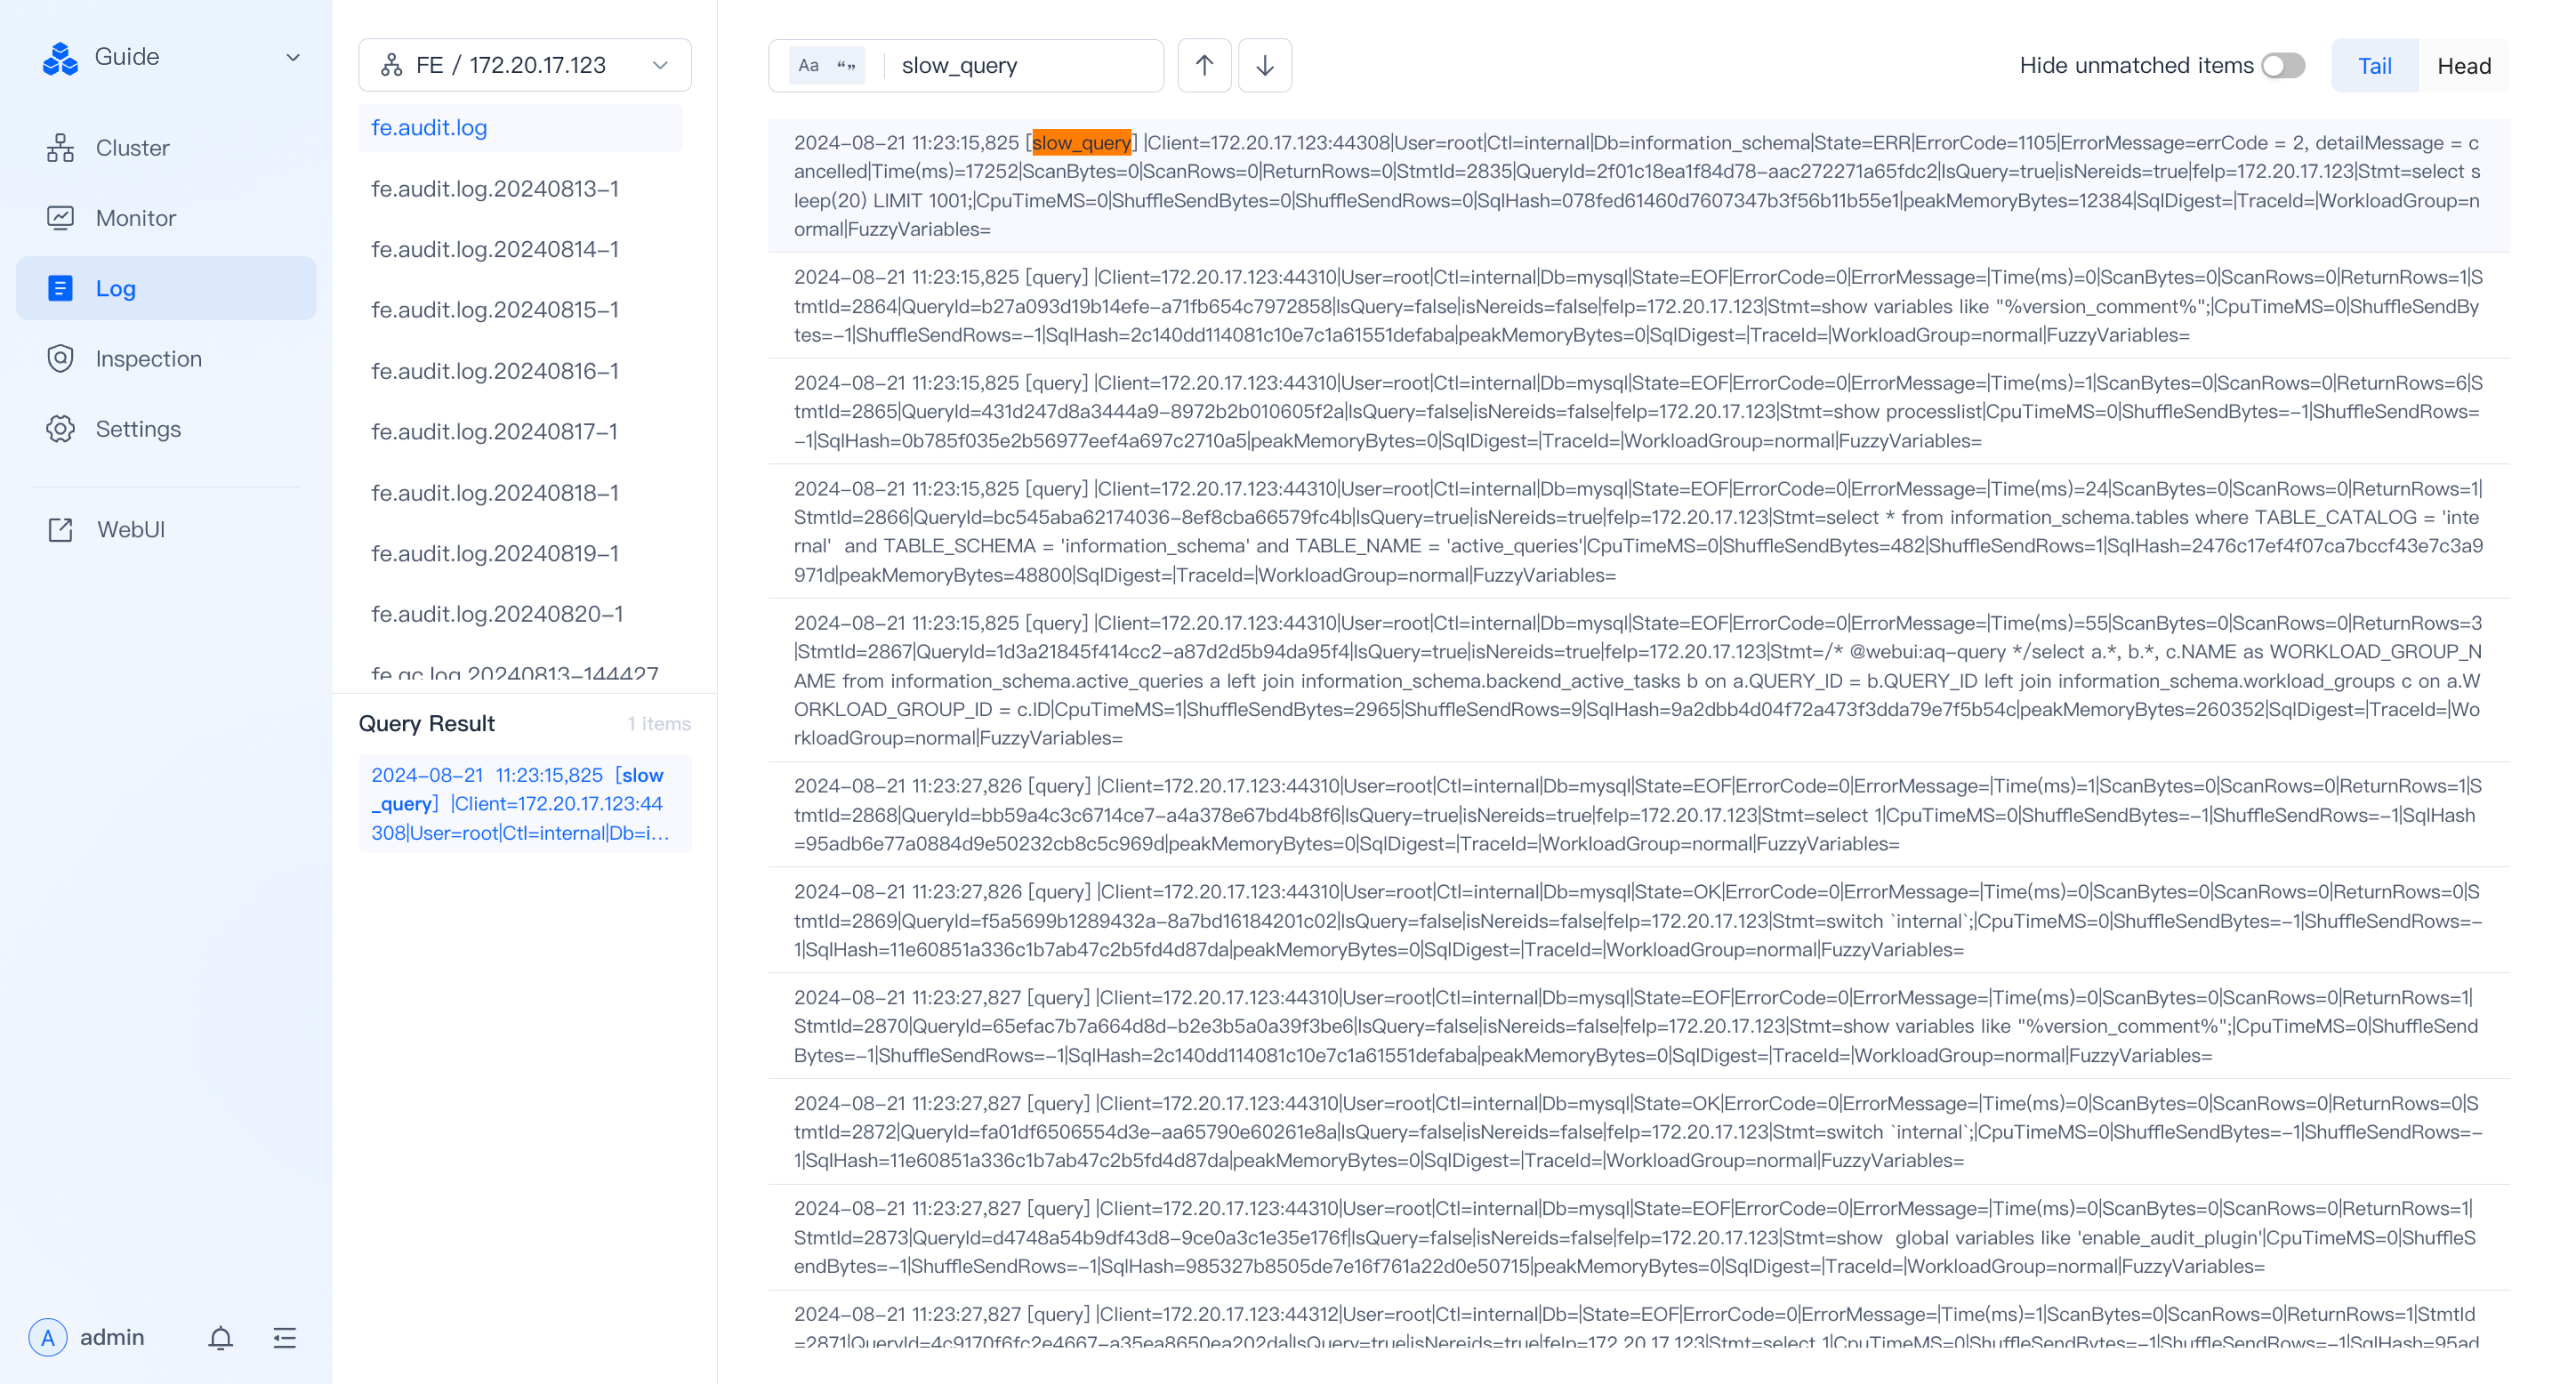
Doris Manager logs
The log module of Doris Manager provides slow SQL filtering capabilities.
Procedure:
- Goal: view historical slow SQL.
- Command: on the log page, select the
fe.audit.logof a specific FE node. - Description: enter
slow_queryin the search box to view the slow SQL list on the page.
Audit Log
Audit Log is the audit log emitted by Doris FE. In addition to viewing it on the Doris Manager log page, you can also access the fe/log/fe.audit.log file directly on the FE node.
Audit Log types:
| Type | Description |
|---|---|
slow_query | Slow queries whose execution time exceeds the threshold |
query | Regular queries |
load | Load tasks |
stream_load | Stream Load imports |
Filter slow queries directly from fe.audit.log
You can quickly filter slow queries through the slow_query tag in fe.audit.log. Example log:
2024-07-18 11:23:13,042 [slow_query] |Client=127.0.0.1:63510|User=root|Ctl=internal|Db=tpch_sf1000|State=EOF|ErrorCode=0|ErrorMessage=|Time(ms)=11603|ScanBytes=236667379712|ScanRows=13649979418|ReturnRows=100|StmtId=1689|QueryId=91ff336304f14182-9ca537eee75b3856|IsQuery=true|isNereids=true|feIp=172.21.0.10|Stmt=select     c_name,     c_custkey,     o_orderkey,     o_orderdate,     o_totalprice,     sum(l_quantity) from     customer,     orders,     lineitem where     o_orderkey  in  (         select             l_orderkey         from             lineitem         group  by             l_orderkey  having                 sum(l_quantity)  >  300     )     and  c_custkey  =  o_custkey     and  o_orderkey  =  l_orderkey group  by     c_name,     c_custkey,     o_orderkey,     o_orderdate,     o_totalprice order  by     o_totalprice  desc,     o_orderdate limit  100|CpuTimeMS=918556|ShuffleSendBytes=3267419|ShuffleSendRows=89668|SqlHash=b4e1de9f251214a30188180f37907f7d|peakMemoryBytes=38720935552|SqlDigest=f23c7a7ecff61da33f537b2699e9b053|cloudClusterName=UNKNOWN|TraceId=|WorkloadGroup=normal|FuzzyVariables=|scanBytesFromLocalStorage=0|scanBytesFromRemoteStorage=0
2024-07-18 11:23:33,043 [slow_query] |Client=127.0.0.1:26672|User=root|Ctl=internal|Db=tpch_sf1000|State=EOF|ErrorCode=0|ErrorMessage=|Time(ms)=8978|ScanBytes=334985555968|ScanRows=10717654374|ReturnRows=100|StmtId=1815|QueryId=6e1fae453cb04d9a-b1e5f94d9cea1885|IsQuery=true|isNereids=true|feIp=172.21.0.10|Stmt=select     s_name,     count(*) as numwait from     supplier,     lineitem l1,     orders,     nation where     s_suppkey = l1.l_suppkey     and o_orderkey = l1.l_orderkey     and o_orderstatus = 'F'     and l1.l_receiptdate > l1.l_commitdate     and exists (         select             *         from             lineitem l2         where                 l2.l_orderkey = l1.l_orderkey           and l2.l_suppkey <> l1.l_suppkey     )     and not exists (         select             *         from             lineitem l3         where                 l3.l_orderkey = l1.l_orderkey           and l3.l_suppkey <> l1.l_suppkey           and l3.l_receiptdate > l3.l_commitdate     )     and s_nationkey = n_nationkey     and n_name = 'SAUDI ARABIA' group by     s_name order by     numwait desc,     s_name limit 100|CpuTimeMS=990127|ShuffleSendBytes=59208164|ShuffleSendRows=3651504|SqlHash=f8a30e4182d72cce3eff6cb385005b1f|peakMemoryBytes=10495660672|SqlDigest=fec5a7136f9375aa968a4de971b994da|cloudClusterName=UNKNOWN|TraceId=|WorkloadGroup=normal|FuzzyVariables=|scanBytesFromLocalStorage=0|scanBytesFromRemoteStorage=0
2024-07-18 11:23:41,044 [slow_query] |Client=127.0.0.1:26684|User=root|Ctl=internal|Db=tpch_sf1000|State=EOF|ErrorCode=0|ErrorMessage=|Time(ms)=8514|ScanBytes=334986551296|ScanRows=10717654374|ReturnRows=100|StmtId=1833|QueryId=4f91483464ce4aa8-beeed7dcb8675bc8|IsQuery=true|isNereids=true|feIp=172.21.0.10|Stmt=select     s_name,     count(*) as numwait from     supplier,     lineitem l1,     orders,     nation where     s_suppkey = l1.l_suppkey     and o_orderkey = l1.l_orderkey     and o_orderstatus = 'F'     and l1.l_receiptdate > l1.l_commitdate     and exists (         select             *         from             lineitem l2         where                 l2.l_orderkey = l1.l_orderkey           and l2.l_suppkey <> l1.l_suppkey     )     and not exists (         select             *         from             lineitem l3         where                 l3.l_orderkey = l1.l_orderkey           and l3.l_suppkey <> l1.l_suppkey           and l3.l_receiptdate > l3.l_commitdate     )     and s_nationkey = n_nationkey     and n_name = 'SAUDI ARABIA' group by     s_name order by     numwait desc,     s_name limit 100|CpuTimeMS=925841|ShuffleSendBytes=59223190|ShuffleSendRows=3651602|SqlHash=f8a30e4182d72cce3eff6cb385005b1f|peakMemoryBytes=10505123104|SqlDigest=fec5a7136f9375aa968a4de971b994da|cloudClusterName=UNKNOWN|TraceId=|WorkloadGroup=normal|FuzzyVariables=|scanBytesFromLocalStorage=0|scanBytesFromRemoteStorage=0
2024-07-18 11:23:49,044 [slow_query] |Client=127.0.0.1:10748|User=root|Ctl=internal|Db=tpch_sf1000|State=EOF|ErrorCode=0|ErrorMessage=|Time(ms)=8660|ScanBytes=334987673600|ScanRows=10717654374|ReturnRows=100|StmtId=1851|QueryId=4599cb1bab204f80-ac430dd78b45e3da|IsQuery=true|isNereids=true|feIp=172.21.0.10|Stmt=select     s_name,     count(*) as numwait from     supplier,     lineitem l1,     orders,     nation where     s_suppkey = l1.l_suppkey     and o_orderkey = l1.l_orderkey     and o_orderstatus = 'F'     and l1.l_receiptdate > l1.l_commitdate     and exists (         select             *         from             lineitem l2         where                 l2.l_orderkey = l1.l_orderkey           and l2.l_suppkey <> l1.l_suppkey     )     and not exists (         select             *         from             lineitem l3         where                 l3.l_orderkey = l1.l_orderkey           and l3.l_suppkey <> l1.l_suppkey           and l3.l_receiptdate > l3.l_commitdate     )     and s_nationkey = n_nationkey     and n_name = 'SAUDI ARABIA' group by     s_name order by     numwait desc,     s_name limit 100|CpuTimeMS=932664|ShuffleSendBytes=59223178|ShuffleSendRows=3651991|SqlHash=f8a30e4182d72cce3eff6cb385005b1f|peakMemoryBytes=10505123104|SqlDigest=fec5a7136f9375aa968a4de971b994da|cloudClusterName=UNKNOWN|TraceId=|WorkloadGroup=normal|FuzzyVariables=|scanBytesFromLocalStorage=0|scanBytesFromRemoteStorage=0
fe.audit.log provides key information about slow SQL, including execution time, scan rows, returned rows, and the SQL statement, which lays the foundation for later reproduction and optimization.
Key field reference
| Field | Meaning |
|---|---|
Time(ms) | Query execution time (milliseconds) |
ScanBytes / ScanRows | Volume of scanned data and number of scanned rows |
ReturnRows | Number of rows returned to the client |
QueryId | Unique query ID, used to associate with the Profile |
Stmt | Full SQL statement |
SqlDigest | Hash of the SQL structure, used to aggregate SQL of the same pattern |
CpuTimeMS | Total CPU time (milliseconds) |
peakMemoryBytes | Peak memory usage |
WorkloadGroup | The Workload Group it belongs to |
Use SqlDigest for pattern aggregation
SqlDigest is a hash value generated from the SQL structure (with concrete parameters removed). SQL statements with the same structure share the same SqlDigest, which allows you to aggregate and analyze slow SQL patterns.
Based on SqlDigest, you can identify which SQL patterns occur most frequently or have the longest total execution time, and prioritize optimizing those patterns. This method significantly improves optimization efficiency and avoids analyzing statements one by one.
Note: SqlDigest is only a hash and is not directly readable. After you decide which pattern to optimize, you need to use the Stmt field to obtain the actual SQL, and use the QueryId to associate with the Profile for in-depth analysis (Profile is described in later chapters).
Slow query analysis example
Take the four slow query logs above as an example:
- The
SqlDigestof the first entry (Time(ms)=11603) isf23c7a7ecff61da33f537b2699e9b053. - The
SqlDigestof the next three entries (Time(ms)=8978/8514/8660) isfec5a7136f9375aa968a4de971b994da.
Although the last three entries differ in execution details, they belong to the same SQL pattern (the same structure).
In actual optimization, if a particular SqlDigest (such as fec5a7136f9375aa968a4de971b994da) appears repeatedly or accounts for a large share of cumulative execution time, you should focus on it first.
Optimization steps:
-
Locate the business logic: use the
Stmtfield of any log entry under this pattern to identify the business SQL:select s_name, count(*) as numwait from supplier, lineitem l1, orders, nation where ... -
In-depth analysis: use the
QueryId(such as6e1fae453cb04d9a-b1e5f94d9cea1885) to find the corresponding Query Profile. Use the Profile to identify bottlenecks (excessive scanned data, long Join time, and so on) and design an optimization strategy (add indexes, rewrite SQL, adjust the table structure, and so on).
After you resolve the issue for this pattern, all slow queries with the same pattern benefit from the fix.
audit_log system table
Doris 2.1 and later provide the audit_log system table under the __internal_schema database, which lets you query audit information through SQL.
Enablement steps
| Step | Command | Description |
|---|---|---|
| 1. Enable the plugin | set global enable_audit_plugin=true; | Enable the audit plugin globally; disabled by default |
| 2. Switch database | use __internal_schema; | Enter the internal schema |
| 3. Show tables | show tables; | Confirm that the audit_log table exists |
Verification example
mysql> use __internal_schema;
Reading table information for completion of table and column names
You can turn off this feature to get a quicker startup with -A

Database changed
mysql> show tables;
+-----------------------------+
| Tables_in___internal_schema |
+-----------------------------+
| audit_log                   |
| column_statistics           |
| histogram_statistics        |
| partition_statistics        |
+-----------------------------+
4 rows in set (0.00 sec)

mysql> desc audit_log;
+-------------------+--------------+------+-------+---------+-------+
| Field             | Type         | Null | Key   | Default | Extra |
+-------------------+--------------+------+-------+---------+-------+
| query_id          | varchar(48)  | Yes  | true  | NULL    |       |
| time              | datetime     | Yes  | true  | NULL    |       |
| client_ip         | varchar(128) | Yes  | true  | NULL    |       |
| user              | varchar(128) | Yes  | false | NULL    | NONE  |
| catalog           | varchar(128) | Yes  | false | NULL    | NONE  |
| db                | varchar(128) | Yes  | false | NULL    | NONE  |
| state             | varchar(128) | Yes  | false | NULL    | NONE  |
| error_code        | int          | Yes  | false | NULL    | NONE  |
| error_message     | text         | Yes  | false | NULL    | NONE  |
| query_time        | bigint       | Yes  | false | NULL    | NONE  |
| scan_bytes        | bigint       | Yes  | false | NULL    | NONE  |
| scan_rows         | bigint       | Yes  | false | NULL    | NONE  |
| return_rows       | bigint       | Yes  | false | NULL    | NONE  |
| stmt_id           | bigint       | Yes  | false | NULL    | NONE  |
| is_query          | tinyint      | Yes  | false | NULL    | NONE  |
| frontend_ip       | varchar(128) | Yes  | false | NULL    | NONE  |
| cpu_time_ms       | bigint       | Yes  | false | NULL    | NONE  |
| sql_hash          | varchar(128) | Yes  | false | NULL    | NONE  |
| sql_digest        | varchar(128) | Yes  | false | NULL    | NONE  |
| peak_memory_bytes | bigint       | Yes  | false | NULL    | NONE  |
| stmt              | text         | Yes  | false | NULL    | NONE  |
+-------------------+--------------+------+-------+---------+-------+
Through the audit_log internal table, you can use SQL to query detailed execution information and perform slow query filtering and statistical analysis.
FAQ
Q1: Why do I not see slow_query records in fe.audit.log?
- Cause: SQL execution time did not reach the threshold (default 5000 ms).
- Solution: adjust the threshold through
config.qe_slow_log_ms.
Q2: Why does querying the audit_log table return no data?
- Cause:
enable_audit_pluginis disabled by default. - Solution: run
set global enable_audit_plugin=true;.
Q3: Is it normal for SqlDigest to be identical while the literal SQL text differs?
- Yes.
SqlDigestis generated based on structure with parameter values removed; SQL statements with the same pattern but different parameters share the same hash.
Q4: Where can I find the audit_log table?
- It is located in the
__internal_schemadatabase and requires Doris 2.1 or later.
Q5: How do I associate with the Profile for in-depth analysis?
- Use the
QueryIdfield in the Audit Log to query the corresponding execution plan in the Profile system.
Summary
Doris provides three slow SQL diagnostic channels: Doris Manager logs, fe.audit.log, and the audit_log system table. They cover three usage scenarios: UI-based filtering, direct text inspection, and SQL-based statistics. By combining SqlDigest aggregation analysis with QueryId correlation to the Profile, you can systematically locate and optimize performance bottlenecks.