Query Profile Analysis Guide: Locating Slow Query Performance Bottlenecks in Doris
Query Profile is the diagnostic tool that Apache Doris uses to display query execution details. It records key metrics for each operator, such as elapsed time, row count, and memory usage, helping you quickly locate slow query bottlenecks.
Before reading, please check the following points:
- An Apache Doris cluster is deployed, and you have permission to modify the FE configuration file
fe.conf. - You are connected to Doris through a MySQL client and can run commands such as
show query profile. - You understand the basic concepts of the query plan (Fragment, PlanNode).
This article mainly contains three parts:
| Section | Content |
|---|---|
| Overall architecture | How a Profile is collected from BE and stored in FE |
| Parameter configuration | How to configure the system to filter out useless information and focus on key query details |
| Interpretation method | How to quickly locate the operators that affect query performance |
Overall Architecture of Query Profile
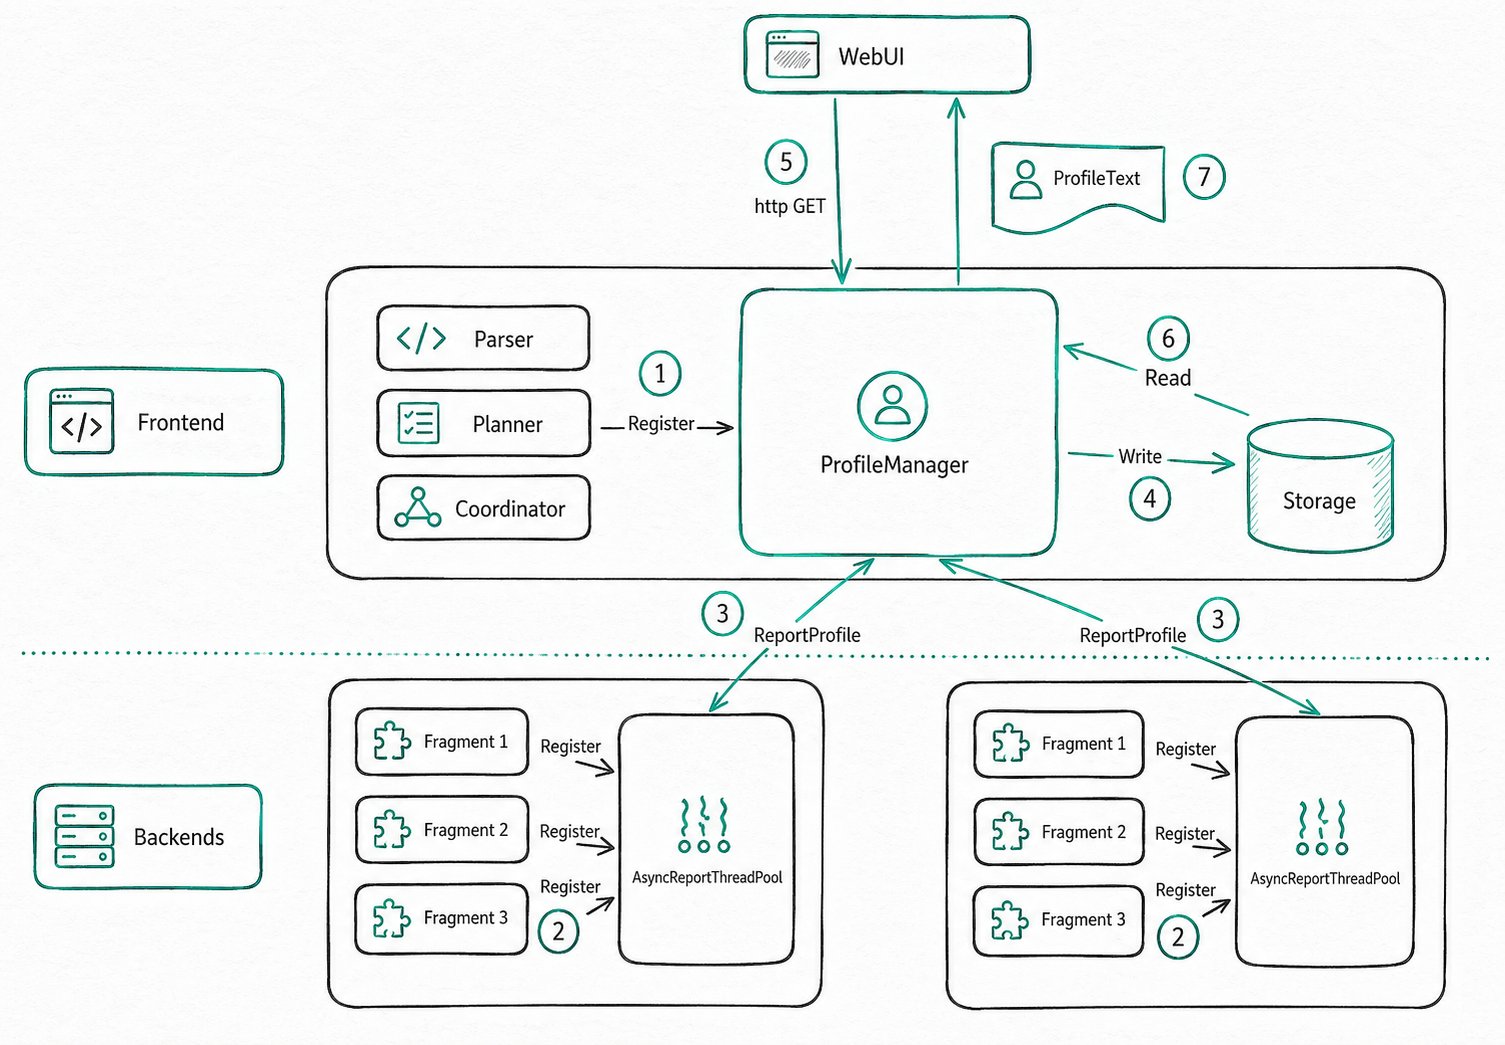
The core of Query Profile consists of two parts: the ProfileManager on FE and the AsyncReportThreadPool on BE.
Collection Process
| Step | Role | Action |
|---|---|---|
| 1 | FE | A user issues a query, and FE registers the Profile data structure with ProfileManager |
| 2 | BE | After the query completes, BE registers its own Profile as an asynchronous reporting task |
| 3 | BE | AsyncReportThreadPool initiates RPC at query granularity to send Profiles to FE |
| 4 | FE | A background thread processes Profiles, retains and evicts them based on policy, and writes suitable Profiles to storage after compression |
| 5 | User | The user views the Profile through the Web UI or a curl HTTP request |
| 6 | FE | ProfileManager looks up the Profile from memory or external storage and returns it as text |
In the entire process, the asynchronous reporting in step 2 and the Profile persistence in step 4 have the greatest impact on the Profile feature.
Asynchronous Reporting Timeout
When the cluster is under heavy load, asynchronous reporting may time out. To prevent FE from consuming too much memory, ProfileManager discards the timed-out Profile after waiting for a period of time.
- Adjustment method: Modify
profile_async_collect_expire_time_secsinfe.confto control the wait duration. - Recommended action: If timeouts occur frequently, first check the resource usage of the machines. If necessary, disable the global Profile to reduce risk.
Benefits of Profile Persistence
After ProfileManager persists Profiles to disk, the system ensures the following:
- Profiles no longer consume large amounts of FE memory.
- Previously generated Profiles can still be queried after FE restarts.
The first point allows FE to retain thousands of complete Profiles. The second point makes it easy to compare cluster performance before and after an upgrade, helping verify whether a version upgrade improves Doris query performance.
Configuring Profile
Parameter Quick Reference
| Parameter | Scope | Default | Description |
|---|---|---|---|
enable_profile | Session/Global | false | Whether to generate Profiles |
profile_level | Session/Global | 1 | Profile detail level (1 to 3, takes effect in 4.0+) |
auto_profile_threshold_ms | Global | -1 | Generate a Profile only for queries whose elapsed time exceeds the threshold (takes effect in 3.0+) |
max_query_profile_num | fe.conf | 500 | Maximum number of Profiles retained in FE memory |
max_spilled_profile_num | fe.conf | 500 | Maximum number of Profiles retained on disk |
spilled_profile_storage_path | fe.conf | log/profile | Local storage directory for Profiles |
spilled_profile_storage_limit_bytes | fe.conf | 1 GB | Total storage capacity limit for Profiles on disk |
Enabling Profile
enable_profile
- Purpose: Controls whether Profiles are generated.
- Command:
set enable_profile=true; - Description: The default is
false. When disabled, runningshow query profiledoes not return newly generated records.
mysql> select 1;
--------------
select 1
--------------

+------+
| 1    |
+------+
|    1 |
+------+
1 row in set (0.00 sec)

mysql> show query profile;
--------------
show query profile
--------------

+-----------------------------------+-----------+---------------------+---------------------+-------+------------+------+-----------------+------------+---------------+
| Profile ID                        | Task Type | Start Time          | End Time            | Total | Task State | User | Default Catalog | Default Db | Sql Statement |
+-----------------------------------+-----------+---------------------+---------------------+-------+------------+------+-----------------+------------+---------------+
| 74b9e30d6ba7491d-9dbf9289f6f5c208 | QUERY     | 2025-02-26 18:47:07 | 2025-02-26 18:47:07 | 4ms   | EOF        | root | internal        | tpcds      | select 1      |
+-----------------------------------+-----------+---------------------+---------------------+-------+------------+------+-----------------+------------+---------------+
1 row in set (0.01 sec)

mysql> set enable_profile=false;
--------------
set enable_profile=false
--------------

Query OK, 0 rows affected (0.00 sec)

mysql> select 1;
--------------
select 1
--------------

+------+
| 1    |
+------+
|    1 |
+------+
1 row in set (0.01 sec)

mysql> show query profile;
--------------
show query profile
--------------

+-----------------------------------+-----------+---------------------+---------------------+-------+------------+------+-----------------+------------+---------------+
| Profile ID                        | Task Type | Start Time          | End Time            | Total | Task State | User | Default Catalog | Default Db | Sql Statement |
+-----------------------------------+-----------+---------------------+---------------------+-------+------------+------+-----------------+------------+---------------+
| 74b9e30d6ba7491d-9dbf9289f6f5c208 | QUERY     | 2025-02-26 18:47:07 | 2025-02-26 18:47:07 | 4ms   | EOF        | root | internal        | tpcds      | select 1      |
+-----------------------------------+-----------+---------------------+---------------------+-------+------------+------+-----------------+------------+---------------+
1 row in set (0.00 sec)
profile_level
- Purpose: Controls the level of detail in the Profile.
- Command:
set profile_level=2; - Description: The default value is
1. This parameter takes effect in version 4.0 and the master branch. Do not use it in versions earlier than 4.0, where it has different semantics.
| Level | Behavior | Performance impact |
|---|---|---|
| 1 (default) | BE reports only a simplified Profile, sufficient for FE to aggregate into a MergedProfile | Minimal |
| 2 | Outputs more detailed Counters, suitable for in-depth analysis | Small |
| 3 | Maximum granularity. Collecting some Counters may affect query performance | Larger |
Example: By default, the Counters of EXCHANGE_OPERATOR are as follows:
EXCHANGE_OPERATOR(id=1):
     - InstanceID: ef33b72e30b84b68-82ad027edbee5910
     - BlocksProduced: 1
     - CloseTime: 4.243us
     - ExecTime: 30.834us
     - InitTime: 20.902us
     - MemoryUsage: 0.00
     - MemoryUsagePeak: 36.00 KB
     - OpenTime: 1.93us
     - ProjectionTime: 0ns
     - RowsProduced: 10
     - WaitForDependencyTime: 0ns
       - WaitForData0: 635.324us
When profile_level=2, you can see more detailed Counters:
EXCHANGE_OPERATOR(id=1):
     - InstanceID: 514023de1b7b41a3-9e59e43c591103a2
     - BlocksProduced: 1
     - CloseTime: 3.523us
     - CreateMergerTime: 0ns
     - DataArrivalWaitTime: 0ns
     - DecompressBytes: 0.00
     - DecompressTime: 0ns
     - DeserializeRowBatchTimer: 0ns
     - ExecTime: 28.439us
     - FilterTime: 287ns
     - FirstBatchArrivalWaitTime: 0ns
     - GetDataFromRecvrTime: 3.482us
     - InitTime: 18.258us
     - LocalBytesReceived: 36.00 KB
     - MaxFindRecvrTime(NS): 0
     - MaxWaitForWorkerTime: 0
     - MaxWaitToProcessTime: 0
     - MemoryUsage: 0.00
     - MemoryUsagePeak: 36.00 KB
     - OpenTime: 1.44us
     - ProjectionTime: 0ns
     - RemoteBytesReceived: 0.00
     - RowsProduced: 10
     - SendersBlockedTotalTimer(*): 0ns
     - WaitForDependencyTime: 0ns
       - WaitForData0: 596.708us
auto_profile_threshold_ms
- Purpose: Generate Profiles only for queries whose elapsed time exceeds the threshold, preventing the Profiles of small queries from drowning out those of slow queries.
- Command:
set global auto_profile_threshold_ms=1000; - Description: The default is
-1, which means Profiles are generated for all queries. This parameter takes effect in version 3.0 and later.
Why is this parameter needed? Enabling Profile globally produces a large amount of data, consuming FE CPU, memory, and disk, and affecting latency-sensitive small queries. As a result, FE periodically cleans up Profiles. This parameter ensures that the Profiles of slow queries are not drowned out.
Example: Suppose Profile is enabled globally, so all queries generate Profiles.
mysql> show query profile;
--------------
show query profile
--------------

+-----------------------------------+-----------+---------------------+---------------------+-------+------------+------+-----------------+------------+---------------+
| Profile ID                        | Task Type | Start Time          | End Time            | Total | Task State | User | Default Catalog | Default Db | Sql Statement |
+-----------------------------------+-----------+---------------------+---------------------+-------+------------+------+-----------------+------------+---------------+
| d59b04f636e49c0-bf6b6b3011c40f67  | QUERY     | 2025-02-26 18:25:59 | 2025-02-26 18:25:59 | 3ms   | EOF        | root | internal        | tpcds      | select 1      |
| f2ccb78011aa4526-9919ee76af1e57d7 | QUERY     | 2025-02-26 18:25:59 | 2025-02-26 18:25:59 | 4ms   | EOF        | root | internal        | tpcds      | select 1      |
| a8464728ebf5481d-864e3016ad22f045 | QUERY     | 2025-02-26 18:25:58 | 2025-02-26 18:25:58 | 6ms   | EOF        | root | internal        | tpcds      | select 1      |
| 912b09ea8f634c47-89e65d4fe354a94b | QUERY     | 2025-02-26 18:25:58 | 2025-02-26 18:25:58 | 4ms   | EOF        | root | internal        | tpcds      | select 1      |
| e6e6f0a3a31640bc-ad5994de0334ae8d | QUERY     | 2025-02-26 18:25:57 | 2025-02-26 18:25:57 | 4ms   | EOF        | root | internal        | tpcds      | select 1      |
| b28da27b4cc847a7-82e239320d6facc5 | QUERY     | 2025-02-26 18:25:57 | 2025-02-26 18:25:57 | 4ms   | EOF        | root | internal        | tpcds      | select 1      |
| fec3cdcd4664408c-a38508ce3a2bbe32 | QUERY     | 2025-02-26 18:24:48 | 2025-02-26 18:24:48 | 6ms   | EOF        | root | internal        | tpcds      | select 1      |
+-----------------------------------+-----------+---------------------+---------------------+-------+------------+------+-----------------+------------+---------------+
7 rows in set (0.00 sec)
To stop generating Profiles for these small queries, follow these steps:
mysql> clean all profile;
--------------
clean all profile
--------------

Query OK, 0 rows affected (0.01 sec)

mysql> set global auto_profile_threshold_ms=1000;
--------------
set global auto_profile_threshold_ms=1000
--------------

Query OK, 0 rows affected (0.01 sec)

mysql> select 1;
--------------
select 1
--------------

+------+
| 1    |
+------+
|    1 |
+------+
1 row in set (0.05 sec)

mysql> select 1;
--------------
select 1
--------------

+------+
| 1    |
+------+
|    1 |
+------+
1 row in set (0.01 sec)

mysql> show query profile;
--------------
show query profile
--------------

Empty set (0.00 sec)
Configuring Profile Storage
Doris supports persisting Profiles to the FE local disk to retain more records. You can control this through the following parameters in fe.conf:
| Parameter | Default | Description |
|---|---|---|
max_query_profile_num | 500 | Maximum number of Profiles retained in FE memory. Once exceeded, the oldest ones are evicted first |
max_spilled_profile_num | 500 | Maximum number of Profiles retained on disk. Once exceeded, the oldest ones are deleted first |
spilled_profile_storage_path | log/profile | Local storage directory for Profiles |
spilled_profile_storage_limit_bytes | 1 GB | Total storage capacity limit for Profiles retained on disk |
Retrieving Profiles
| Method | Applicable scenario | Entry point |
|---|---|---|
| FE Web UI | Daily troubleshooting, visual viewing | The QueryProfile page at ip:http_port |
| Command line | Security restrictions, batch download | show query profile + curl |
| Read disk files directly | Quickly access persisted Profiles | The zip files under the log/profile directory |
Retrieving via the FE Web UI
-
Purpose: View the Profiles of all queries on FE through a browser.
-
Operation: Visit the FE
ip:http_port, enter the username and password to enter the QueryProfile page, and click a Profile ID to view the details. -
Description:
- Profiles exist only on the FE that executes the SQL, and are not synchronized between multiple FEs. To retrieve a Profile, you need to connect to the FE that executed the SQL.
- All load tasks are eventually executed by the FE Master, so their Profiles must be retrieved from the FE Master.
Retrieving via the Command Line
In some scenarios (such as when there are security restrictions), you cannot access the FE Web UI. In these cases, you can retrieve Profiles through the command line.
Step 1: Use show query profile to retrieve metadata for the most recent 20 Profiles.
mysql> show query profile;
--------------
show query profile
--------------

+-----------------------------------+-----------+---------------------+---------------------+-------+------------+------+-----------------+------------+---------------+
| Profile ID                        | Task Type | Start Time          | End Time            | Total | Task State | User | Default Catalog | Default Db | Sql Statement |
+-----------------------------------+-----------+---------------------+---------------------+-------+------------+------+-----------------+------------+---------------+
| c7f48291d62147f4-92b1a511f6fe3395 | QUERY     | 2025-02-26 19:35:15 | 2025-02-26 19:35:15 | 5ms   | EOF        | root | internal        | tpch       | select 20     |
| 9c6cd24d2f354c6f-9652c097cae00b05 | QUERY     | 2025-02-26 19:35:12 | 2025-02-26 19:35:12 | 4ms   | EOF        | root | internal        | tpch       | select 19     |
| b908f7b484084492-9c4dc48762c9cb89 | QUERY     | 2025-02-26 19:35:09 | 2025-02-26 19:35:09 | 5ms   | EOF        | root | internal        | tpch       | select 18     |
| ef411c0eb00541dc-ba5a39677be3e117 | QUERY     | 2025-02-26 19:35:06 | 2025-02-26 19:35:06 | 5ms   | EOF        | root | internal        | tpch       | select 17     |
| c89deefa85974da7-ad53cb3d6f4cad75 | QUERY     | 2025-02-26 19:35:03 | 2025-02-26 19:35:03 | 5ms   | EOF        | root | internal        | tpch       | select 16     |
| dd97a36d2a1f4cbc-b23f13b975cd2dde | QUERY     | 2025-02-26 19:34:59 | 2025-02-26 19:34:59 | 6ms   | EOF        | root | internal        | tpch       | select 15     |
| af75095f7a7c4d9f-9422d04d0604f904 | QUERY     | 2025-02-26 19:34:56 | 2025-02-26 19:34:56 | 8ms   | EOF        | root | internal        | tpch       | select 14     |
| 2764a7aaf2cf446d-922b4c5b5f853788 | QUERY     | 2025-02-26 19:34:54 | 2025-02-26 19:34:54 | 10ms  | EOF        | root | internal        | tpch       | select 13     |
| bf15d7d96b9c4f6b-8e6fe4c40b077ae8 | QUERY     | 2025-02-26 19:34:53 | 2025-02-26 19:34:53 | 9ms   | EOF        | root | internal        | tpch       | select 12     |
| ebf2221627b0435e-9bafebbe46d7315d | QUERY     | 2025-02-26 19:34:51 | 2025-02-26 19:34:51 | 7ms   | EOF        | root | internal        | tpch       | select 11     |
| 3309a4c57f61471c-9c863f6bb72a146b | QUERY     | 2025-02-26 19:34:50 | 2025-02-26 19:34:50 | 10ms  | EOF        | root | internal        | tpch       | select 10     |
| cb764ed358f34312-a7c56cbf7f521761 | QUERY     | 2025-02-26 19:34:48 | 2025-02-26 19:34:48 | 10ms  | EOF        | root | internal        | tpch       | select 9      |
| 38878f3344b649ff-a69f1c8cd0dc1960 | QUERY     | 2025-02-26 19:34:46 | 2025-02-26 19:34:46 | 9ms   | EOF        | root | internal        | tpch       | select 8      |
| 1182dc4c8105407c-b77c50a993cc0cb1 | QUERY     | 2025-02-26 19:34:42 | 2025-02-26 19:34:42 | 14ms  | EOF        | root | internal        | tpch       | select 7      |
| 8596d808d2814e8d-aefbac7d30a599d1 | QUERY     | 2025-02-26 19:34:40 | 2025-02-26 19:34:40 | 31ms  | EOF        | root | internal        | tpch       | select 6      |
| 325a66e868844aa4-90fae17f3a98d3e6 | QUERY     | 2025-02-26 19:34:38 | 2025-02-26 19:34:38 | 40ms  | EOF        | root | internal        | tpch       | select 5      |
| e30d1166a2674393-997246e064a7674c | QUERY     | 2025-02-26 19:34:36 | 2025-02-26 19:34:36 | 19ms  | EOF        | root | internal        | tpch       | select 4      |
| 4dfb91db8b448db-a4eab023bc119cea  | QUERY     | 2025-02-26 19:34:33 | 2025-02-26 19:34:33 | 14ms  | EOF        | root | internal        | tpch       | select 3      |
| 1453559772434cda-b64c2eae47ce6424 | QUERY     | 2025-02-26 19:34:31 | 2025-02-26 19:34:31 | 10ms  | EOF        | root | internal        | tpch       | select 2      |
| cbf8bf829740488c-b6da653e391b13c6 | QUERY     | 2025-02-26 19:34:30 | 2025-02-26 19:34:30 | 20ms  | EOF        | root | internal        | tpch       | select 1      |
+-----------------------------------+-----------+---------------------+---------------------+-------+------------+------+-----------------+------------+---------------+
20 rows in set (0.00 sec)
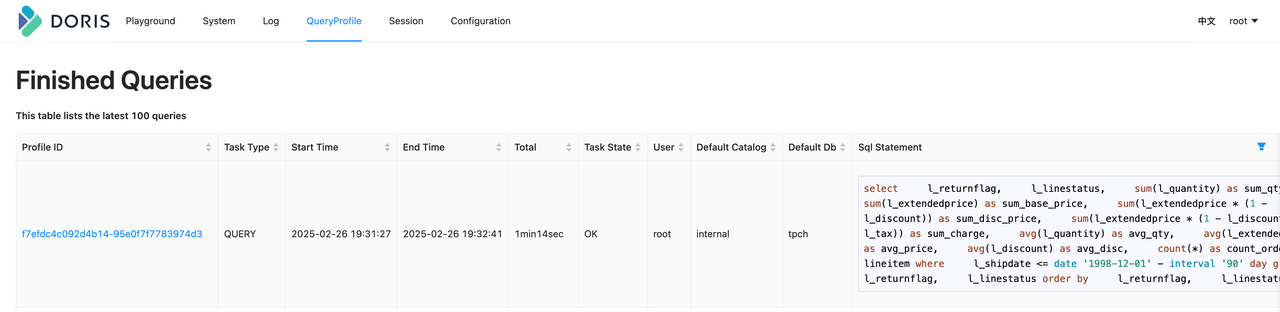
Step 2: Access the HTTP API through curl to retrieve a specific Profile. For example, to retrieve the Profile with ID f7efdc4c092d4b14-95e0f7f7783974d3:
curl -uroot: http://127.0.0.1:5937/api/profile/text?query_id=f7efdc4c092d4b14-95e0f7f7783974d3 > f7efdc4c092d4b14-95e0f7f7783974d3.profile
The result is the same as in the Web UI:
> head f7efdc4c092d4b14-95e0f7f7783974d3.profile -n 10
Summary:
   - Profile ID: f7efdc4c092d4b14-95e0f7f7783974d3
   - Task Type: QUERY
   - Start Time: 2025-02-26 19:31:27
   - End Time: 2025-02-26 19:32:41
   - Total: 1min14sec
   - Task State: OK
   - User: root
   - Default Catalog: internal
   - Default Db: tpch
Retrieving Profile Files Directly From Disk
Starting from 3.0, Profiles support persistence, with the default save directory being log/profile. For faster viewing, you can directly use unzip to extract the target file and obtain the text format.
Notes:
- Doris FE has a protection mechanism for the
log/profiledirectory. Do not leave the extracted output inside that directory, or it will be deleted. - The Profile text differs slightly from what is shown in the Web UI: the
Summaryis saved as JSON metadata, while the rest is consistent with the Web UI.
[hezhiqiang@VM-10-2-centos log]$ unzip profile/1740745121714_33bf38e988ea4945-b585d2f74d1da3fd.zip
Archive:  profile/1740745121714_33bf38e988ea4945-b585d2f74d1da3fd.zip
  inflating: 33bf38e988ea4945-b585d2f74d1da3fd.profile
[hezhiqiang@VM-10-2-centos log]$ head 33bf38e988ea4945-b585d2f74d1da3fd.profile -n 10
{"summaryProfile":{"counterTotalTime":{"value":0,"type":5,"level":1},"localTimePercent":0.0,"infoStrings":{"Distributed Plan":"N/A","Task Type":"QUERY","User":"root","Default Catalog":"internal","Total":"9sec745ms","Default Db":"tpch","Profile ID":"33bf38e988ea4945-b585d2f74d1da3fd","Task State":"OK","Sql Statement":"SELECT      c.c_name,      COUNT(o.o_orderkey) AS total_orders,      SUM(o.o_totalprice) AS total_spent FROM      customer c JOIN      orders o ON c.c_custkey = o.o_custkey GROUP BY      c.c_name limit 20","Start Time":"2025-02-28 20:18:31","End Time":"2025-02-28 20:18:41"}, ...}
Changed Session Variables:
VarName                       | CurrentValue | DefaultValue
------------------------------|--------------|-------------
insert_visible_timeout_ms     | 10000        | 60000
fetch_splits_max_wait_time_ms | 4000         | 1000
exec_mem_limit                | 2147483648   | 100147483648
profile_level                 | 2            | 1
auto_profile_threshold_ms     | 1            | -1
Profile Structure
The content of a Profile is divided into the following five parts:
| Part | Purpose | When to use |
|---|---|---|
| Summary | Profile metadata, recording key fields used for retrieval | Search Profiles, confirm basic query information |
| ExecutionSummary | Summary of the execution process, including the time taken by each Planner stage | Troubleshoot SQL compilation/planning stage time |
| ChangedSessionVariables | Session variables changed during the execution of this query | Troubleshoot performance problems caused by abnormal configurations |
| MergedProfile | Aggregated result of DetailProfile | Quickly understand the query structure, locate bottleneck operators, and compare data skew |
| DetailProfile | Execution details of each Fragment and the PipelineTask of each Pipeline on all BEs | Conduct in-depth analysis after locating a bottleneck |
1. Summary
SummaryProfile is the metadata of the Profile, recording key fields used for retrieval, such as Profile ID and Total.
-  Profile  ID:  d4d281168bf7490a-a133623295744f85
-  Task  Type:  QUERY
-  Start  Time:  2025-02-28  19:23:14
-  End  Time:  2025-02-28  19:23:16
-  Total:  2sec420ms
-  Task  State:  OK
2. ExecutionSummary
A summary of the execution process. Among them, the Plan-related fields record the time taken by the Planner.
3. ChangedSessionVariables
Records the session variables changed during the execution of this query.
ChangedSessionVariables:
VarName                       | CurrentValue | DefaultValue
------------------------------|--------------|-------------
insert_visible_timeout_ms     | 10000        | 60000
fetch_splits_max_wait_time_ms | 4000         | 1000
exec_mem_limit                | 2147483648   | 100147483648
profile_level                 | 2            | 1
auto_profile_threshold_ms     | 1            | -1
The table above indicates that 5 session variables were changed before this query was executed.
4. MergedProfile
MergedProfile is the aggregated result of DetailProfile. It mainly serves three purposes:
-
Quickly understand the structure of the query plan and Pipelines
A Doris query plan has a hierarchical structure of Query, Fragment, and PlanNode. The execution layer schedules tasks at the Pipeline level, and each Pipeline consists of a group of Operators. MergedProfile clearly shows this conversion relationship.
-
Quickly locate performance bottleneck operators
When locating performance issues, you usually need to identify the specific bottleneck operator. First, find the operator with the longest elapsed time in MergedProfile based on
DependencyWaitTime, and then check its details in DetailProfile to further determine the bottleneck. -
Compare data skew
MergedProfile records the details of how data flows between operators. By comparing
InputRowsandRowsProduced, you can determine whether the data on different Backends is unevenly distributed. Uneven data distribution often causes queries to slow down or fail.
5. DetailProfile
The detailed execution information. DetailProfile records the execution details of each PipelineTask for every Fragment and Pipeline in the query, on all Backends. After confirming the bottleneck through MergedProfile, you usually combine it with DetailProfile for in-depth analysis.
Profile Interpretation Example
The following example uses a typical query that includes Aggregation, Join, and Scan to illustrate how to interpret a Profile. It performs a JOIN on the customer and orders tables of the TPCH dataset, and then aggregates the results:
SELECT c.c_name,
       Count(o.o_orderkey) AS total_orders,
       Sum(o.o_totalprice) AS total_spent
FROM   customer c
       JOIN orders o
         ON c.c_custkey = o.o_custkey
GROUP  BY c.c_name
LIMIT  20
To prevent the Profile from becoming too verbose, limit the query parallelism:
set parallel_pipeline_task_num=2;
After running the query above and retrieving the Profile through the Web UI, focus on MergedProfile first. To focus on the overall structure, only the key fields are kept below. For the meaning of other fields, refer to related documentation.
MergedProfile:
     Fragments:
       Fragment 0:
         Pipeline 0(instance_num=1):
           RESULT_SINK_OPERATOR(id=0):
             CommonCounters:
                - ExecTime: avg 176.545us, max 176.545us, min 176.545us
                - InputRows: sum 20, avg 20, max 20, min 20
                - WaitForDependency[RESULT_SINK_OPERATOR_DEPENDENCY]Time: avg 0ns, max 0ns, min 0ns
             CustomCounters:
           EXCHANGE_OPERATOR(id=8):
             CommonCounters:
                - ExecTime: avg 84.559us, max 84.559us, min 84.559us
                - RowsProduced: sum 20, avg 20, max 20, min 20
             CustomCounters:
                - WaitForDependencyTime: avg 0ns, max 0ns, min 0ns
                  - WaitForData0: avg 11sec450ms, max 11sec450ms, min 11sec450ms
       Fragment 1:
         Pipeline 0(instance_num=2):
           DATA_STREAM_SINK_OPERATOR(dest_id=8):
             CommonCounters:
                - ExecTime: avg 31.515us, max 33.405us, min 29.626us
                - InputRows: sum 20, avg 10, max 11, min 9
                - WaitForDependencyTime: avg 0ns, max 0ns, min 0ns
                  - WaitForRpcBufferQueue: avg 0ns, max 0ns, min 0ns
             CustomCounters:
                - BlocksProduced: sum 2, avg 1, max 1, min 1
           SORT_OPERATOR(nereids_id=443)(id=7):
             CommonCounters:
                - ExecTime: avg 980ns, max 1.199us, min 762ns
                - RowsProduced: sum 20, avg 10, max 11, min 9
                - WaitForDependency[SORT_OPERATOR_DEPENDENCY]Time: avg 11sec450ms, max 11sec450ms, min 11sec450ms
             CustomCounters:
         Pipeline 1(instance_num=2):
           SORT_SINK_OPERATOR(nereids_id=443)(id=7):
             CommonCounters:
                - ExecTime: avg 49.414us, max 54.802us, min 44.27us
                - InputRows: sum 20, avg 10, max 11, min 9
                - WaitForDependency[SORT_SINK_OPERATOR_DEPENDENCY]Time: avg 0ns, max 0ns, min 0ns
             CustomCounters:
           AGGREGATION_OPERATOR(nereids_id=438)(id=6):
             CommonCounters:
                - ExecTime: avg 34.521us, max 36.402us, min 32.640us
                - RowsProduced: sum 20, avg 10, max 11, min 9
                - WaitForDependency[AGGREGATION_OPERATOR_DEPENDENCY]Time: avg 11sec450ms, max 11sec450ms, min 11sec450ms
             CustomCounters:
         Pipeline 2(instance_num=2):
           AGGREGATION_SINK_OPERATOR(nereids_id=438)(id=6):
             CommonCounters:
                - ExecTime: avg 109.89us, max 118.582us, min 99.596us
                - InputRows: sum 40, avg 20, max 22, min 18
                - WaitForDependency[AGGREGATION_SINK_OPERATOR_DEPENDENCY]Time: avg 0ns, max 0ns, min 0ns
             CustomCounters:
           EXCHANGE_OPERATOR(id=5):
             CommonCounters:
                - ExecTime: avg 29.741us, max 34.521us, min 24.962us
                - RowsProduced: sum 40, avg 20, max 22, min 18
             CustomCounters:
                - WaitForDependencyTime: avg 0ns, max 0ns, min 0ns
                  - WaitForData0: avg 11sec450ms, max 11sec450ms, min 11sec450ms
       Fragment 2:
         Pipeline 0(instance_num=2):
           DATA_STREAM_SINK_OPERATOR(dest_id=5):
             CommonCounters:
                - ExecTime: avg 71.148us, max 73.242us, min 69.54us
                - InputRows: sum 40, avg 20, max 20, min 20
                - WaitForDependencyTime: avg 0ns, max 0ns, min 0ns
                  - WaitForRpcBufferQueue: avg 0ns, max 0ns, min 0ns
             CustomCounters:
           AGGREGATION_OPERATOR(nereids_id=428)(id=4):
             CommonCounters:
                - ExecTime: avg 350.431us, max 393.100us, min 307.762us
                - RowsProduced: sum 40, avg 20, max 20, min 20
                - WaitForDependency[AGGREGATION_OPERATOR_DEPENDENCY]Time: avg 11sec30ms, max 11sec450ms, min 10sec610ms
             CustomCounters:
         Pipeline 1(instance_num=2):
           AGGREGATION_SINK_OPERATOR(nereids_id=428)(id=4):
             CommonCounters:
                - ExecTime: avg 442.308ms, max 449.109ms, min 435.506ms
                - InputRows: sum 150.0M (150000000), avg 75.0M (75000000), max 75.000001M (75000001), min 74.999999M (74999999)
                - MemoryUsage: sum 2.05 MB, avg 1.03 MB, max 1.03 MB, min 1.03 MB
                - MemoryUsagePeak: sum 2.05 MB, avg 1.03 MB, max 1.03 MB, min 1.03 MB
                - WaitForDependency[AGGREGATION_SINK_OPERATOR_DEPENDENCY]Time: avg 0ns, max 0ns, min 0ns
             CustomCounters:
                - MemoryUsageHashTable: sum 1.03 MB, avg 526.28 KB, max 526.28 KB, min 526.28 KB
                - MemoryUsageSerializeKeyArena: sum 1.02 MB, avg 524.00 KB, max 524.00 KB, min 524.00 KB
           HASH_JOIN_OPERATOR(nereids_id=418)(id=3):
             CommonCounters:
                - ExecTime: avg 9sec169ms, max 9sec582ms, min 8sec756ms
                - RowsProduced: sum 150.0M (150000000), avg 75.0M (75000000), max 75.000001M (75000001), min 74.999999M (74999999)
                - WaitForDependency[HASH_JOIN_OPERATOR_DEPENDENCY]Time: avg 949.860ms, max 962.978ms, min 936.743ms
             CustomCounters:
                - ProbeRows: sum 150.0M (150000000), avg 75.0M (75000000), max 75.000001M (75000001), min 74.999999M (74999999)
           OLAP_SCAN_OPERATOR(nereids_id=397. table_name=orders(orders))(id=2):
             CommonCounters:
                - ExecTime: avg 396.233ms, max 410.306ms, min 382.160ms
                - RowsProduced: sum 150.0M (150000000), avg 75.0M (75000000), max 75.000001M (75000001), min 74.999999M (74999999)
             CustomCounters:
                - WaitForDependency[OLAP_SCAN_OPERATOR_DEPENDENCY]Time: avg 0ns, max 0ns, min 0ns
         Pipeline 2(instance_num=2):
           HASH_JOIN_SINK_OPERATOR(nereids_id=418)(id=3):
             CommonCounters:
                - ExecTime: avg 445.146ms, max 890.258ms, min 34.635us
                - InputRows: sum 15.0M (15000000), avg 7.5M (7500000), max 15.0M (15000000), min 0
                - WaitForDependency[HASH_JOIN_SINK_OPERATOR_DEPENDENCY]Time: avg 482.355ms, max 964.711ms, min 0ns
             CustomCounters:
                - MemoryUsageHashTable: sum 185.22 MB, avg 92.61 MB, max 185.22 MB, min 0.00
           EXCHANGE_OPERATOR(id=1):
             CommonCounters:
                - ExecTime: avg 10.131ms, max 20.243ms, min 19.26us
                - RowsProduced: sum 15.0M (15000000), avg 7.5M (7500000), max 15.0M (15000000), min 0
             CustomCounters:
                - WaitForDependencyTime: avg 0ns, max 0ns, min 0ns
                  - WaitForData0: avg 47.582ms, max 47.582ms, min 47.582ms
       Fragment 3:
         Pipeline 0(instance_num=2):
           DATA_STREAM_SINK_OPERATOR(dest_id=1):
             CommonCounters:
                - ExecTime: avg 3.269ms, max 3.281ms, min 3.258ms
                - InputRows: sum 15.0M (15000000), avg 7.5M (7500000), max 7.500001M (7500001), min 7.499999M (7499999)
                - WaitForDependencyTime: avg 0ns, max 0ns, min 0ns
                  - WaitForLocalExchangeBuffer0: avg 142.859ms, max 285.713ms, min 6.733us
                  - WaitForRpcBufferQueue: avg 0ns, max 0ns, min 0ns
             CustomCounters:
           OLAP_SCAN_OPERATOR(nereids_id=403. table_name=customer(customer))(id=0):
             CommonCounters:
                - ExecTime: avg 77.435ms, max 78.752ms, min 76.118ms
                - RowsProduced: sum 15.0M (15000000), avg 7.5M (7500000), max 7.500001M (7500001), min 7.499999M (7499999)
             CustomCounters:
                - WaitForDependency[OLAP_SCAN_OPERATOR_DEPENDENCY]Time: avg 49.690ms, max 50.522ms, min 48.858ms
The above is a simplified MergedProfile. A Doris query plan has a three-level structure of Query, Fragment, and PlanNode, while the execution engine on the Backend adds two more layers on top: Pipeline and Operator. The figure below first shows how the query above is divided into three levels from the perspective of the query plan.
Query, Fragment, and PlanNode
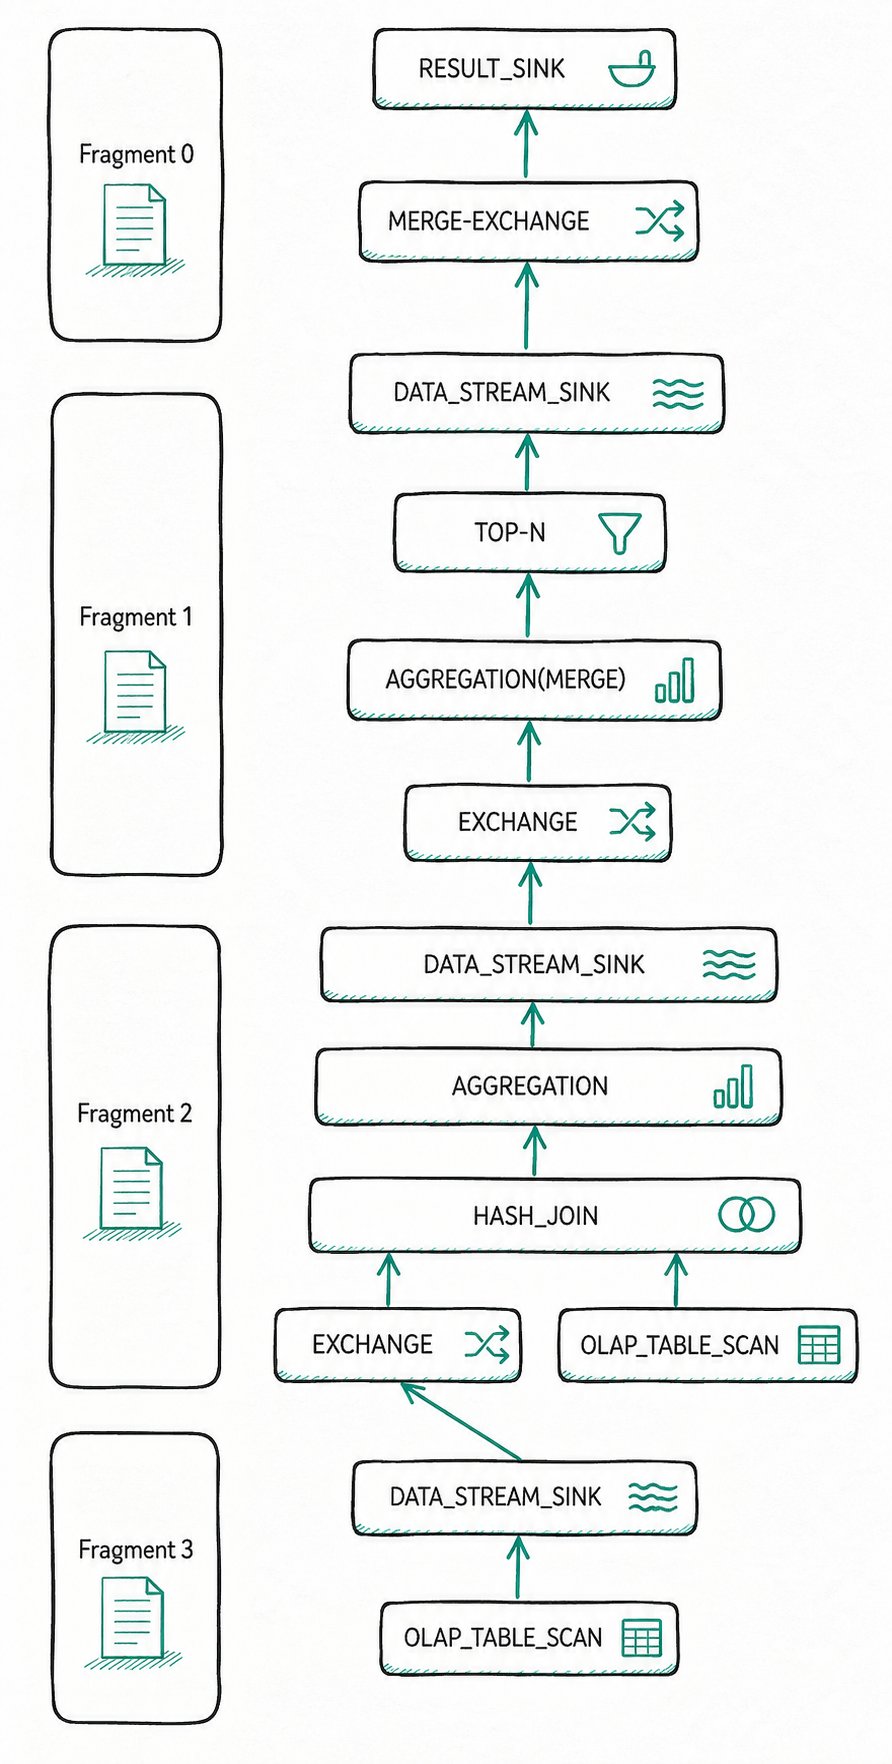
The arrows in the figure indicate the data flow direction. The query plan of the entire Query is divided into 4 Fragments (the four boxes on the left of the figure) and multiple PlanNodes (a Fragment and the PlanNodes it contains are on the same horizontal line). The roles of each PlanNode are as follows:
| PlanNode | Role |
|---|---|
SCAN_NODE x2 | Read the customer and orders tables respectively |
DATA_STREAM_SINK / EXCHANGE | Pass data between different Fragments |
HASH_JOIN | Perform the join operation on the data read by SCAN |
AGGREGATION (first stage) / AGGREGATION(MERGE) (second stage) | Two-stage aggregation |
TOP-N | Limit the number of result rows |
RESULT_SINK | Return the final result to FE |
Pipelines and Operators
How is the above query plan transformed into Pipelines and Operators in the execution engine? Take Fragment 1 and Fragment 2, which contain AGGREGATION and HASH_JOIN, as an example.
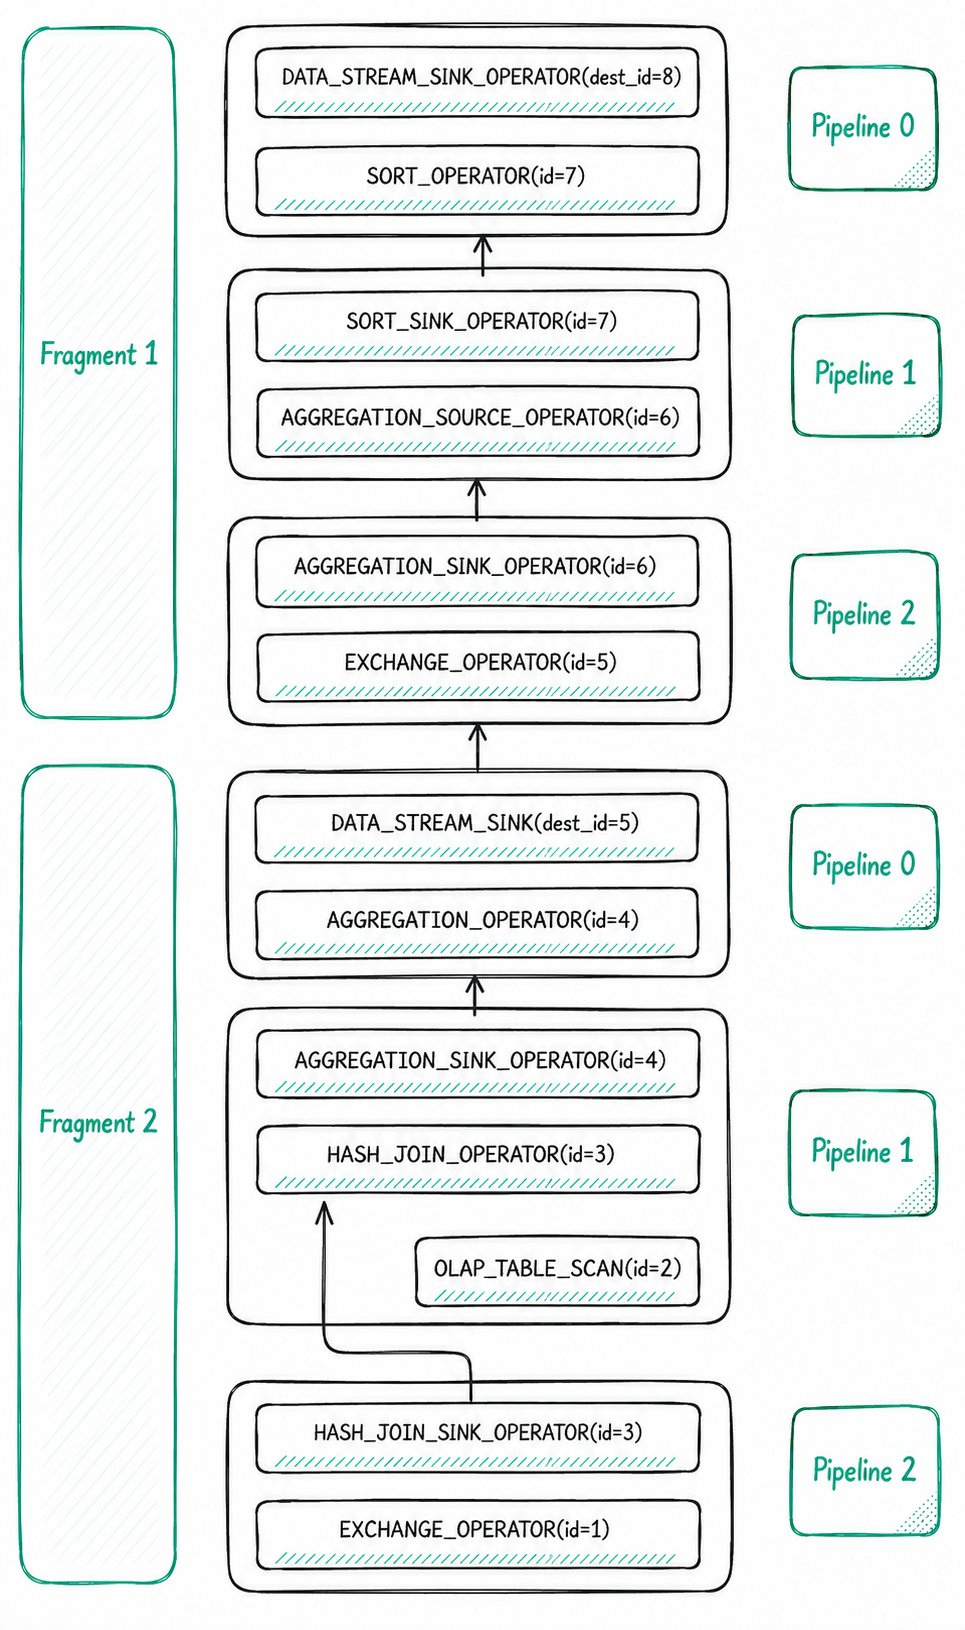
During execution, the Doris execution engine splits some PlanNodes into one or more Operators.
Example 1: DATA_STREAM_SINK
DATA_STREAM_SINK is converted into a DATA_STREAM_SINK_OPERATOR. This node is the operator through which a Fragment outputs data externally. It does not have its own OperatorId, only the destination OperatorId. For example, dest_id=5 indicates that this operator sends data to the EXCHANGE_OPERATOR with id=5.
Example 2: HASH_JOIN
The HASH_JOIN with PlanNodeId equal to 3 is split into two Operators: HASH_JOIN_SINK_OPERATOR and HASH_JOIN_OPERATOR. The Operator Id of both is 3, which equals the PlanNodeId. The first-stage AGGREGATION and the second-stage AGGREGATION(MERGE) are also each split into a pair of SINK and SOURCE operators.
Pipeline Connection and Blocking Relationships
After PlanNodes are split into Operators, the execution engine connects some of these Operators to form Pipelines. Each of Fragment 1 and Fragment 2 contains 3 Pipelines internally.
| Blocking type | Source | Example |
|---|---|---|
| Computation logic dependency | The order of computation between operators | The Probe side of HashJoin must wait for the Build side to finish constructing the hash table |
| Physical environment dependency | System factors such as network and buffering | An EXCHANGE_OPERATOR must wait for a DATA_STREAM_SINK_OPERATOR to transmit data over the network |
Data flow between Operators within the same Pipeline does not block. Connections between Operators across Pipelines do have blocking relationships. By connecting non-blocking Operators into a Pipeline for scheduling and execution, you can improve resource utilization and cache hit rate.
CommonCounters and CustomCounters
CommonCounters are Counters that every Operator must have. Currently, those in Doris include:
| Counter | Applicable operators | Meaning |
|---|---|---|
ExecTime | All | The time spent on executing the current Operator, excluding upstream operators |
RowsProduced | Non-Sink Operators | The number of rows output by the source operator |
InputRows | Sink Operators | The number of input rows received by the current operator |
MemoryUsage & MemoryUsagePeak | All | The current memory usage and peak memory usage of the operator |
WaitForDependency | All | The time spent waiting for dependencies to finish executing |
CustomCounters are Counters specific to each Operator. Refer to the document "Doris Operator Profile Overview" for a detailed description of the meaning of each operator's CustomCounter.
Interpreting HashJoin
After clarifying the basic concepts of Doris execution, return to the previous query and reconstruct the execution details of the Join through MergedProfile.
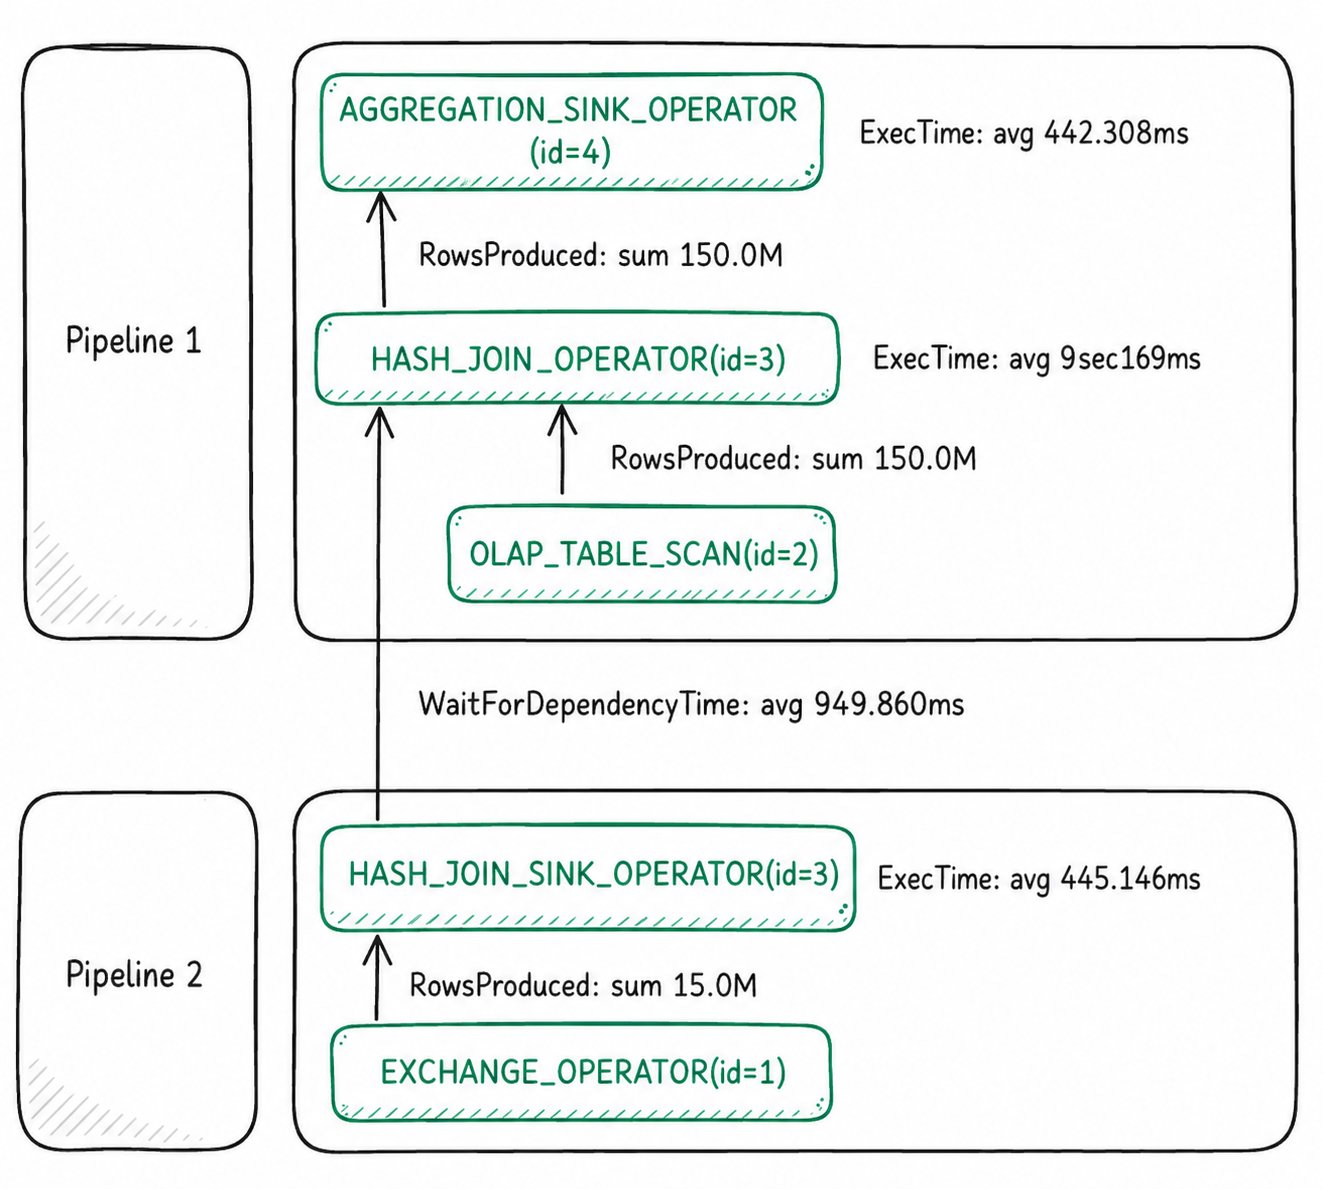
Before running the SQL, the query Pipeline parallelism was set to 2. So although only one set of connected Pipeline 1 and Pipeline 2 is shown in the figure, in actual execution they should have 4 Pipeline Tasks: each Pipeline has two Pipeline Tasks.
Pipeline 0(instance_num=2)
The instance_num in parentheses after each Pipeline equals the total number of PipelineTasks for that Pipeline across all BEs. The cluster used here has only 1 BE, so instance_num = 1 * parallel_pipeline_task_num = 2.
Build side: Building the HashTable
The two PipelineTasks of Pipeline 2 cumulatively processed 15M rows of data to build the HashTable, with an average execution time of 445.146 ms for HashTable construction. Pipeline 1 can only execute after Pipeline 2 finishes building the HashTable. The wait time is reflected in WaitForDependency, where avg is 949.860 ms. But the average HashTable build time is only 445.146 ms. Where does the gap come from?
HASH_JOIN_SINK_OPERATOR(nereids_id=418)(id=3):
 CommonCounters:
    - ExecTime: avg 445.146ms, max 890.258ms, min 34.635us
    - InputRows: sum 15.0M (15000000), avg 7.5M (7500000), max 15.0M (15000000), min 0
    - WaitForDependency[HASH_JOIN_SINK_OPERATOR_DEPENDENCY]Time: avg 482.355ms, max 964.711ms, min 0ns
 CustomCounters:
    - MemoryUsageHashTable: sum 185.22 MB, avg 92.61 MB, max 185.22 MB, min 0.00
The reason: in this case, FE planned the JOIN type as BROADCAST_JOIN. With this type, only one of the two PipelineTasks performing the JOIN Build operation actually builds the hash table. From the MergedProfile of HASH_JOIN_SINK_OPERATOR you can see:
- The average execution time is 445.146 ms, but the slowest PipelineTask takes 890.258 ms, and the fastest only 34.635 us.
- The
minofInputRowsis 0, indicating that all data was processed by one PipelineTask, while the other PipelineTask did nothing.
This explains the wait time on the line below:
- WaitForDependency[HASH_JOIN_OPERATOR_DEPENDENCY]Time: avg 949.860ms, max 962.978ms, min 936.743ms
Probe side: Scan and join
Now look at HASH_JOIN_OPERATOR. After waiting an average of 949.860 ms, it starts executing the Probe side of the JOIN. Two OLAP_SCAN_OPERATOR instances with id=2 read 150M rows from storage. After these 150M rows are processed by HASH_JOIN_OPERATOR, none remain. All of them are passed up to AGGREGATION_SINK_OPERATOR. This operator builds a hash table for these 150M rows and continues with the aggregation computation.
Interpreting Aggregation
The aggregation operations involved in this query are Count(o.o_orderkey) AS total_orders, Sum(o.o_totalprice) AS total_spent and GROUP BY c.c_name.
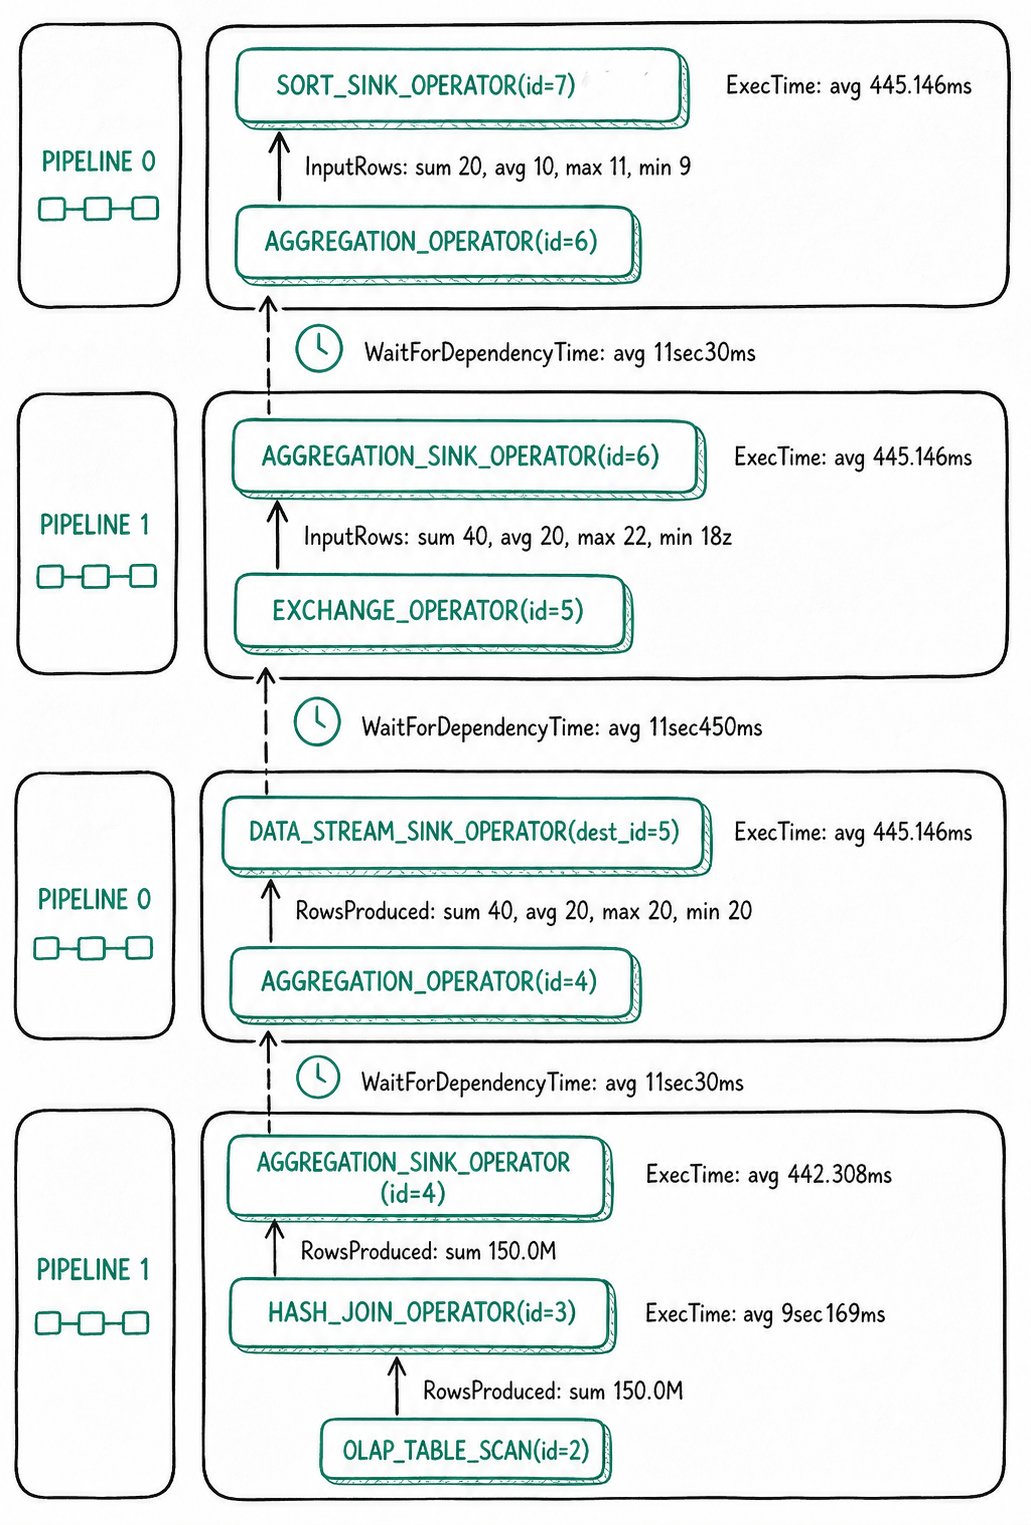
For this query, Doris uses two-stage Aggregation.
First-stage aggregation
- Completed in the pair of AGGREGATION operators with
id=4. - The input of
AGGREGATION_SINK_OPERATOR(id=4)totals 150M rows. It builds a hash table on theGROUP BYcolumn and updates theAggregationDatafor each aggregation result. - After the first stage finishes, it sends the
AggregationDatato the second stage through EXCHANGE. Since different PipelineTasks may process the same GROUP BY column, the EXCHANGE stage performs HASH partitioning on thenamecolumn to send rows with the same name to the same second-stage operator. - The output of
AGGREGATION_OPERATOR(id=4)is 40 rows in total, indicating that the hash table built in the first stage has 40 rows.
Second-stage aggregation
AGGREGATION_SINK_OPERATOR(id=6)deserializes the result of the first stage back intoAggregationData, and then performs the Merge operation.- The result is sent by
AGGREGATION_OPERATOR(id=6)to the downstream TOP-N. Since the query hasLIMIT 20, the TOP-N operator finishes early after collecting 20 rows.
Overall bottleneck
Overall, the most time-consuming operation in this query is HASH_JOIN_OPERATOR(id=3). After locating it, you can continue to view the more fine-grained Counters of HASH_JOIN_OPERATOR(id=3) in DetailProfile. For the meaning of each Counter, refer to the dedicated documentation for each operator.
Troubleshooting and FAQ
show query profile returns empty?
- Check whether
enable_profileistrue:show variables like 'enable_profile';. - Check
auto_profile_threshold_ms. If it is set to a large value, short queries will not generate Profiles. - Confirm that the FE you are connected to is the same node as the FE that executed the SQL. Load tasks require connecting to the FE Master.
Profile reporting times out frequently?
-
Symptom: The FE log shows asynchronous Profile collection timeouts.
-
Handling:
- Check the CPU, memory, and network resource usage of the machines.
- Increase
profile_async_collect_expire_time_secsinfe.conf. - In extreme cases, disable the global Profile and only collect Profiles for slow queries (set
auto_profile_threshold_ms).
Profile takes up too much FE memory?
- Decrease
max_query_profile_numto limit the number of Profiles retained in memory. - Enable disk persistence (enabled by default) to spill historical Profiles to disk.
- Use
auto_profile_threshold_msto filter out small queries.
The extracted Profile file is gone?
- Cause: FE has a cleanup protection mechanism for the
log/profiledirectory. - Handling: Place the extracted output in a directory other than
log/profile.
How to confirm whether data skew exists?
- In MergedProfile, compare the
min,avg, andmaxofInputRows/RowsProducedfor the same operator. - A
maxsignificantly larger thanavg, or aminof 0 with a very largemax, usually indicates data skew.
Glossary
| Term | One-sentence definition |
|---|---|
| Query Profile | A diagnostic structure that records the execution details of a single query |
| Fragment | An execution unit of a query plan that can be dispatched to a BE for execution |
| PlanNode | A logical operator node in the query plan |
| Pipeline | An execution pipeline composed of multiple non-blocking Operators |
| Operator | The smallest execution unit in the execution engine, split from a PlanNode |
| MergedProfile | A Profile aggregated across BEs and PipelineTasks |
| DetailProfile | A detailed Profile of each PipelineTask on each BE |
WaitForDependency | The time an operator waits for its dependencies to complete, often used to locate bottlenecks |