Workload Group: In-Process Resource Isolation Guide for Doris
Workload Group is a logical resource isolation mechanism inside the Doris process. It performs fine-grained partitioning of CPU, memory, and IO resources within the BE process so that different business workloads do not interfere with each other.
The following three types of resource isolation are currently supported:
- CPU resource: supports CPU soft limit (minimum guarantee) and CPU hard limit (maximum cap)
- Memory resource: supports memory soft limit and memory hard limit
- IO resource: supports limiting the IO bandwidth produced by reading local files and remote files
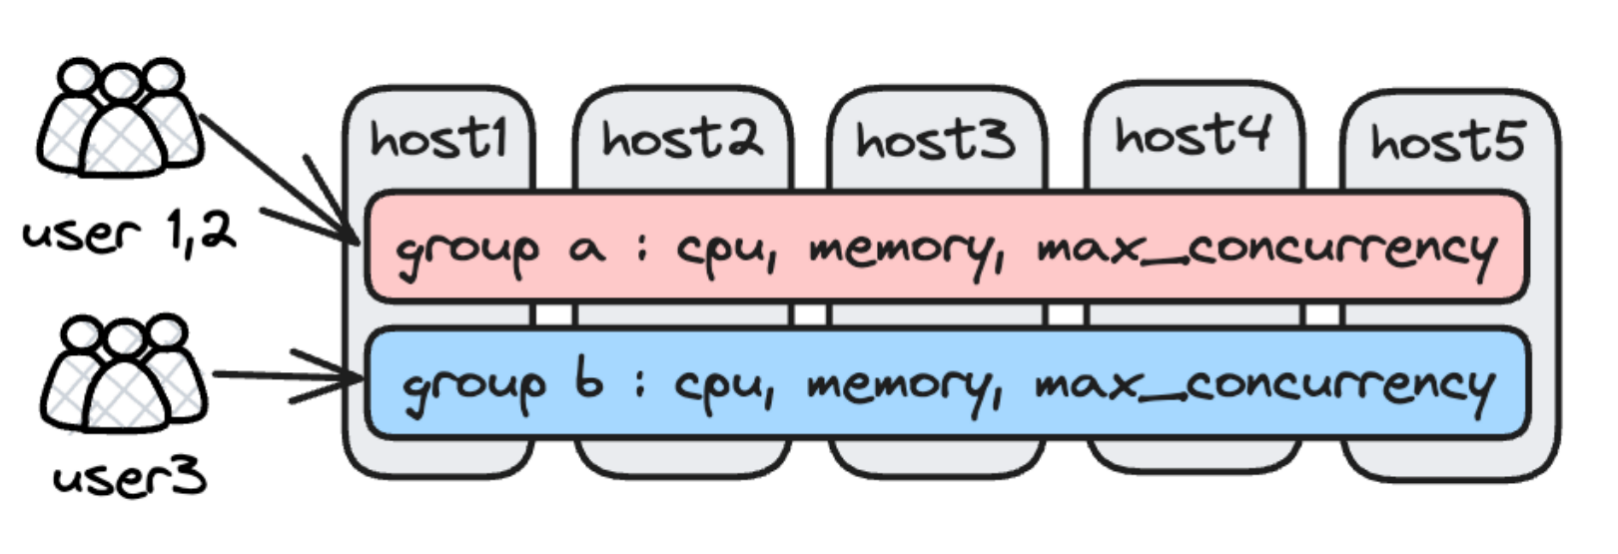
Workload Group provides in-process resource isolation, which is fundamentally different from inter-process isolation methods such as Resource Group and Compute Group:
- In-process isolation has shared components (such as shared caches and RPC thread pools) that cannot be isolated. High-load tasks may still affect the latency of low-load tasks, although the impact is significantly reduced compared to having no controls at all.
- Selection guidance: Choose Workload Group when some latency is tolerable and lower cost is preferred. Choose Resource Group or Compute Group when complete isolation is required and higher cost is acceptable, in which case high-priority workloads are assigned to dedicated BE nodes.
Version notes
| Version | Description |
|---|---|
| Doris 2.0 | Workload Group feature introduced, no dependency on CGroup |
| Doris 2.1 | Workload Group requires CGroup; the system automatically creates an undeletable normal group |
| Doris 4.0 | The CPU soft limit/hard limit concepts are unified as min_cpu_percent / max_cpu_percent, and the memory soft limit/hard limit concepts are unified as min_memory_percent / max_memory_percent |
Upgrade notes:
- 1.2 → 2.0: It is recommended to enable the Workload Group feature only after the full cluster upgrade is complete. Upgrading only some follower FE nodes may cause the un-upgraded nodes to lack metadata, resulting in query failures.
- 2.0 → 2.1: Configure the CGroup environment first, then upgrade to version 2.1.
Core properties
CPU resource parameters
| Parameter | Value range | Description |
|---|---|---|
MIN_CPU_PERCENT | [0%, 100%] | The minimum CPU bandwidth reserved for this Workload Group. When there is CPU contention, other groups cannot preempt this bandwidth; when resources are idle, the group may use more than this value. |
MAX_CPU_PERCENT | [0%, 100%] | The upper bound of CPU bandwidth for this Workload Group. Regardless of the current CPU utilization, the CPU usage of this group does not exceed this value. |
Constraints: the sum of MIN_CPU_PERCENT across all Workload Groups cannot exceed 100%, and MIN_CPU_PERCENT cannot be greater than MAX_CPU_PERCENT.
Scenario example: A company's sales department (CPU-intensive, high priority) and marketing department (CPU-intensive, low priority) share the same Doris instance. You can assign 40% min_cpu_percent to the sales Workload Group and configure 30% max_cpu_percent for the marketing Workload Group, ensuring that the sales business obtains stable CPU resources.
Memory resource parameters
| Parameter | Value range | Description |
|---|---|---|
MIN_MEMORY_PERCENT | [0%, 100%] | The minimum amount of memory reserved for this Workload Group. When memory is insufficient, the system allocates memory according to this value; if necessary, some queries are killed to release memory, ensuring that other groups have enough available memory. |
MAX_MEMORY_PERCENT | [0%, 100%] | The memory upper bound for this Workload Group. When the memory used by queries exceeds this value, spilling to disk is triggered or queries are killed. |
Constraints: the sum of MIN_MEMORY_PERCENT across all Workload Groups cannot exceed 100%, and MIN_MEMORY_PERCENT cannot be greater than MAX_MEMORY_PERCENT.
Other properties
| Property name | Data type | Default value | Value range | Description |
|---|---|---|---|---|
max_concurrency | Integer | 2147483647 | [0, 2147483647] | Maximum query concurrency, unlimited by default. When the number of running queries reaches the upper bound, new queries enter the queueing logic. |
max_queue_size | Integer | 0 | [0, 2147483647] | The length of the query queue. The default is 0, meaning no queueing; when the queue is full, new queries fail directly. |
queue_timeout | Integer | 0 | [0, 2147483647] | The maximum waiting time (in milliseconds) for a query in the queue. The default is 0, meaning no queueing; the query returns a failure immediately after entering the queue. |
scan_thread_num | Integer | -1 | [1, 2147483647] | The number of threads used for scan by the current Workload Group. When set to -1, the value of doris_scanner_thread_pool_thread_num in the BE configuration is used. |
max_remote_scan_thread_num | Integer | -1 | [1, 2147483647] | The maximum number of threads in the scan thread pool for reading external data sources. When set to -1, BE decides on its own (usually related to the number of cores). |
min_remote_scan_thread_num | Integer | -1 | [1, 2147483647] | The minimum number of threads in the scan thread pool for reading external data sources. When set to -1, BE decides on its own (usually related to the number of cores). |
read_bytes_per_second | Integer | -1 | [1, 9223372036854775807] | The maximum IO throughput (bytes/second) when reading Doris internal tables. The default is -1, meaning no limit. This value is bound to a folder rather than a disk, and the directory of spilled files is also subject to this constraint. |
remote_read_bytes_per_second | Integer | -1 | [1, 9223372036854775807] | The maximum IO throughput (bytes/second) when reading Doris external tables. The default is -1, meaning no limit. |
Configure Workload Group
Step 1: Configure the CGroup environment
The CPU management of Workload Group relies on the CGroup component. If you only need to manage memory and IO resources, you can skip this step.
1. Confirm the CGroup version
cat /proc/filesystems | grep cgroup
nodev	cgroup
nodev	cgroup2
nodev	cgroupfs
In the output, cgroup indicates CGroup V1 is installed, and cgroup2 indicates CGroup V2 is installed.
2. Confirm the currently effective version
# If this path exists, the currently effective version is CGroup V1
/sys/fs/cgroup/cpu/

# If this path exists, the currently effective version is CGroup V2
/sys/fs/cgroup/cgroup.controllers
3. Create a doris directory under the CGroup path
# CGroup V1: create under the cpu directory
mkdir /sys/fs/cgroup/cpu/doris

# CGroup V2: create under the cgroup directory
mkdir /sys/fs/cgroup/doris
4. Grant read/write/execute permissions to the BE process
# CGroup V1
chmod 770 /sys/fs/cgroup/cpu/doris
chown -R doris:doris /sys/fs/cgroup/cpu/doris

# CGroup V2
chmod 770 /sys/fs/cgroup/doris
chown -R doris:doris /sys/fs/cgroup/doris
5. Additional operations for CGroup V2 (skip for V1)
Modify the permissions of the root-directory cgroup.procs file so that processes can be moved between CGroup directories:
chmod a+w /sys/fs/cgroup/cgroup.procs
Confirm that the cpu controller is enabled for the doris directory. If doris/cgroup.controllers does not contain cpu, run the following command to enable it:
# After successful execution, a cpu.max file appears under the doris directory, and the output of cgroup.controllers includes cpu
# If it fails, the parent directory has not enabled the cpu controller either; enable it for the parent directory first
echo +cpu > ../cgroup.subtree_control
6. Modify the BE configuration to specify the CGroup path
# CGroup V1
doris_cgroup_cpu_path = /sys/fs/cgroup/cpu/doris

# CGroup V2
doris_cgroup_cpu_path = /sys/fs/cgroup/doris
7. Restart BE
After the restart, seeing add thread xxx to group in the be.INFO log indicates that the configuration is successful.
- It is recommended to deploy only one BE instance per machine. The current Workload Group feature does not support deploying multiple BEs on a single machine.
- After a machine reboot, the configuration under the CGroup path is cleared. For persistence, use systemd to set the creation and authorization operations as a system service, executed automatically on each reboot.
- When using CGroup inside a container, the container must have permissions to operate on the host.
Using Workload Group in containers
The CPU management of Workload Group is implemented based on CGroup. When using it in a container, start the container in privileged mode so that the Doris process has permission to read and write the host's CGroup files.
CPU resources inside a container are further partitioned on top of the container's available resources. For example, if the host has 64 cores, the container is allocated 8 cores, and the Workload Group is configured with a CPU hard limit of 50%, the actual number of usable cores is 4 (8 cores × 50%).
The memory management and IO management of Workload Group are implemented internally by Doris and do not depend on external components. There is no difference between using them in a container or on a physical machine. To use Doris on Kubernetes, it is recommended to deploy with Doris Operator, which abstracts away the underlying permission details.
Step 2: Create a Workload Group
CREATE WORKLOAD GROUP IF NOT EXISTS g1
PROPERTIES (
    "cpu_share" = "1024"
);
The CPU limit configured here is a soft limit. Starting from version 2.1, the system automatically creates a group named normal, which cannot be deleted.
All CREATE / ALTER / DROP WORKLOAD GROUP examples in this document omit the FOR <compute_group> clause, and they only work as-is in non-cloud (storage-compute coupled) mode, where they apply to the default resource group.
In cloud (storage-compute decoupled) mode, the FOR <compute_group> clause must be specified explicitly; otherwise the statement fails with: Must specify compute group via 'FOR <compute_group>' in cloud mode. See Bind Workload Group to Compute Group for details.
For the complete syntax, see: CREATE-WORKLOAD-GROUP
Step 3: Grant permissions to a user and bind the Workload Group
Check user permissions
Query the information_schema.workload_groups system table to return the Workload Groups that the current user is allowed to use:
SELECT name FROM information_schema.workload_groups;
+--------+
| name   |
+--------+
| normal |
| g1     |
+--------+
Grant permissions
If the user cannot see the target Workload Group, run the GRANT statement using an administrator account:
GRANT USAGE_PRIV ON WORKLOAD GROUP 'g1' TO 'user_1'@'%';
For more authorization operations, see: GRANT-TO
Binding methods
Two binding methods are supported. The session variable has higher priority than the user property:
| Binding method | Command | Description |
|---|---|---|
| user property (persistent) | SET PROPERTY 'default_workload_group' = 'g1'; | The default Workload Group used by the user, cannot be empty |
| session variable (temporary) | SET workload_group = 'g1'; | Only takes effect in the current session, empty by default |
Manage Workload Group
View Workload Group
Method 1: SHOW statement
SHOW WORKLOAD GROUPS;
Reference: SHOW-WORKLOAD-GROUPS
Method 2: System table query
SELECT * FROM information_schema.workload_groups WHERE name = 'g1';
+-------+------+-----------+--------------+--------------------------+-----------------+----------------+---------------+----------------+-----------------+----------------------------+----------------------------+----------------------+-----------------------+------+-----------------------+------------------------------+
| ID    | NAME | CPU_SHARE | MEMORY_LIMIT | ENABLE_MEMORY_OVERCOMMIT | MAX_CONCURRENCY | MAX_QUEUE_SIZE | QUEUE_TIMEOUT | CPU_HARD_LIMIT | SCAN_THREAD_NUM | MAX_REMOTE_SCAN_THREAD_NUM | MIN_REMOTE_SCAN_THREAD_NUM | MEMORY_LOW_WATERMARK | MEMORY_HIGH_WATERMARK | TAG  | READ_BYTES_PER_SECOND | REMOTE_READ_BYTES_PER_SECOND |
+-------+------+-----------+--------------+--------------------------+-----------------+----------------+---------------+----------------+-----------------+----------------------------+----------------------------+----------------------+-----------------------+------+-----------------------+------------------------------+
| 14009 | g1   |      1024 | -1           | true                     |      2147483647 |              0 |             0 | -1             |              -1 |                         -1 |                         -1 | 50%                  | 80%                   |      |                    -1 |                           -1 |
+-------+------+-----------+--------------+--------------------------+-----------------+----------------+---------------+----------------+-----------------+----------------------------+----------------------------+----------------------+-----------------------+------+-----------------------+------------------------------+
1 row in set (0.05 sec)
Modify Workload Group
ALTER WORKLOAD GROUP g1 PROPERTIES('min_cpu_percent' = '2048');

SELECT cpu_share FROM information_schema.workload_groups WHERE name = 'g1';
+-----------+
| cpu_share |
+-----------+
|      2048 |
+-----------+
1 row in set (0.02 sec)
Reference: ALTER-WORKLOAD-GROUP
Drop Workload Group
DROP WORKLOAD GROUP g1;
Reference: DROP-WORKLOAD-GROUP
Effect verification
The following tests were all conducted in an environment with 1 FE + 1 BE (96 cores, 375 GB memory) using the ClickBench dataset.
Verify the memory hard limit effect
Adhoc queries have uncertain inputs and uncertain memory usage, with a risk that a few queries fill up memory. Assigning such workloads to a separate group and configuring a memory hard limit prevents sudden large queries from causing OOM or leaving other queries without available memory. When the memory usage of this Workload Group exceeds the hard limit, memory is released by killing queries.
Without the memory hard limit enabled
Use jmeter to issue q29 with a concurrency of 3. The ps command shows process memory at about 7.7 GB:
[ ~]$ ps -eo pid,comm,%mem,rss | grep 1407481
1407481 doris_be         2.0 7896792
[ ~]$ ps -eo pid,comm,%mem,rss | grep 1407481
1407481 doris_be         2.0 7929692
[ ~]$ ps -eo pid,comm,%mem,rss | grep 1407481
1407481 doris_be         2.0 8101232
Querying the system table shows the Workload Group memory usage is about 5.8 GB. (Process memory is usually much larger than the usage of a single Workload Group, because metadata, Cache, and so on are not counted in the Workload Group statistics.)
SELECT MEMORY_USAGE_BYTES / 1024 / 1024 AS wg_mem_used_mb FROM workload_group_resource_usage WHERE workload_group_id = 11201;
+-------------------+
| wg_mem_used_mb    |
+-------------------+
| 5797.524360656738 |
+-------------------+
1 row in set (0.01 sec)

SELECT MEMORY_USAGE_BYTES / 1024 / 1024 AS wg_mem_used_mb FROM workload_group_resource_usage WHERE workload_group_id = 11201;
+-------------------+
| wg_mem_used_mb    |
+-------------------+
| 5840.246627807617 |
+-------------------+
1 row in set (0.02 sec)

SELECT MEMORY_USAGE_BYTES / 1024 / 1024 AS wg_mem_used_mb FROM workload_group_resource_usage WHERE workload_group_id = 11201;
+-------------------+
| wg_mem_used_mb    |
+-------------------+
| 5878.394917488098 |
+-------------------+
1 row in set (0.02 sec)
With the memory hard limit enabled
-
Set the memory limit to 1%:
ALTER WORKLOAD GROUP g2 PROPERTIES('memory_limit' = '1%'); -
Run the same test. The system table shows the memory usage drops to about 1.5 GB:
SELECT MEMORY_USAGE_BYTES / 1024 / 1024 AS wg_mem_used_mb FROM workload_group_resource_usage WHERE workload_group_id = 11201;
+--------------------+
| wg_mem_used_mb     |
+--------------------+
| 1575.3877239227295 |
+--------------------+
1 row in set (0.02 sec)

SELECT MEMORY_USAGE_BYTES / 1024 / 1024 AS wg_mem_used_mb FROM workload_group_resource_usage WHERE workload_group_id = 11201;
+------------------+
| wg_mem_used_mb   |
+------------------+
| 1668.77405834198 |
+------------------+
1 row in set (0.01 sec)

SELECT MEMORY_USAGE_BYTES / 1024 / 1024 AS wg_mem_used_mb FROM workload_group_resource_usage WHERE workload_group_id = 11201;
+--------------------+
| wg_mem_used_mb     |
+--------------------+
| 499.96760272979736 |
+--------------------+
1 row in set (0.01 sec) -
The ps command shows the process memory drops to about 3.8 GB:
[ ~]$ ps -eo pid,comm,%mem,rss | grep 1407481
1407481 doris_be         1.0 4071364
[ ~]$ ps -eo pid,comm,%mem,rss | grep 1407481
1407481 doris_be         1.0 4059012
[ ~]$ ps -eo pid,comm,%mem,rss | grep 1407481
1407481 doris_be 1.0 4057068 -
The client observes query failures caused by insufficient memory:
1724074250162,14126,1c_sql,HY000 1105,"java.sql.SQLException: errCode = 2, detailMessage = (127.0.0.1)[MEM_LIMIT_EXCEEDED]GC wg for hard limit, wg id:11201, name:g2, used:1.71 GB, limit:1.69 GB, backend:10.16.10.8. cancel top memory used tracker <Query#Id=4a0689936c444ac8-a0d01a50b944f6e7> consumption 1.71 GB. details:process memory used 3.01 GB exceed soft limit 304.41 GB or sys available memory 101.16 GB less than warning water mark 12.80 GB., Execute again after enough memory, details see be.INFO.",concurrency 1-3,text,false,,444,0,3,3,null,0,0,0
The memory hard limit releases memory by killing queries, and in extreme cases this may cause all queries to fail. In production, it is recommended to use the memory hard limit together with the query queueing feature, controlling memory usage while still ensuring query success rate.
Verify the CPU hard limit effect
The typical workloads of Doris fall into three categories, with the following recommended configuration strategies:
| Workload type | Characteristics | Recommended configuration |
|---|---|---|
| Core reporting queries | CPU-intensive, high availability requirements | CPU soft limit, configured with higher priority |
| Adhoc queries | Random SQL, unknown resource usage | CPU hard limit, configured with a low value |
| ETL queries | Fixed SQL, occasional resource spikes | CPU hard limit, to prevent impact on online business |
When the CPU of BE is saturated, the overall cluster availability noticeably degrades (including reduced available CPU for internal components such as RPC components). Therefore, CPU hard limits are recommended in production environments, rather than soft limits.
Test environment: 1 FE, 1 BE, 96-core machine; dataset is ClickBench, test SQL is q29.
-
Use jmeter to issue 3 concurrent queries, pushing the BE process CPU usage to a high level. (The top command shows CPU usage at 7600%, that is, about 76 cores.)
-
Change the CPU hard limit of the Workload Group to 10%:
ALTER WORKLOAD GROUP g2 PROPERTIES('max_cpu_percent' = '10%'); -
Rerun the load test. The process can only use about 9 to 10 cores, accounting for 10% of the total number of cores:

-
Confirm via the system table that CPU usage is controlled at around 10%:
SELECT CPU_USAGE_PERCENT FROM workload_group_resource_usage WHERE WORKLOAD_GROUP_ID = 11201;
+-------------------+
| CPU_USAGE_PERCENT |
+-------------------+
|              9.57 |
+-------------------+
1 row in set (0.02 sec)
- It is recommended that the cumulative CPU values across all Workload Groups not be set to exactly 100%, leaving a portion for other components to ensure availability in low-latency scenarios. If latency is not a concern and maximum resource utilization is desired, the cumulative value can be set to 100%.
- The interval at which FE synchronizes Workload Group metadata to BE is 30 seconds. Changes may take up to 30 seconds to take effect.
Using a query workload to test the CPU hard limit gives more accurate results. High-throughput ingestion may trigger Compaction, causing the observed value to exceed the Workload Group configured value, because the Compaction workload is not currently managed by Workload Group.
Verify the local IO hard limit effect
When an OLAP system runs ETL or large Adhoc queries, scanning multiple disk files in parallel with multiple threads produces large disk IO, which affects other online queries. By configuring an IO bandwidth cap on offline ETL tasks, you can reduce the impact on online reporting and analytics.
Test environment: 1 FE, 1 BE, 96-core machine; dataset is ClickBench.
Without the IO hard limit enabled
-
Disable the cache:
-- Clear the operating system cache
sync; echo 3 > /proc/sys/vm/drop_caches

-- Disable the BE page cache
disable_storage_page_cache = true -
Perform a full table scan on the ClickBench table (single concurrency):
SET dry_run_query = true;
SELECT * FROM hits.hits; -
Querying the system table shows the maximum throughput is about 3 GB/s:
SELECT LOCAL_SCAN_BYTES_PER_SECOND / 1024 / 1024 AS mb_per_sec FROM workload_group_resource_usage WHERE WORKLOAD_GROUP_ID = 11201;
+--------------------+
| mb_per_sec         |
+--------------------+
| 1146.6208400726318 |
+--------------------+
1 row in set (0.03 sec)

SELECT LOCAL_SCAN_BYTES_PER_SECOND / 1024 / 1024 AS mb_per_sec FROM workload_group_resource_usage WHERE WORKLOAD_GROUP_ID = 11201;
+--------------------+
| mb_per_sec         |
+--------------------+
| 3496.2762966156006 |
+--------------------+
1 row in set (0.04 sec)

SELECT LOCAL_SCAN_BYTES_PER_SECOND / 1024 / 1024 AS mb_per_sec FROM workload_group_resource_usage WHERE WORKLOAD_GROUP_ID = 11201;
+--------------------+
| mb_per_sec         |
+--------------------+
| 2192.7690029144287 |
+--------------------+
1 row in set (0.02 sec) -
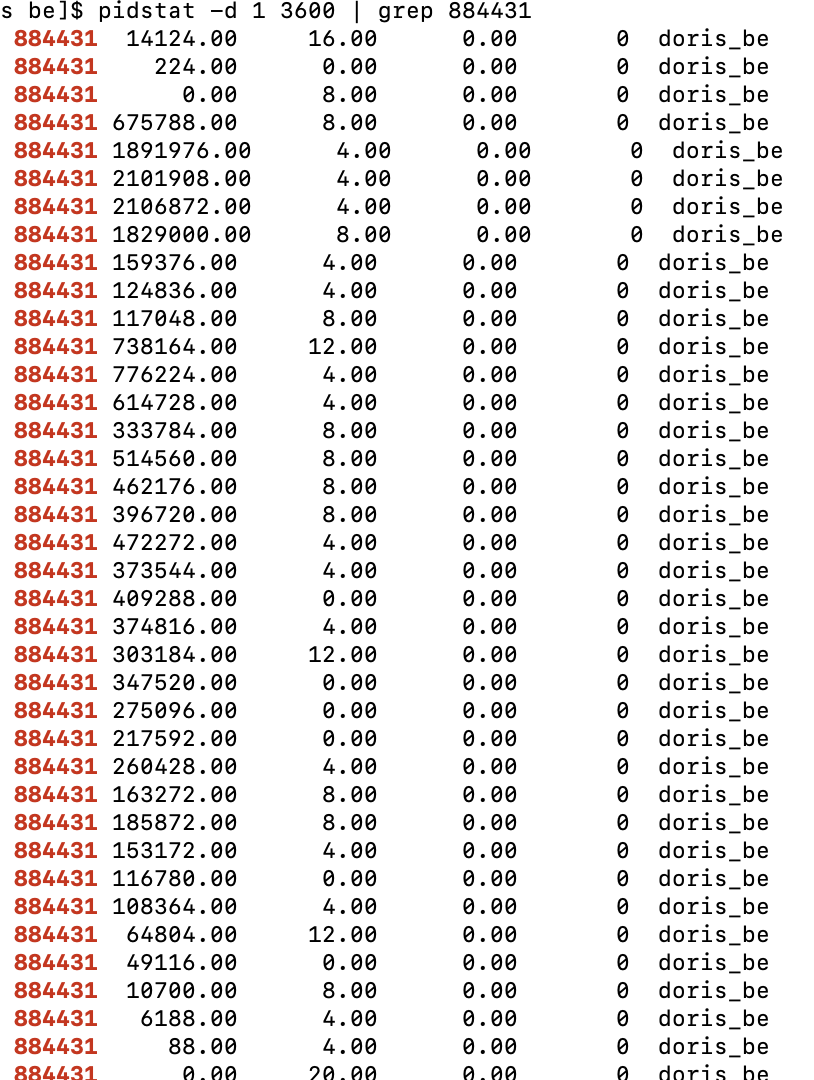
Use the pidstat command to view process IO (the first column is the process ID, the second column is the read IO throughput in KB/s). Without limits, the maximum throughput is about 2 GB/s:
With the IO hard limit enabled
-
Disable the cache:
-- Clear the operating system cache
sync; echo 3 > /proc/sys/vm/drop_caches

-- Disable the BE page cache
disable_storage_page_cache = true -
Limit the maximum read throughput to 100 MB/s:
ALTER WORKLOAD GROUP g2 PROPERTIES('read_bytes_per_second' = '104857600'); -
The system table shows the maximum IO throughput is controlled at about 98 MB/s:
SELECT LOCAL_SCAN_BYTES_PER_SECOND / 1024 / 1024 AS mb_per_sec FROM workload_group_resource_usage WHERE WORKLOAD_GROUP_ID = 11201;
+--------------------+
| mb_per_sec         |
+--------------------+
| 97.94296646118164  |
+--------------------+
1 row in set (0.03 sec)

SELECT LOCAL_SCAN_BYTES_PER_SECOND / 1024 / 1024 AS mb_per_sec FROM workload_group_resource_usage WHERE WORKLOAD_GROUP_ID = 11201;
+--------------------+
| mb_per_sec         |
+--------------------+
| 98.37584781646729  |
+--------------------+
1 row in set (0.04 sec)

SELECT LOCAL_SCAN_BYTES_PER_SECOND / 1024 / 1024 AS mb_per_sec FROM workload_group_resource_usage WHERE WORKLOAD_GROUP_ID = 11201;
+--------------------+
| mb_per_sec         |
+--------------------+
| 98.06641292572021  |
+--------------------+
1 row in set (0.02 sec) -
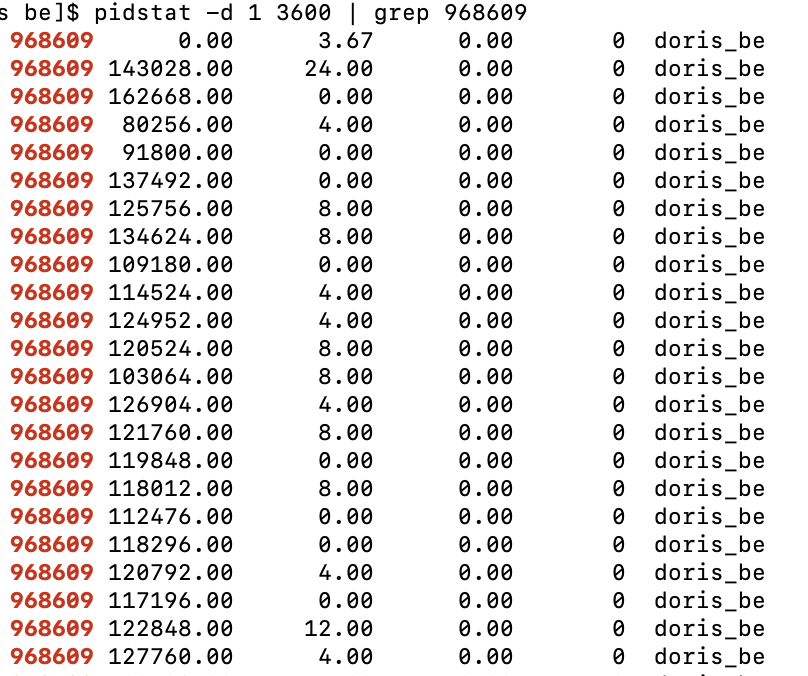
Use the pidstat tool to view the maximum process IO throughput, which is about 131 MB/s:
LOCAL_SCAN_BYTES_PER_SECONDin the system table is a process-level aggregated value. If 12 file paths are configured, this value is the maximum across the IO of the 12 paths. To see the IO throughput for each file path in detail, check the Grafana monitoring.- Due to the existence of the operating system and Doris Page Cache, the IO observed through Linux IO monitoring scripts is usually smaller than the value in the system table.
Verify the remote IO hard limit effect
BrokerLoad and S3Load are common methods for large-batch data ingestion. When Doris uses multiple threads to pull data in parallel from HDFS/S3, it puts heavy pressure on external storage, affecting the stability of other jobs. By configuring a remote IO bandwidth cap, you can reduce the impact of ingestion on other business.
Test environment: 1 FE + 1 BE deployed on the same machine, 16 cores, 64 GB memory; the test data is 10 million rows from the ClickBench dataset, uploaded to S3.
View the Schema information:
DESC FUNCTION s3 (
    "URI" = "https://bucketname/1kw.tsv",
    "s3.access_key" = "ak",
    "s3.secret_key" = "sk",
    "format" = "csv",
    "use_path_style" = "true"
);
Without limiting remote read IO
-
Issue a single-concurrency full table scan:
-- Set to scan data only, do not return results
SET dry_run_query = true;

SELECT * FROM s3(
    "URI" = "https://bucketname/1kw.tsv",
    "s3.access_key" = "ak",
    "s3.secret_key" = "sk",
    "format" = "csv",
    "use_path_style" = "true"
); -
The system table shows the remote IO throughput is about 837 MB/s. (The actual throughput is affected by the bandwidth between BE and the external storage.)
SELECT CAST(REMOTE_SCAN_BYTES_PER_SECOND / 1024 / 1024 AS INT) AS read_mb FROM information_schema.workload_group_resource_usage;
+---------+
| read_mb |
+---------+
|     837 |
+---------+
1 row in set (0.104 sec)

SELECT CAST(REMOTE_SCAN_BYTES_PER_SECOND / 1024 / 1024 AS INT) AS read_mb FROM information_schema.workload_group_resource_usage;
+---------+
| read_mb |
+---------+
|     867 |
+---------+
1 row in set (0.070 sec)

SELECT CAST(REMOTE_SCAN_BYTES_PER_SECOND / 1024 / 1024 AS INT) AS read_mb FROM information_schema.workload_group_resource_usage;
+---------+
| read_mb |
+---------+
|     867 |
+---------+
1 row in set (0.186 sec) -
Use
sar -n DEV 1 3600to view machine network bandwidth (the first column is the number of bytes received per second, in KB/s). The machine-level maximum network bandwidth is about 1033 MB/s: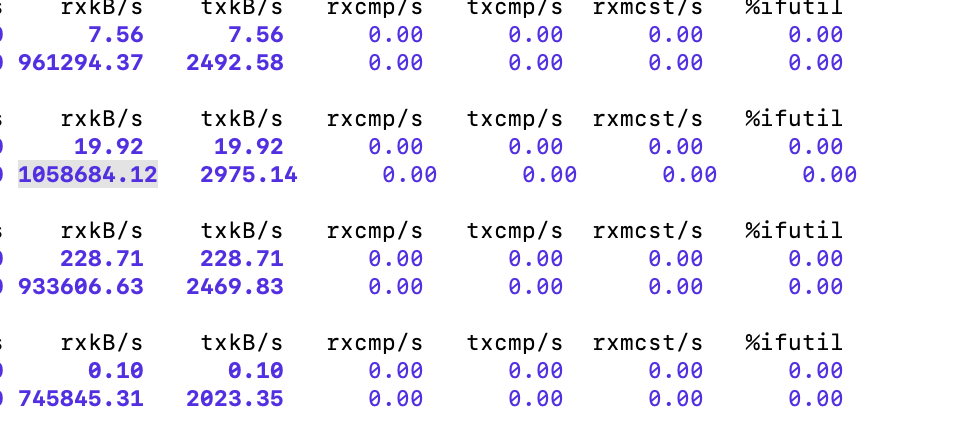
After limiting remote read IO
-
Limit the remote read IO throughput to 100 MB/s:
ALTER WORKLOAD GROUP normal PROPERTIES('remote_read_bytes_per_second' = '104857600'); -
Issue a single-concurrency full table scan:
SET dry_run_query = true;

SELECT * FROM s3(
    "URI" = "https://bucketname/1kw.tsv",
    "s3.access_key" = "ak",
    "s3.secret_key" = "sk",
    "format" = "csv",
    "use_path_style" = "true"
); -
The system table shows the remote read IO throughput is controlled at around 100 MB/s. (It fluctuates due to algorithm design; brief peaks are normal.)
SELECT CAST(REMOTE_SCAN_BYTES_PER_SECOND / 1024 / 1024 AS INT) AS read_mb FROM information_schema.workload_group_resource_usage;
+---------+
| read_mb |
+---------+
|      56 |
+---------+
1 row in set (0.010 sec)

SELECT CAST(REMOTE_SCAN_BYTES_PER_SECOND / 1024 / 1024 AS INT) AS read_mb FROM information_schema.workload_group_resource_usage;
+---------+
| read_mb |
+---------+
|     131 |
+---------+
1 row in set (0.009 sec)

SELECT CAST(REMOTE_SCAN_BYTES_PER_SECOND / 1024 / 1024 AS INT) AS read_mb FROM information_schema.workload_group_resource_usage;
+---------+
| read_mb |
+---------+
|     111 |
+---------+
1 row in set (0.009 sec) -
Use
sar -n DEV 1 3600to view the NIC received traffic (the first column is the amount of data received per second). The maximum value becomes about 207 MB/s, and the IO limit has taken effect. (The sar command shows machine-level traffic, which is usually larger than the Doris statistical value.)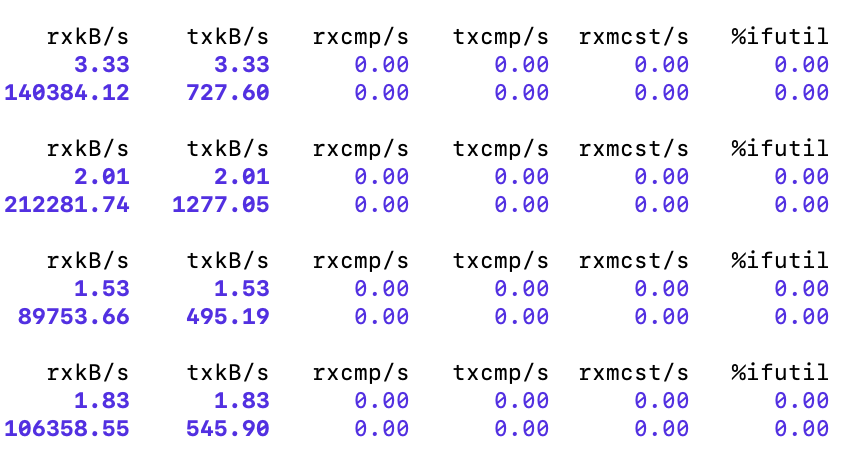
FAQ
Q: The CPU hard limit is configured but does not take effect
- Environment initialization failure: Check whether the
/sys/fs/cgroup/cpu/doris/query/1/tasksfile under the CGroup V1 path contains the thread IDs of the corresponding Workload Group (usetop -H -b -n 1 -p pidto obtain them), and whether the value ofcpu.cfs_quota_usis -1 (a value of -1 means the hard limit is not in effect). - The BE process CPU exceeds the configured value: Workload Group manages query threads and the memtable flush threads for ingestion. Other components inside BE (such as Compaction) also consume CPU, so process CPU usage is usually higher than the Workload Group configured value. You can create a test Workload Group and check the Workload Group's own CPU usage through
information_schema.workload_group_resource_usage(supported from version 2.1.6). - The
cpu_resource_limitparameter is configured: RunSHOW PROPERTY FOR jack LIKE 'cpu_resource_limit'andSHOW VARIABLES LIKE 'cpu_resource_limit'to confirm whether this parameter is set (the default value -1 indicates not set). When this parameter is configured, queries use an independent thread pool and are not managed by Workload Group. Migration recommendation: in batches, set the user'snum_scanner_threadsto 1, specify a Workload Group, then changecpu_resource_limitto -1, observe until stable, and continue migration.
Q: The default Workload Group count is limited to 15
Workload Group divides single-machine resources. Too many groups result in too few resources per group. If your business genuinely needs more groups, consider splitting the cluster into multiple BE sets and creating different Workload Groups for each set; you can also modify the FE configuration workload_group_max_num to temporarily bypass this limit.
Q: After configuring many Workload Groups, the error "Resource temporarily unavailable" appears
Each Workload Group is an independent set of thread pools. When too many are created, the number of threads the BE process tries to start may exceed the upper limit allowed by the operating system. Solution: modify the operating system configuration to allow the BE process to create more threads.