OpenTelemetry
OpenTelemetry (OTel for short) is a vendor-neutral open-source observability framework used to monitor, generate, collect, and export observability data such as logs, traces, and metrics. OpenTelemetry defines a set of observability standards and protocols that have been widely adopted by the observability community and vendors, gradually becoming the de facto standard in the observability field.
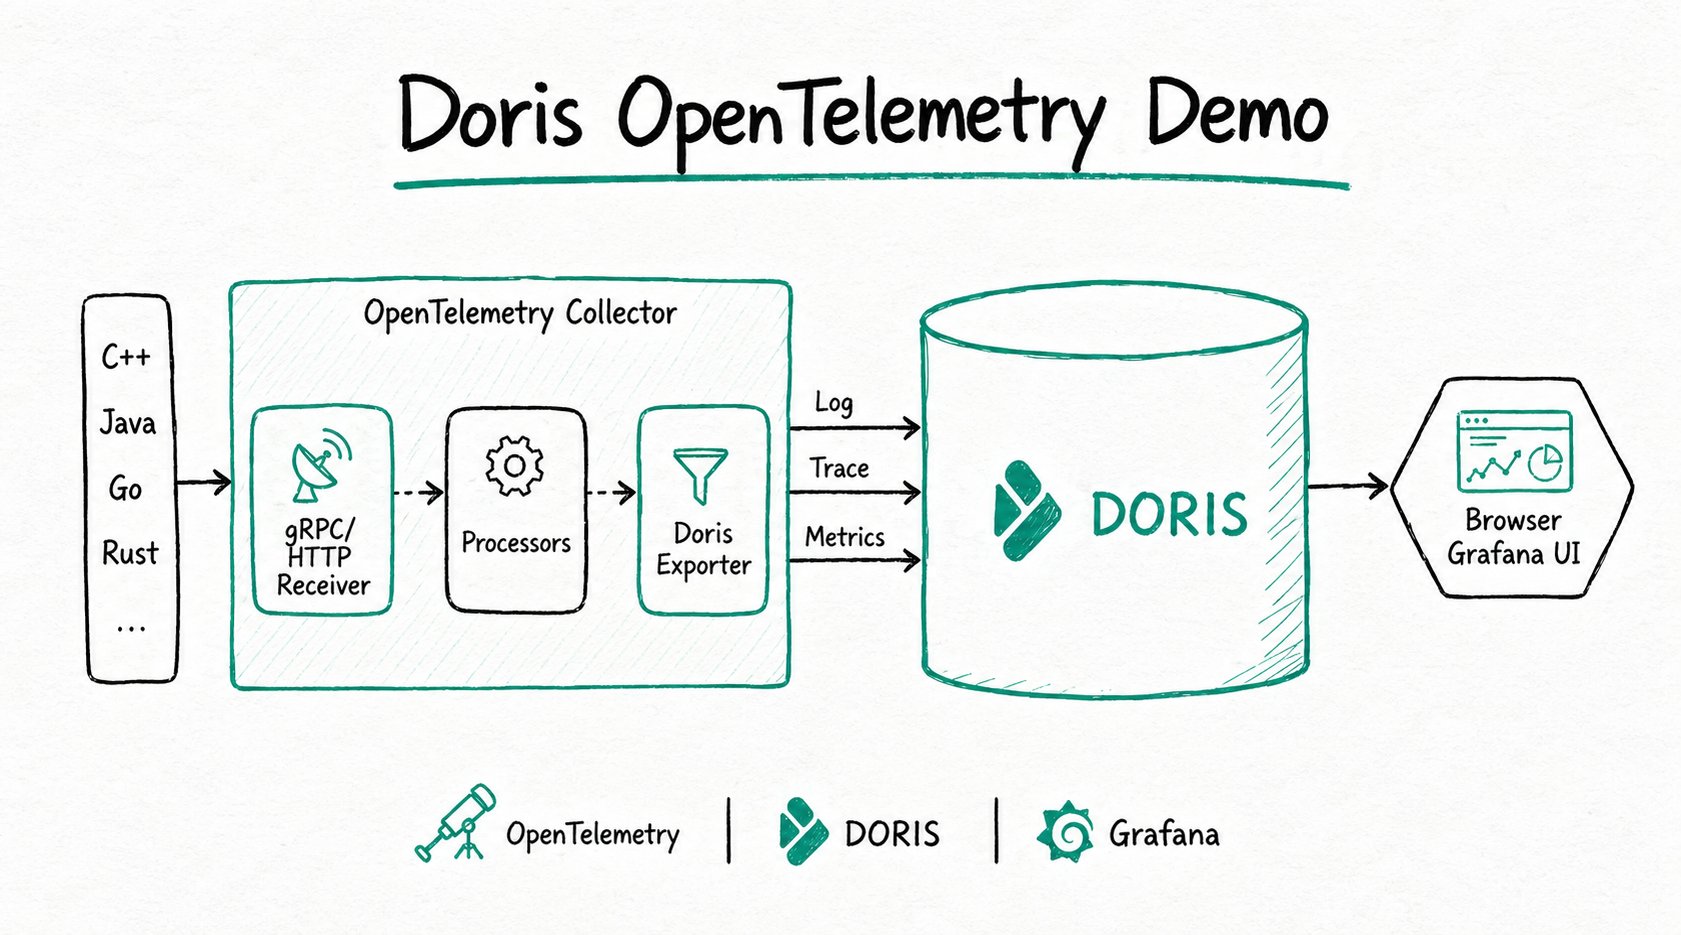
OpenTelemetry provides frameworks and observability data collection SDKs that allow applications and systems to be monitored across different programming languages, infrastructures, and runtime environments. Doris can serve as the storage backend for OpenTelemetry, providing high-performance, low-cost, and unified observability data storage and analysis capabilities. The overall architecture is as follows:
Applicable scenarios and integration process
You can choose the corresponding integration approach based on the data type:
| User scenario | Recommended configuration | Reference section |
|---|---|---|
| Collect general TEXT logs such as Doris FE logs and handle multi-line logs such as Java stacktraces | Use the filelog receiver, multiline, and regex_parser to merge multi-line logs and parse them before writing into Doris | Collect Doris FE TEXT logs |
| Collect structured logs with one JSON object per line | Use the filelog receiver and json_parser to parse JSON line logs and write them into Doris | Collect GitHub Events JSON logs |
| Collect application trace data | Use the otlp receiver to receive data reported by the OpenTelemetry Java Agent, then write it into Doris through the Doris Exporter | Collect application trace data |
| Configure Doris write target, automatic table creation, partition retention, and Stream Load parameters | Configure parameters such as endpoint, database, table.*, create_schema, and headers in the Doris Exporter | Configure Doris Exporter |
The basic process for integrating with Doris using the OpenTelemetry Collector Doris Exporter is as follows:
- Download and extract OpenTelemetry Collector Contrib.
- Configure the Doris Exporter, including the Doris FE address, account, target database and table, and Stream Load parameters.
- Configure the receiver, processor, and pipeline based on the data type.
- Start the Collector and write log, trace, or metrics data into Doris.
- Observe the import results through Stream Load response logs and write speed logs.
Install OpenTelemetry Collector Contrib
Download the OpenTelemetry Collector Contrib installation package from the OpenTelemetry official Release page. The Contrib version includes the Doris Exporter, for example:
wget https://github.com/open-telemetry/opentelemetry-collector-releases/releases/download/v0.132.2/otelcol-contrib_0.132.2_linux_amd64.tar.gz
After downloading, extract the installation package to obtain the otelcol-contrib executable file.
Configure Doris Exporter
The OpenTelemetry Collector Doris Exporter writes data through the Doris Stream Load HTTP interface. The core configuration items are as follows:
| Configuration item | Default value | Description |
|---|---|---|
endpoint | None | Doris FE HTTP address, in the format host:port, for example 127.0.0.1:8030. |
mysql_endpoint | None | Doris FE MySQL address, in the format host:port, for example 127.0.0.1:9030. |
username | None | Doris username. The user must have write permission on the corresponding database and table. |
password | None | Password of the Doris user. |
database | None | Name of the Doris database to write to. |
table.logs | otel_logs | Doris table name to which logs data is written. |
table.traces | otel_traces | Doris table name to which traces data is written. |
table.metrics | otel_metrics | Doris table name to which metrics data is written. |
create_schema | true | Whether to automatically create the Doris database and table. |
history_days | 0 | Number of days to retain historical data in the automatically created Doris table. 0 means retain permanently. |
create_history_days | 0 | Number of initial partition days for the automatically created Doris table. 0 means do not create partitions. |
label_prefix | open_telemetry | Doris Stream Load Label prefix. The final generated Label format is {label_prefix}_{db}_{table}_{yyyymmdd_hhmmss}_{uuid}. |
headers | None | Headers parameter of Doris Stream Load. The syntax format is a YAML map. |
log_progress_interval | 10 | Time interval, in seconds, for outputting write speed in the log. Set to 0 to disable this log. |
For more configuration, refer to the OpenTelemetry Collector Contrib Doris Exporter documentation.
Collect Doris FE TEXT logs
This scenario uses Doris FE logs as an example to show how to collect TEXT logs and write them into Doris.
Step 1: Prepare the log file
Doris FE log files are usually located at fe/log/fe.log under the Doris installation directory. FE logs are typical Java program logs that contain fields such as timestamp, log level, thread name, code location, and log content. The logs include both regular logs and exception logs with stacktraces. Because a stacktrace spans multiple lines, the main log and its corresponding stacktrace need to be merged into a single log entry during collection.
2024-07-08 21:18:01,432 INFO (Statistics Job Appender|61) [StatisticsJobAppender.runAfterCatalogReady():70] Stats table not available, skip
2024-07-08 21:18:53,710 WARN (STATS_FETCH-0|208) [StmtExecutor.executeInternalQuery():3332] Failed to run internal SQL: OriginStatement{originStmt='SELECT * FROM __internal_schema.column_statistics WHERE part_id is NULL  ORDER BY update_time DESC LIMIT 500000', idx=0}
org.apache.doris.common.UserException: errCode = 2, detailMessage = tablet 10031 has no queryable replicas. err: replica 10032's backend 10008 does not exist or not alive
        at org.apache.doris.planner.OlapScanNode.addScanRangeLocations(OlapScanNode.java:931) ~[doris-fe.jar:1.2-SNAPSHOT]
        at org.apache.doris.planner.OlapScanNode.computeTabletInfo(OlapScanNode.java:1197) ~[doris-fe.jar:1.2-SNAPSHOT]
Step 2: Write the OpenTelemetry configuration
The log collection configuration file opentelemetry_java_log.yml mainly contains three parts:
| Configuration part | Function |
|---|---|
receivers | Read raw data. |
processors | Transform and batch process data. |
exporters | Output data to Doris. |
# 1. receivers are responsible for reading raw data.
# filelog is a local receiver that can read log files from the local file system.
# multiline appends lines that do not start with a timestamp to the previous line, used to merge stacktraces with the main log.
receivers:
  filelog:
    include:
      - /path/to/fe.log
    start_at: beginning
    multiline:
      line_start_pattern: '^\d{4}-\d{2}-\d{2} \d{2}:\d{2}:\d{2},\d{3}' # Match the timestamp as the start of a new log
    operators:
      - type: regex_parser
        regex: '^(?P<time>\d{4}-\d{2}-\d{2} \d{2}:\d{2}:\d{2},\d{3}) (?P<severity>INFO|WARN|ERROR) (?P<message>.*)'
        timestamp:
          parse_from: attributes.time
          layout: '%Y-%m-%d %H:%M:%S,%f'
        severity:
          parse_from: attributes.severity
          trace: TRACE
          debug: DEBUG
          info: INFO
          warn: WARN
          error: ERROR
          fatal: FATAL

# 2. processors are responsible for data transformation.
# The batch processor accumulates data into batches before sending.
processors:
  batch:
    send_batch_size: 100000 # Number of data entries per batch. It is recommended that the batch data size be between 100M and 1G.
    timeout: 10s

# 3. exporters are responsible for outputting data.
# The doris exporter writes to Doris through the Stream Load HTTP interface.
# The default Stream Load data format is JSON. Stream Load parses JSON fields and writes them to the corresponding fields in the Doris table.
exporters:
  doris:
    endpoint: http://localhost:8030 # FE HTTP address
    mysql_endpoint: localhost:9030 # FE MySQL address
    database: doris_db_name
    username: doris_username
    password: doris_password
    table:
      logs: otel_logs
    create_schema: true # Whether to automatically create the schema. If set to false, the table must be created manually.
    history_days: 10
    create_history_days: 10
    timezone: Asia/Shanghai
    timeout: 60s # HTTP Stream Load client timeout
    log_response: true
    sending_queue:
      enabled: true
      num_consumers: 20
      queue_size: 1000
    retry_on_failure:
      enabled: true
      initial_interval: 5s
      max_interval: 30s
    headers:
      load_to_single_tablet: "true"

service:
  pipelines:
    logs:
      receivers: [filelog]
      processors: [batch]
      exporters: [doris]
Step 3: Run the OpenTelemetry Collector
./otelcol-contrib --config config/opentelemetry_java_log.yml
Step 4: View the write results
When log_response is true, the log outputs the request parameters and response result of each Stream Load:
2025-08-18T00:33:22.543+0800    info    dorisexporter@v0.132.0/exporter_logs.go:181    log response:
{
    "TxnId": 52,
    "Label": "open_telemetry_otel_otel_logs_20250818003321_498bb8ec-040c-4982-9eb4-452b15129782",
    "Comment": "",
    "TwoPhaseCommit": "false",
    "Status": "Success",
    "Message": "OK",
    "NumberTotalRows": 50355,
    "NumberLoadedRows": 50355,
    "NumberFilteredRows": 0,
    "NumberUnselectedRows": 0,
    "LoadBytes": 31130235,
    "LoadTimeMs": 680,
    "BeginTxnTimeMs": 0,
    "StreamLoadPutTimeMs": 3,
    "ReadDataTimeMs": 106,
    "WriteDataTimeMs": 653,
    "ReceiveDataTimeMs": 11,
    "CommitAndPublishTimeMs": 23
}
By default, write speed information is output every 10 seconds, including the data volume since startup (MB and ROWS), the total speed (MB/s and R/s), and the speed over the last 10 seconds:
2025-08-18T00:05:00.017+0800 info dorisexporter@v0.132.0/progress_reporter.go:63 [LOG] total 11 MB 18978 ROWS, total speed 0 MB/s 632 R/s, last 10 seconds speed 1 MB/s 1897 R/s
Collect GitHub Events JSON logs
This scenario uses GitHub Events Archive data as an example to show how to collect JSON logs and write them into Doris.
Step 1: Prepare the JSON data
GitHub Events Archive is archive data of GitHub user action events in JSON format, which can be downloaded from https://www.gharchive.org/. The following example downloads the data for 15:00 on January 1, 2024:
wget https://data.gharchive.org/2024-01-01-15.json.gz
The following is a sample data record. The actual data is one JSON object per line; it is formatted here for readability.
{
  "id": "37066529221",
  "type": "PushEvent",
  "actor": {
    "id": 46139131,
    "login": "Bard89",
    "display_login": "Bard89",
    "gravatar_id": "",
    "url": "https://api.github.com/users/Bard89",
    "avatar_url": "https://avatars.githubusercontent.com/u/46139131?"
  },
  "repo": {
    "id": 780125623,
    "name": "Bard89/talk-to-me",
    "url": "https://api.github.com/repos/Bard89/talk-to-me"
  },
  "payload": {
    "repository_id": 780125623,
    "push_id": 17799451992,
    "size": 1,
    "distinct_size": 1,
    "ref": "refs/heads/add_mvcs",
    "head": "f03baa2de66f88f5f1754ce3fa30972667f87e81",
    "before": "85e6544ede4ae3f132fe2f5f1ce0ce35a3169d21"
  },
  "public": true,
  "created_at": "2024-04-01T23:00:00Z"
}
Step 2: Write the OpenTelemetry configuration
Unlike TEXT log collection, JSON log collection uses json_parser in the filelog receiver. json_parser parses each line of text as JSON, and the parsed fields are used in subsequent processing.
receivers:
  filelog:
    include:
      - /path/to/2024-01-01-15.json
    start_at: beginning
    operators:
      - type: json_parser
        timestamp:
          parse_from: attributes.created_at
          layout: '%Y-%m-%dT%H:%M:%SZ'

processors:
  batch:
    send_batch_size: 100000 # Number of data entries per batch. It is recommended that the batch data size be between 100M and 1G.
    timeout: 10s

exporters:
  doris:
    endpoint: http://localhost:8030 # FE HTTP address
    mysql_endpoint: localhost:9030 # FE MySQL address
    database: doris_db_name
    username: doris_username
    password: doris_password
    table:
      logs: otel_logs
    create_schema: true # Whether to automatically create the schema. If set to false, the table must be created manually.
    history_days: 10
    create_history_days: 10
    timezone: Asia/Shanghai
    timeout: 60s # HTTP Stream Load client timeout
    log_response: true
    sending_queue:
      enabled: true
      num_consumers: 20
      queue_size: 1000
    retry_on_failure:
      enabled: true
      initial_interval: 5s
      max_interval: 30s
    headers:
      load_to_single_tablet: "true"

service:
  pipelines:
    logs:
      receivers: [filelog]
      processors: [batch]
      exporters: [doris]
Step 3: Run the OpenTelemetry Collector
./otelcol-contrib --config config/opentelemetry_json_log.yml
Collect application trace data
This scenario shows how to receive trace data reported from the application side through the OTLP protocol and write the traces into Doris.
Step 1: Write the OpenTelemetry configuration
Create the otel_trace.yaml configuration file:
receivers:
  otlp: # OTLP protocol, receives data sent by the OpenTelemetry Java Agent
    protocols:
      grpc:
        endpoint: 0.0.0.0:4317
      http:
        endpoint: 0.0.0.0:4318

processors:
  batch:
    send_batch_size: 100000 # Number of data entries per batch. It is recommended that the batch data size be between 100M and 1G.
    timeout: 10s

exporters:
  doris:
    endpoint: http://localhost:8030 # FE HTTP address
    database: doris_db_name
    username: doris_username
    password: doris_password
    table:
      traces: doris_table_name
    create_schema: true # Whether to automatically create the schema. If set to false, the table must be created manually.
    mysql_endpoint: localhost:9030 # FE MySQL address
    history_days: 10
    create_history_days: 10
    timezone: Asia/Shanghai
    timeout: 60s # HTTP Stream Load client timeout
    log_response: true
    sending_queue:
      enabled: true
      num_consumers: 20
      queue_size: 1000
    retry_on_failure:
      enabled: true
      initial_interval: 5s
      max_interval: 30s
    headers:
      load_to_single_tablet: "true"

service:
  pipelines:
    traces:
      receivers: [otlp]
      processors: [batch]
      exporters: [doris]
Step 2: Run the OpenTelemetry Collector
./otelcol-contrib --config otel_trace.yaml
Step 3: Integrate the OpenTelemetry SDK on the application side
The following example uses a Spring Boot sample application to integrate the OpenTelemetry Java SDK. The sample application comes from the official demo and returns the simple string Hello World! for the path /.
Download the OpenTelemetry Java Agent. The advantage of using the Java Agent is that no modification to existing application code is required. For other languages and integration methods, refer to the Language APIs & SDKs or Zero-code Instrumentation on the OpenTelemetry official website.
Before starting the application, add the following environment variables:
export JAVA_TOOL_OPTIONS="${JAVA_TOOL_OPTIONS} -javaagent:/your/path/to/opentelemetry-javaagent.jar" # Path to the OpenTelemetry Java Agent
export OTEL_JAVAAGENT_LOGGING="none" # Disable OTel logs to avoid interfering with the service's own logs
export OTEL_SERVICE_NAME="myproject"
export OTEL_TRACES_EXPORTER="otlp" # Use the OTLP protocol to send trace data
export OTEL_EXPORTER_OTLP_ENDPOINT="http://localhost:4317" # Address of the OpenTelemetry Collector

java -jar myproject-0.0.1-SNAPSHOT.jar