QuickSight
QuickSight can connect to Apache Doris via the official MySQL data source in Directly query or Import mode
Prerequisites
-
Apache Doris version must be no less than 3.1.2
-
Network connectivity (VPC, security group configuration) needs to be configured according to the Doris deployment environment to ensure that AWS servers can access your Doris cluster.
-
Run the following SQL on the MySQL client that connects to Doris to adjust the declared MySQL compatibility version:
SET GLOBAL version = '8.3.99';Verification result:
mysql> show variables like "version";
+---------------+--------+---------------+---------+
| Variable_name | Value  | Default_Value | Changed |
+---------------+--------+---------------+---------+
| version       | 8.3.99 | 5.7.99        | 1       |
+---------------+--------+---------------+---------+
1 row in set (0.01 sec)
Connect QuickSight to Apache Doris
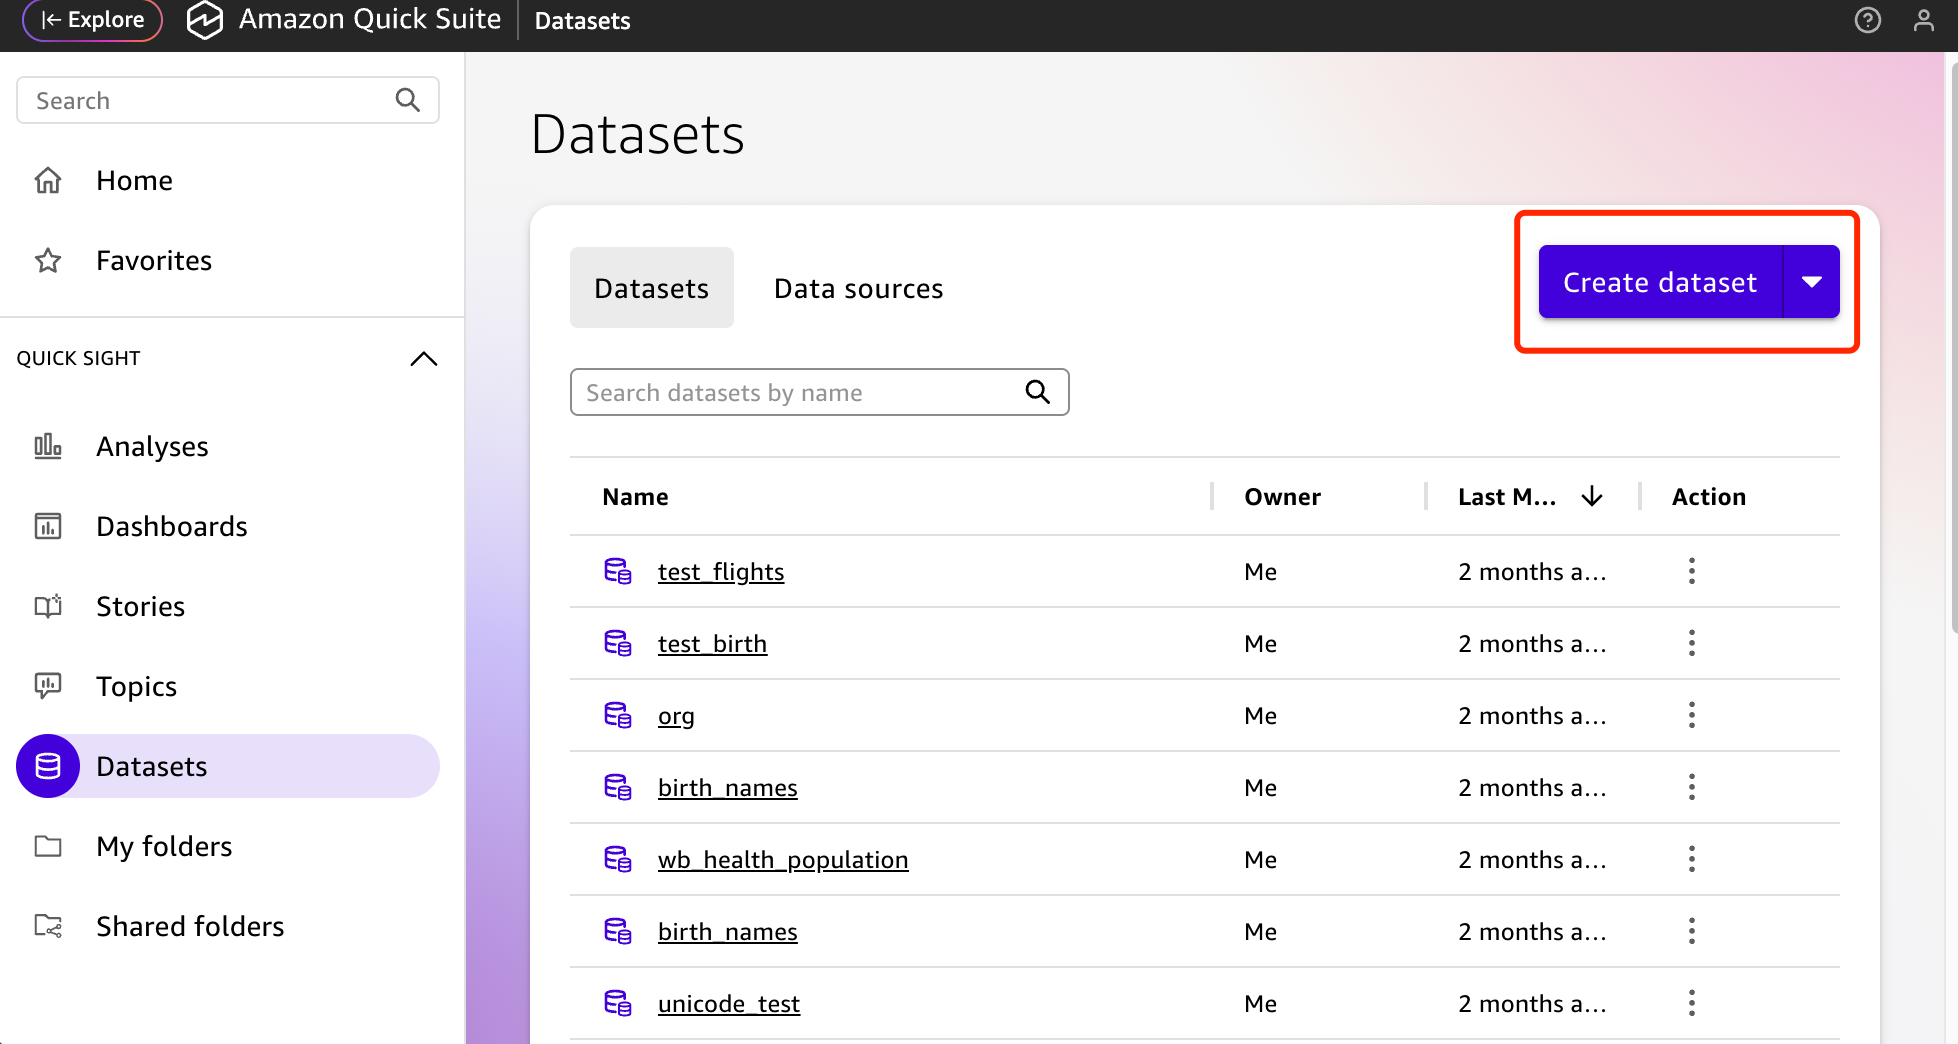
First, visit https://quicksight.aws.amazon.com, navigate to Datasets, and click "New dataset":

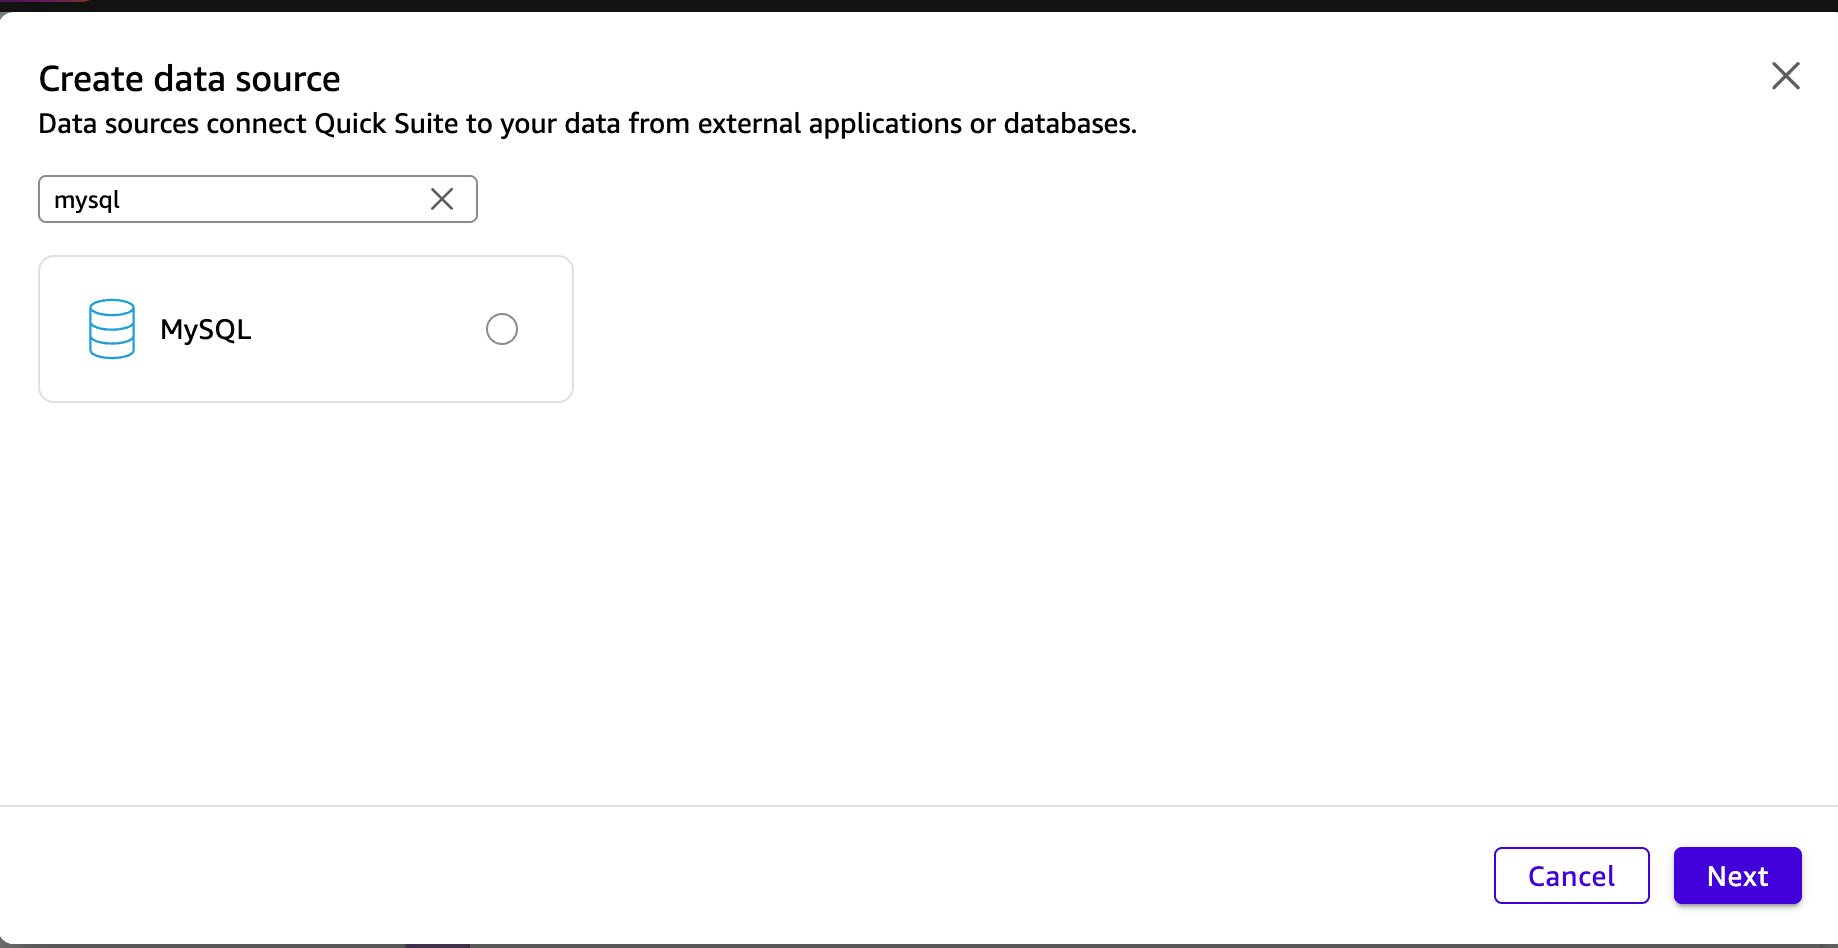
Search for the official MySQL connector bundled with QuickSight:
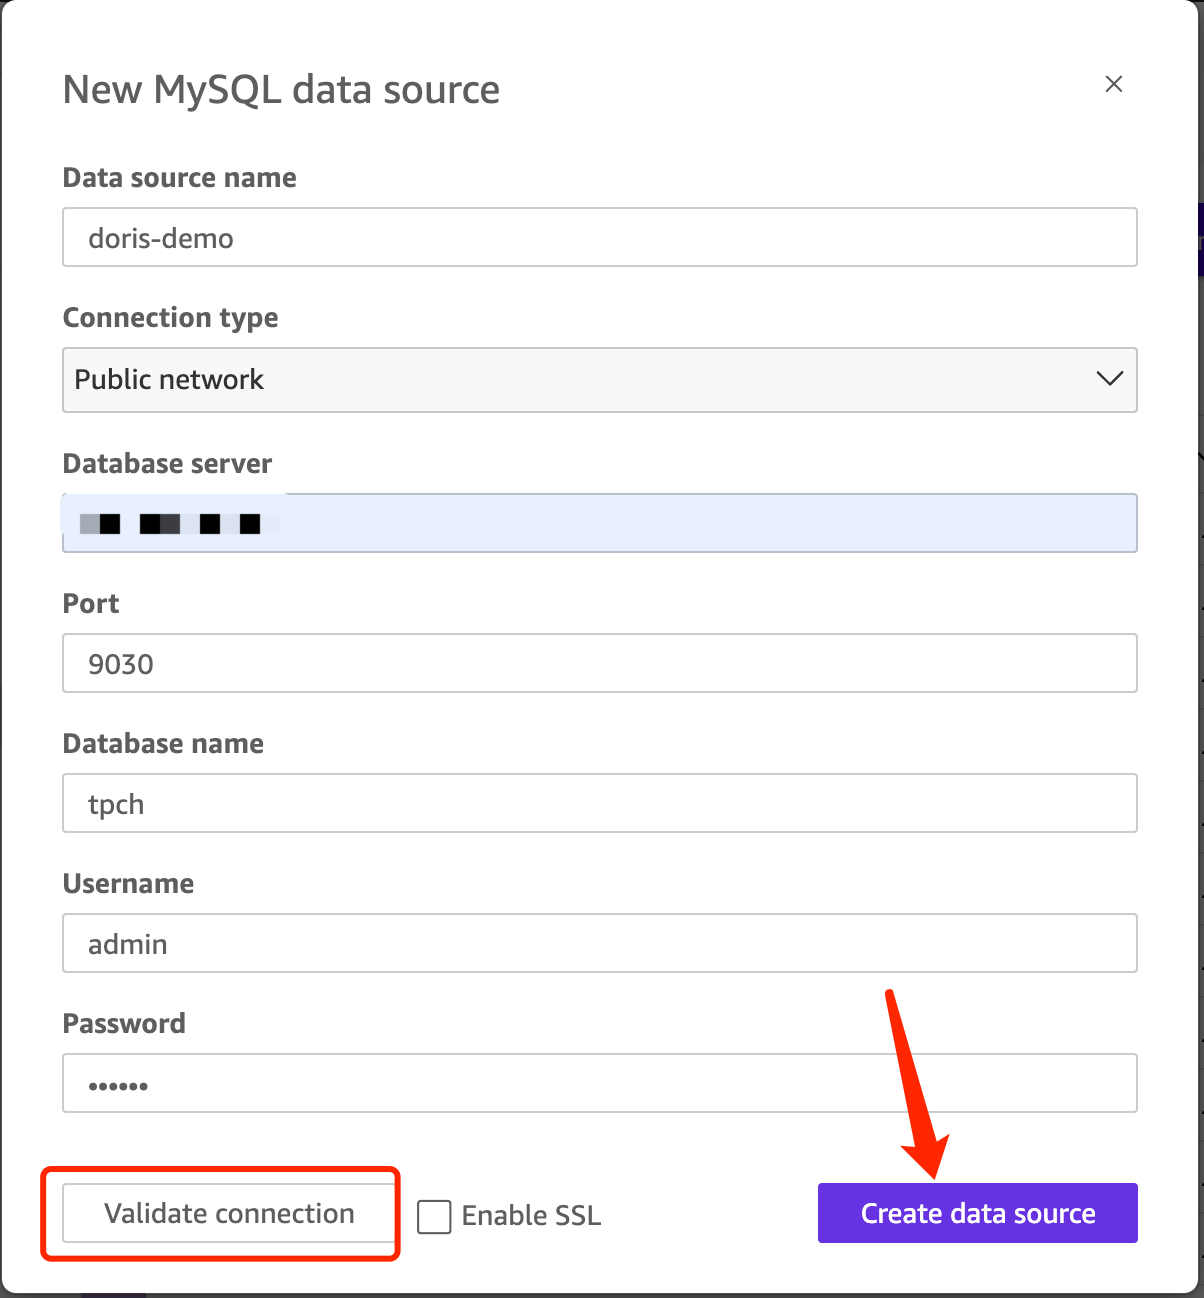
Specify your connection details. Note that the MySQL interface port defaults to 9030, which may vary depending on your FE query_port configuration.
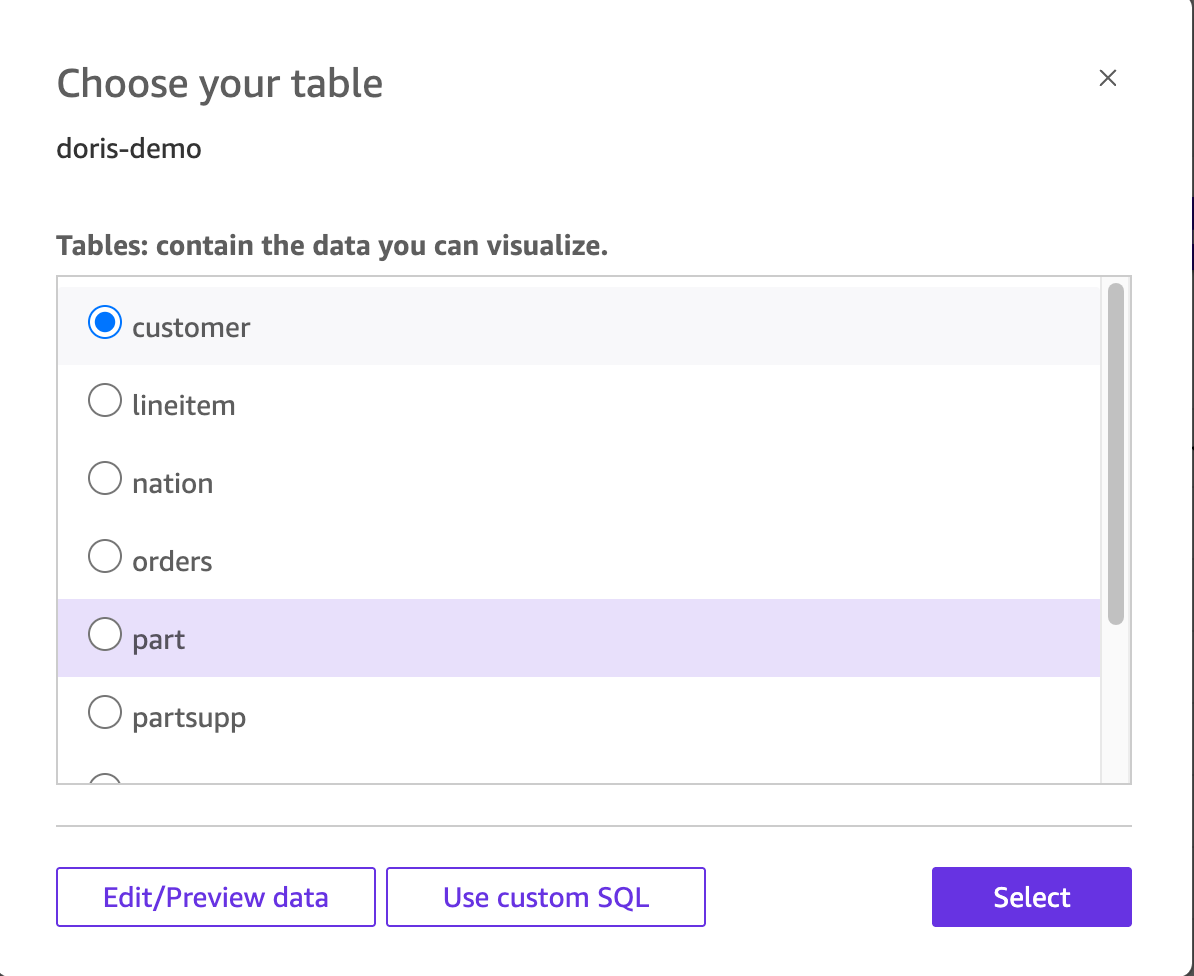
Now, you can select a table from the list:
It is recommended to choose the "Directly query" mode:
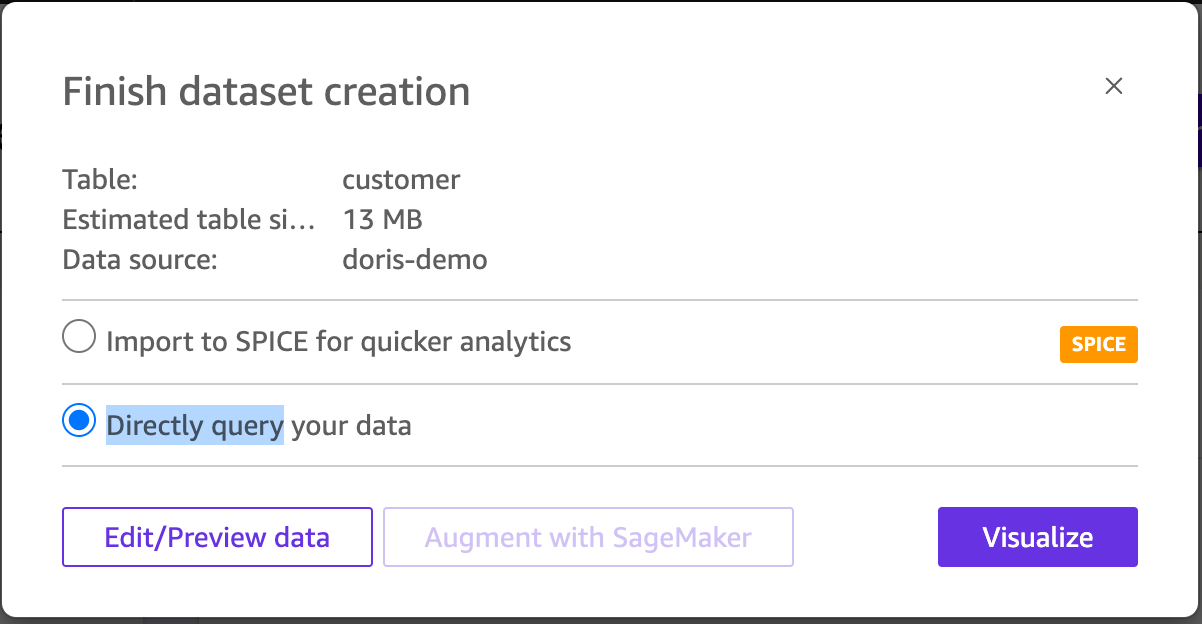
Additionally, by clicking "Edit/Preview data", you should be able to view the internal table structure or adjust the custom SQL, and you can adjust the dataset here:
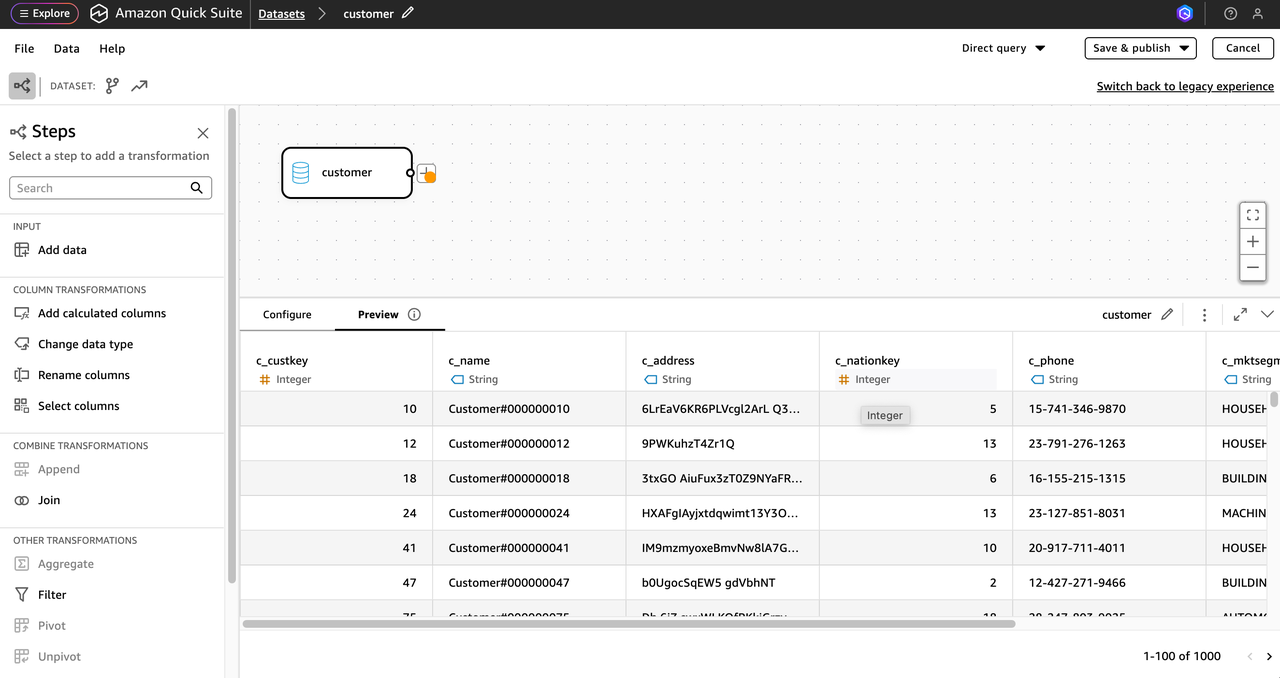
Now, you can proceed to publish the dataset and create new visualizations!
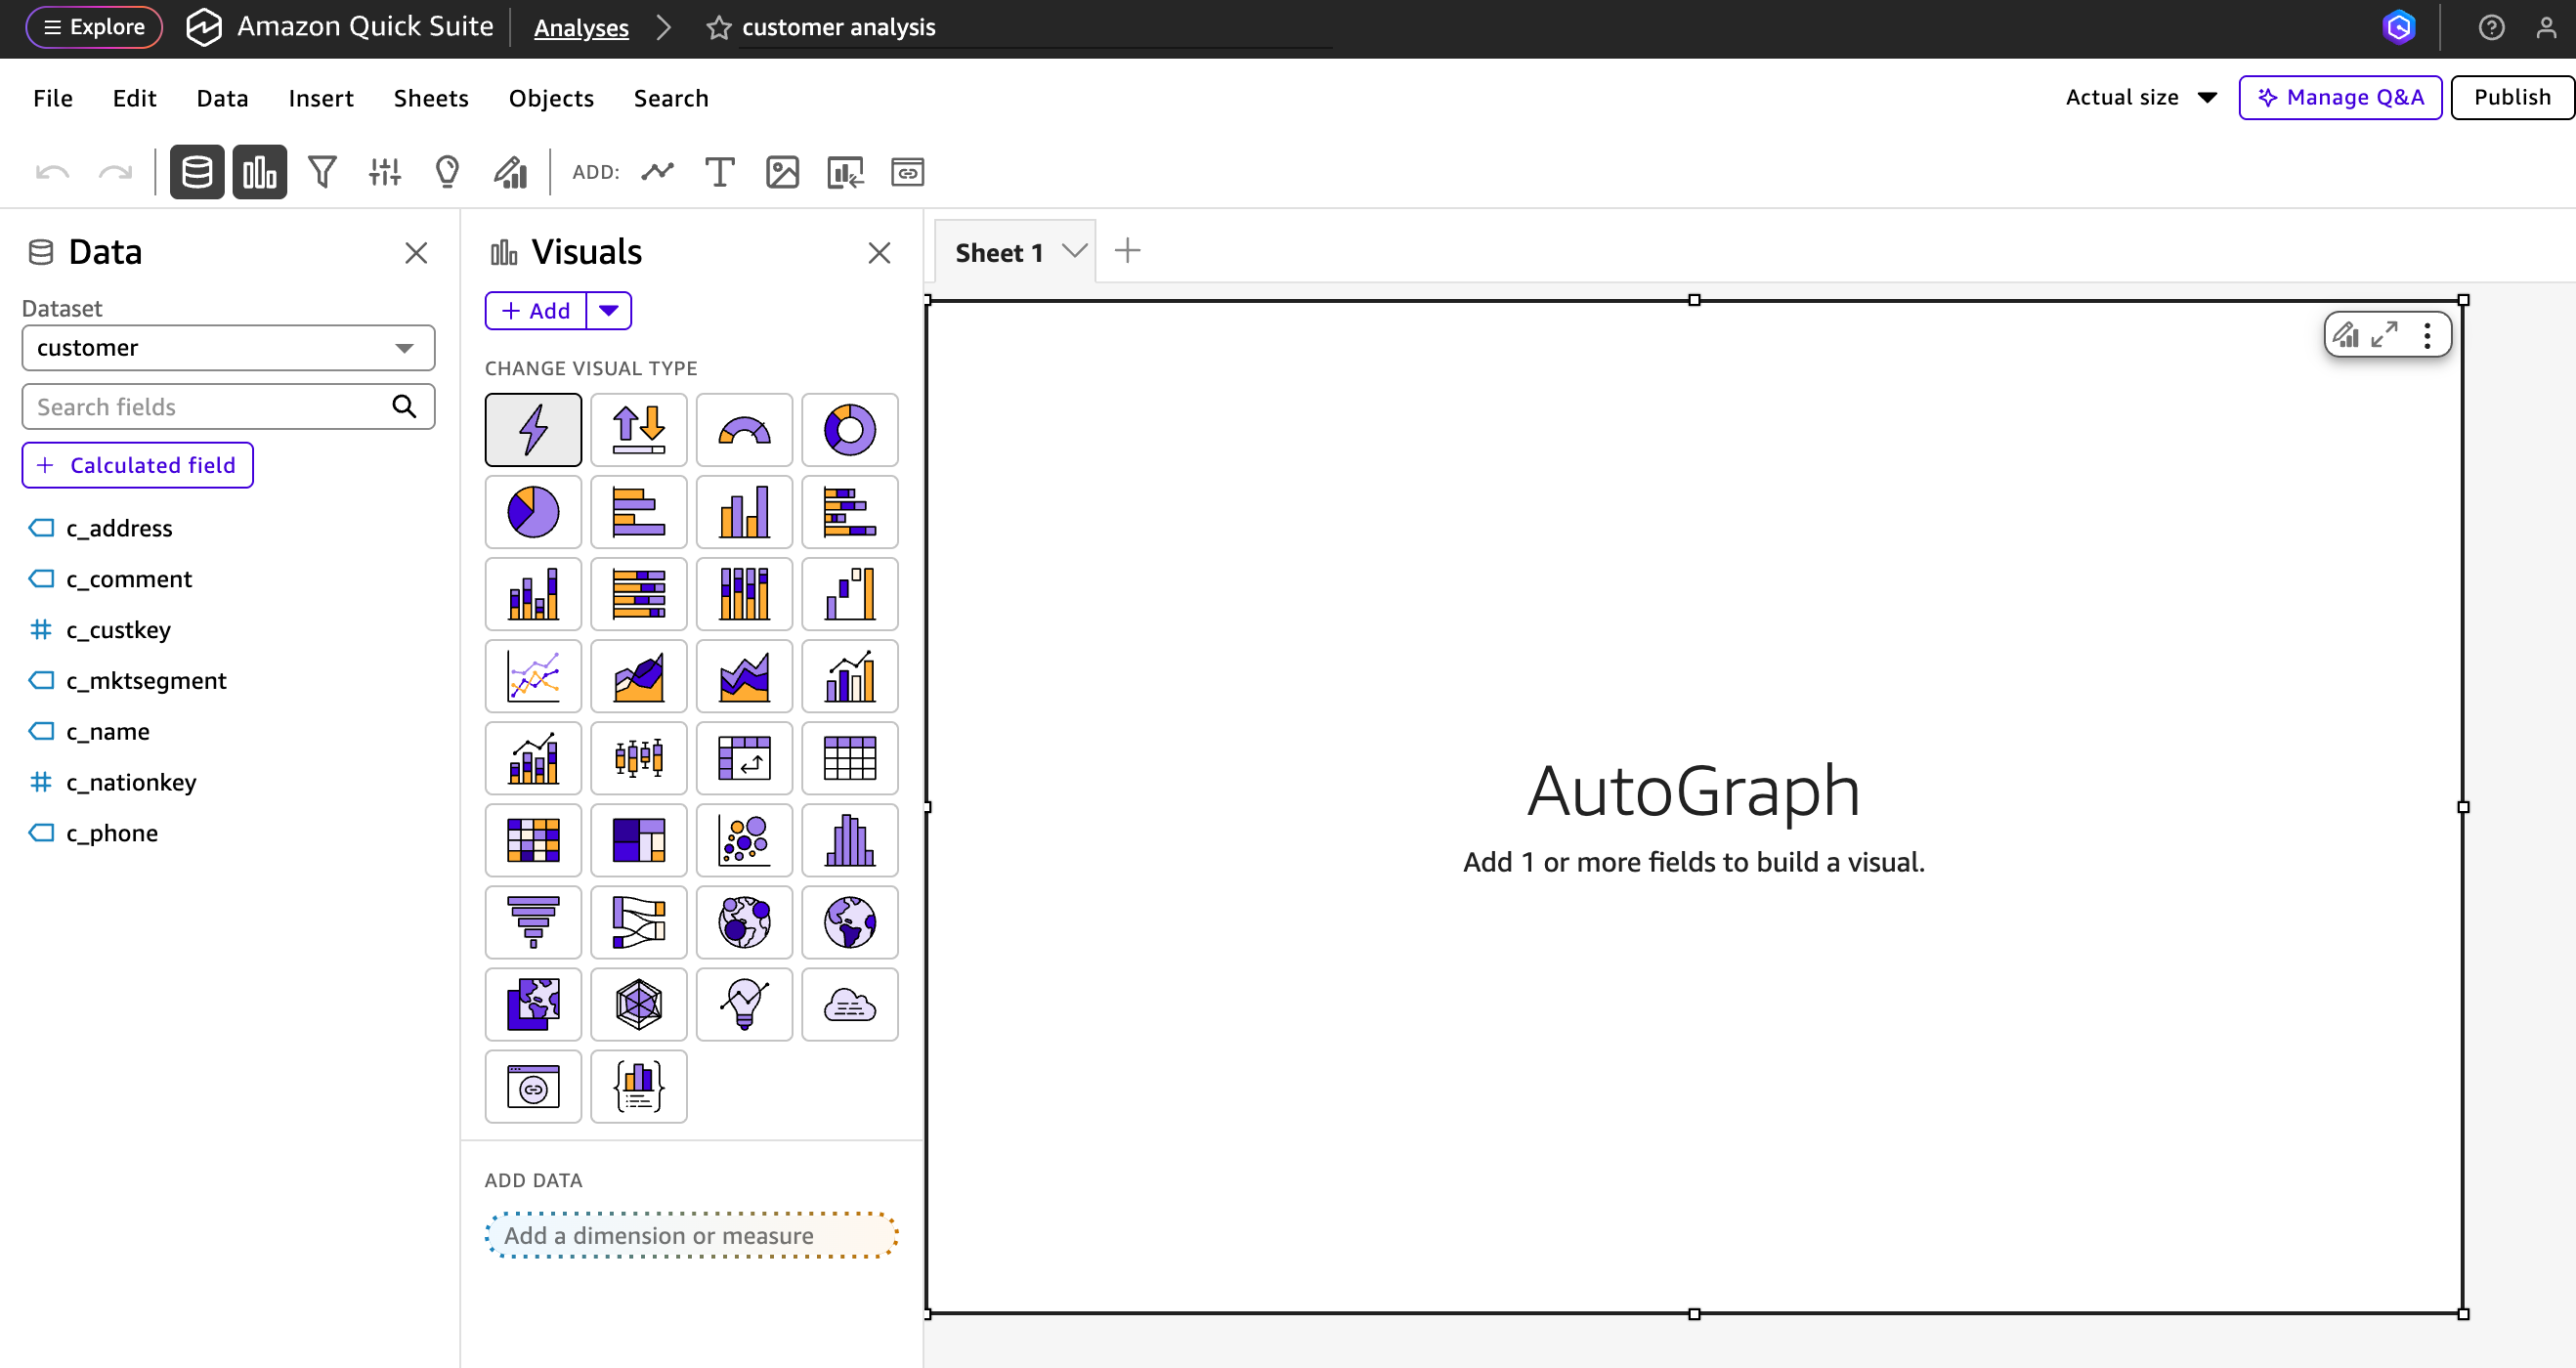
Building Visualizations in QuickSight
We've chosen TPC-H data as our data source. For instructions on building a Doris TPC-H data source, refer to this document.
Now that we've configured the Doris data source in QuickSight, let's visualize the data...
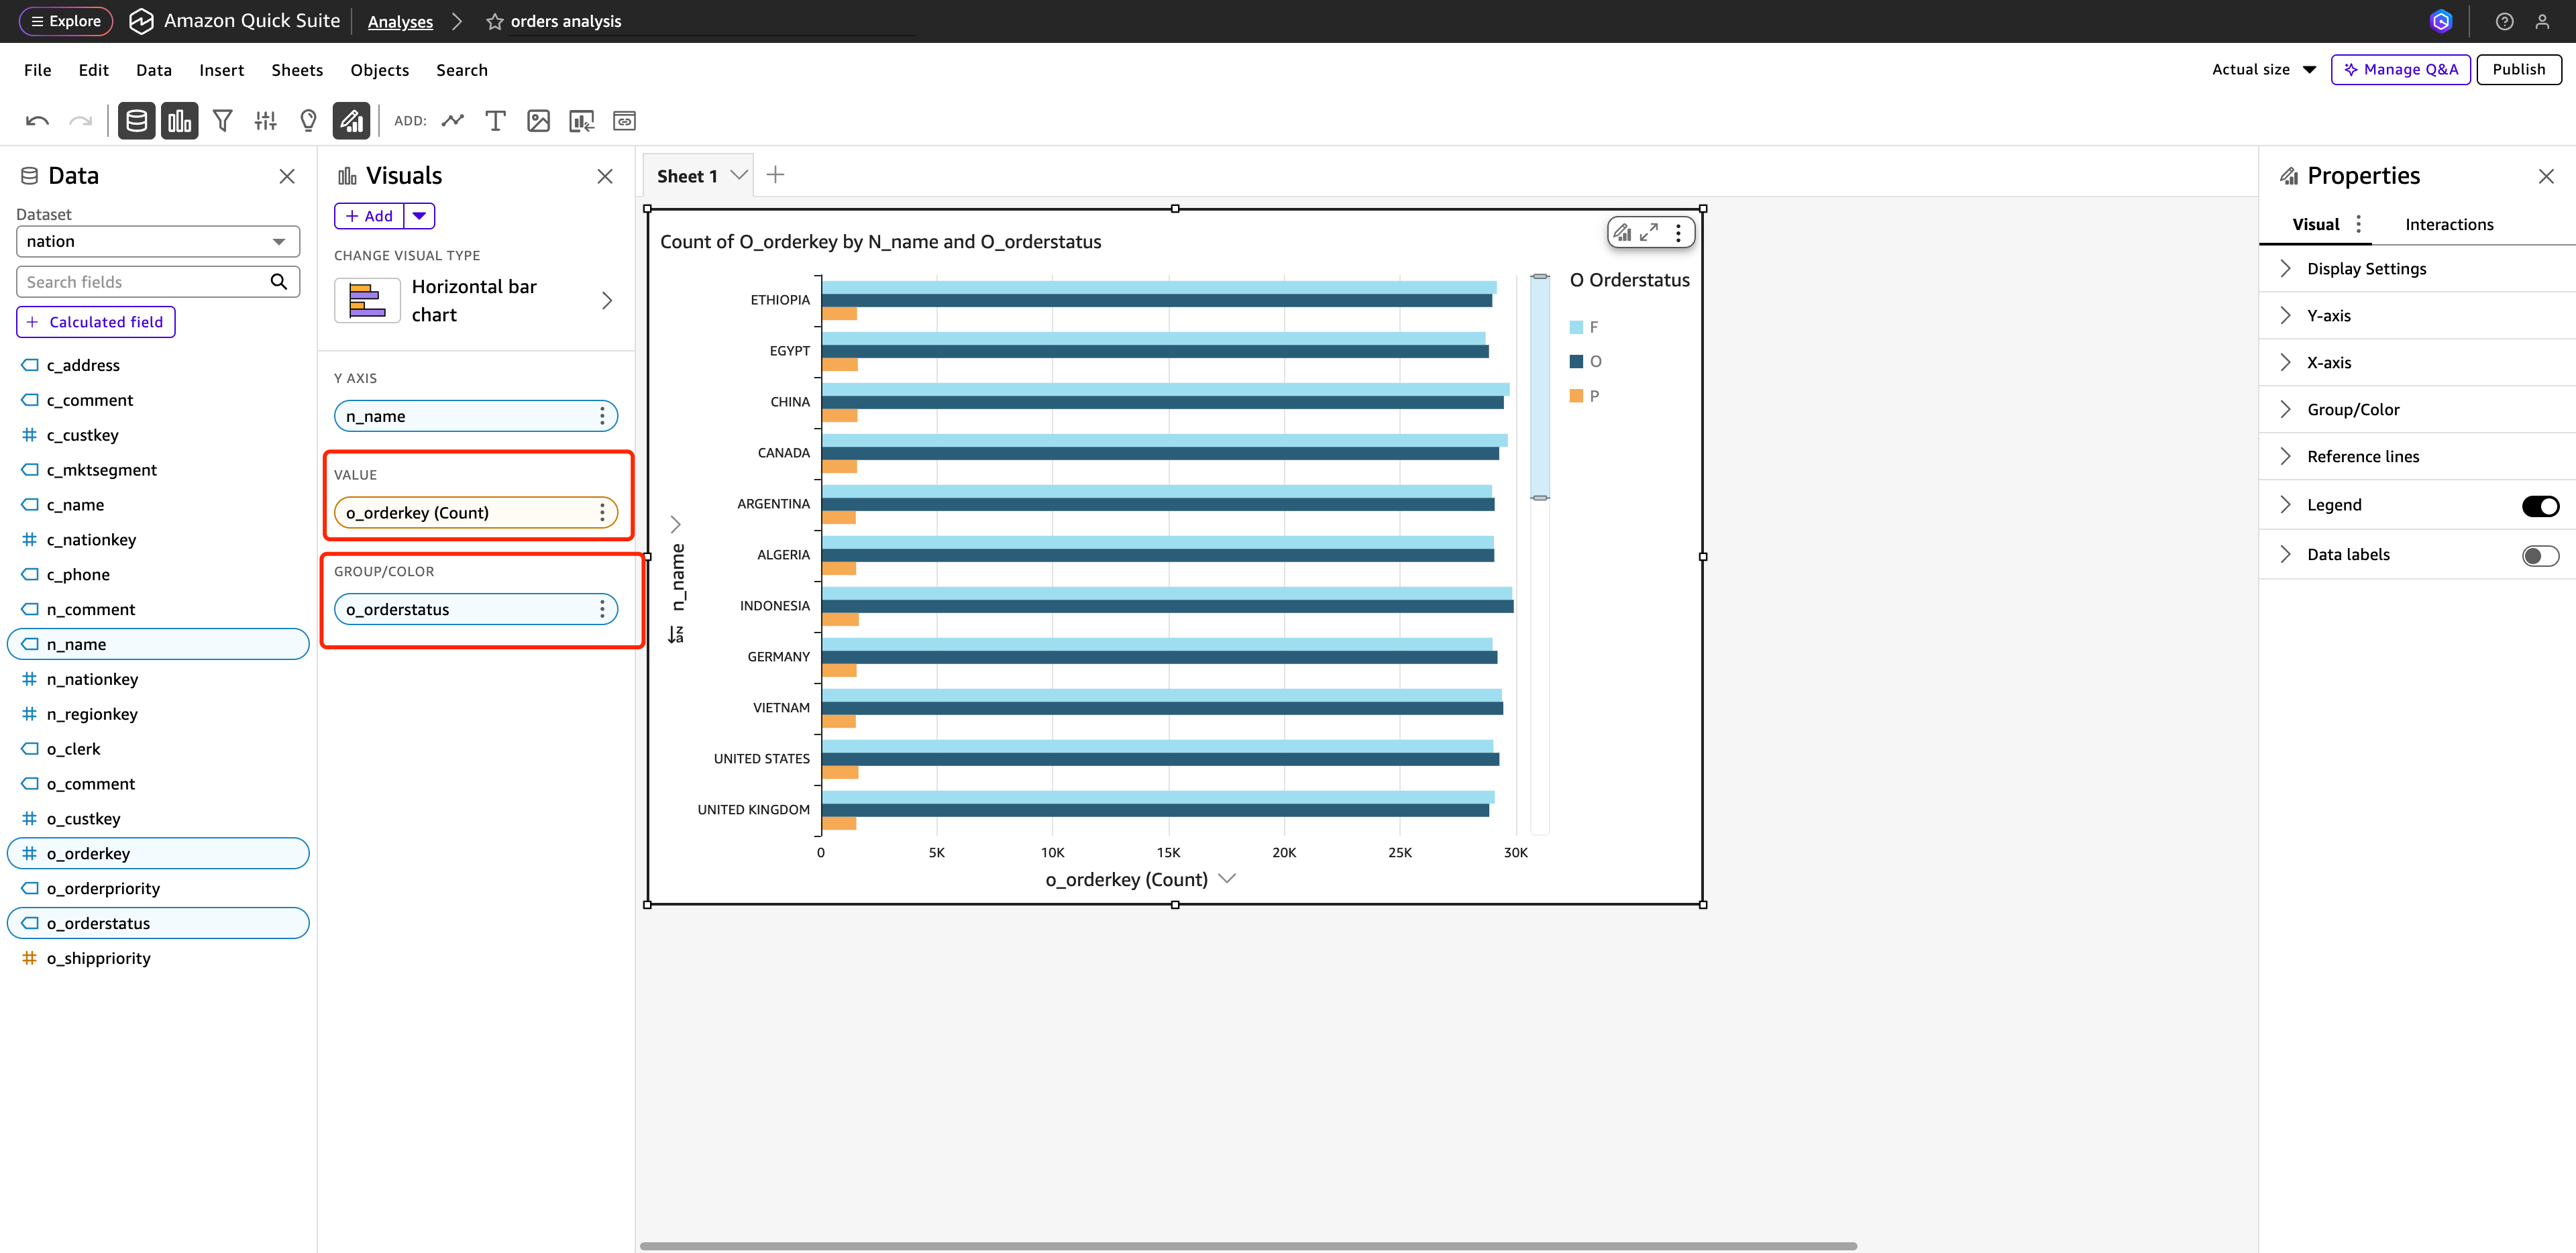
Due to Doris's excellent performance in multi-table join scenarios, we chose to design a dashboard based on this scenario. Let's say we need to know order statistics for different countries at different statuses. We will then build the dashboard according to this requirement.
- Add the following table as a Dataset to the Data source created using the steps above.
- customer
- nation
- orders
- Click 'Create Dataset'
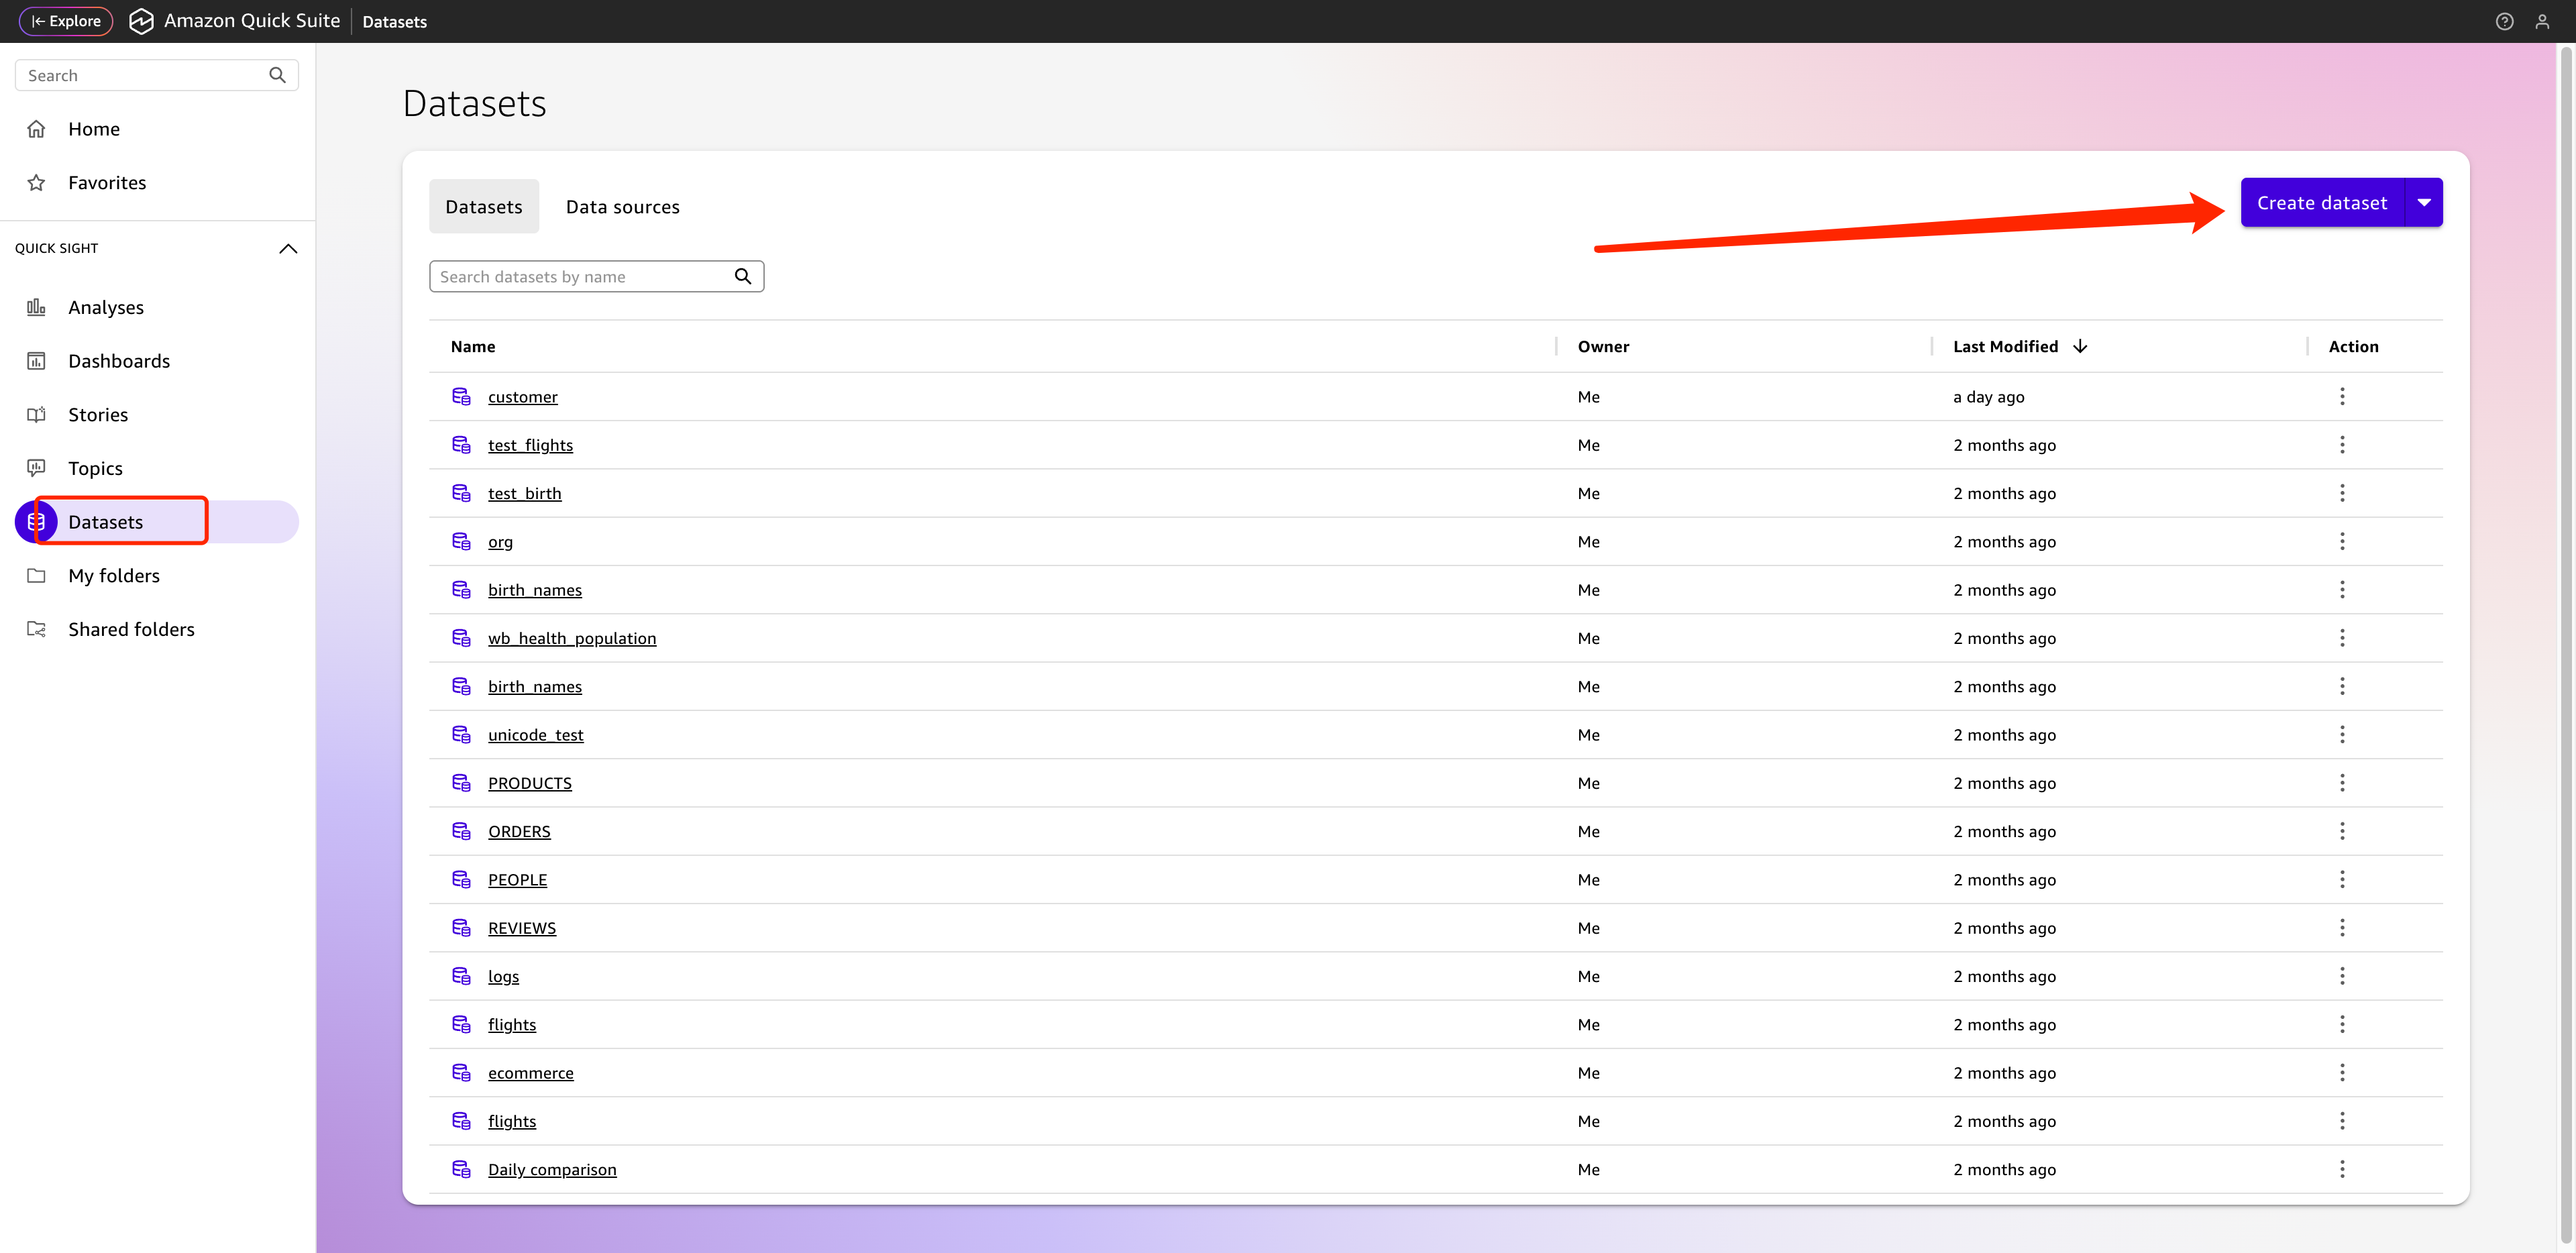
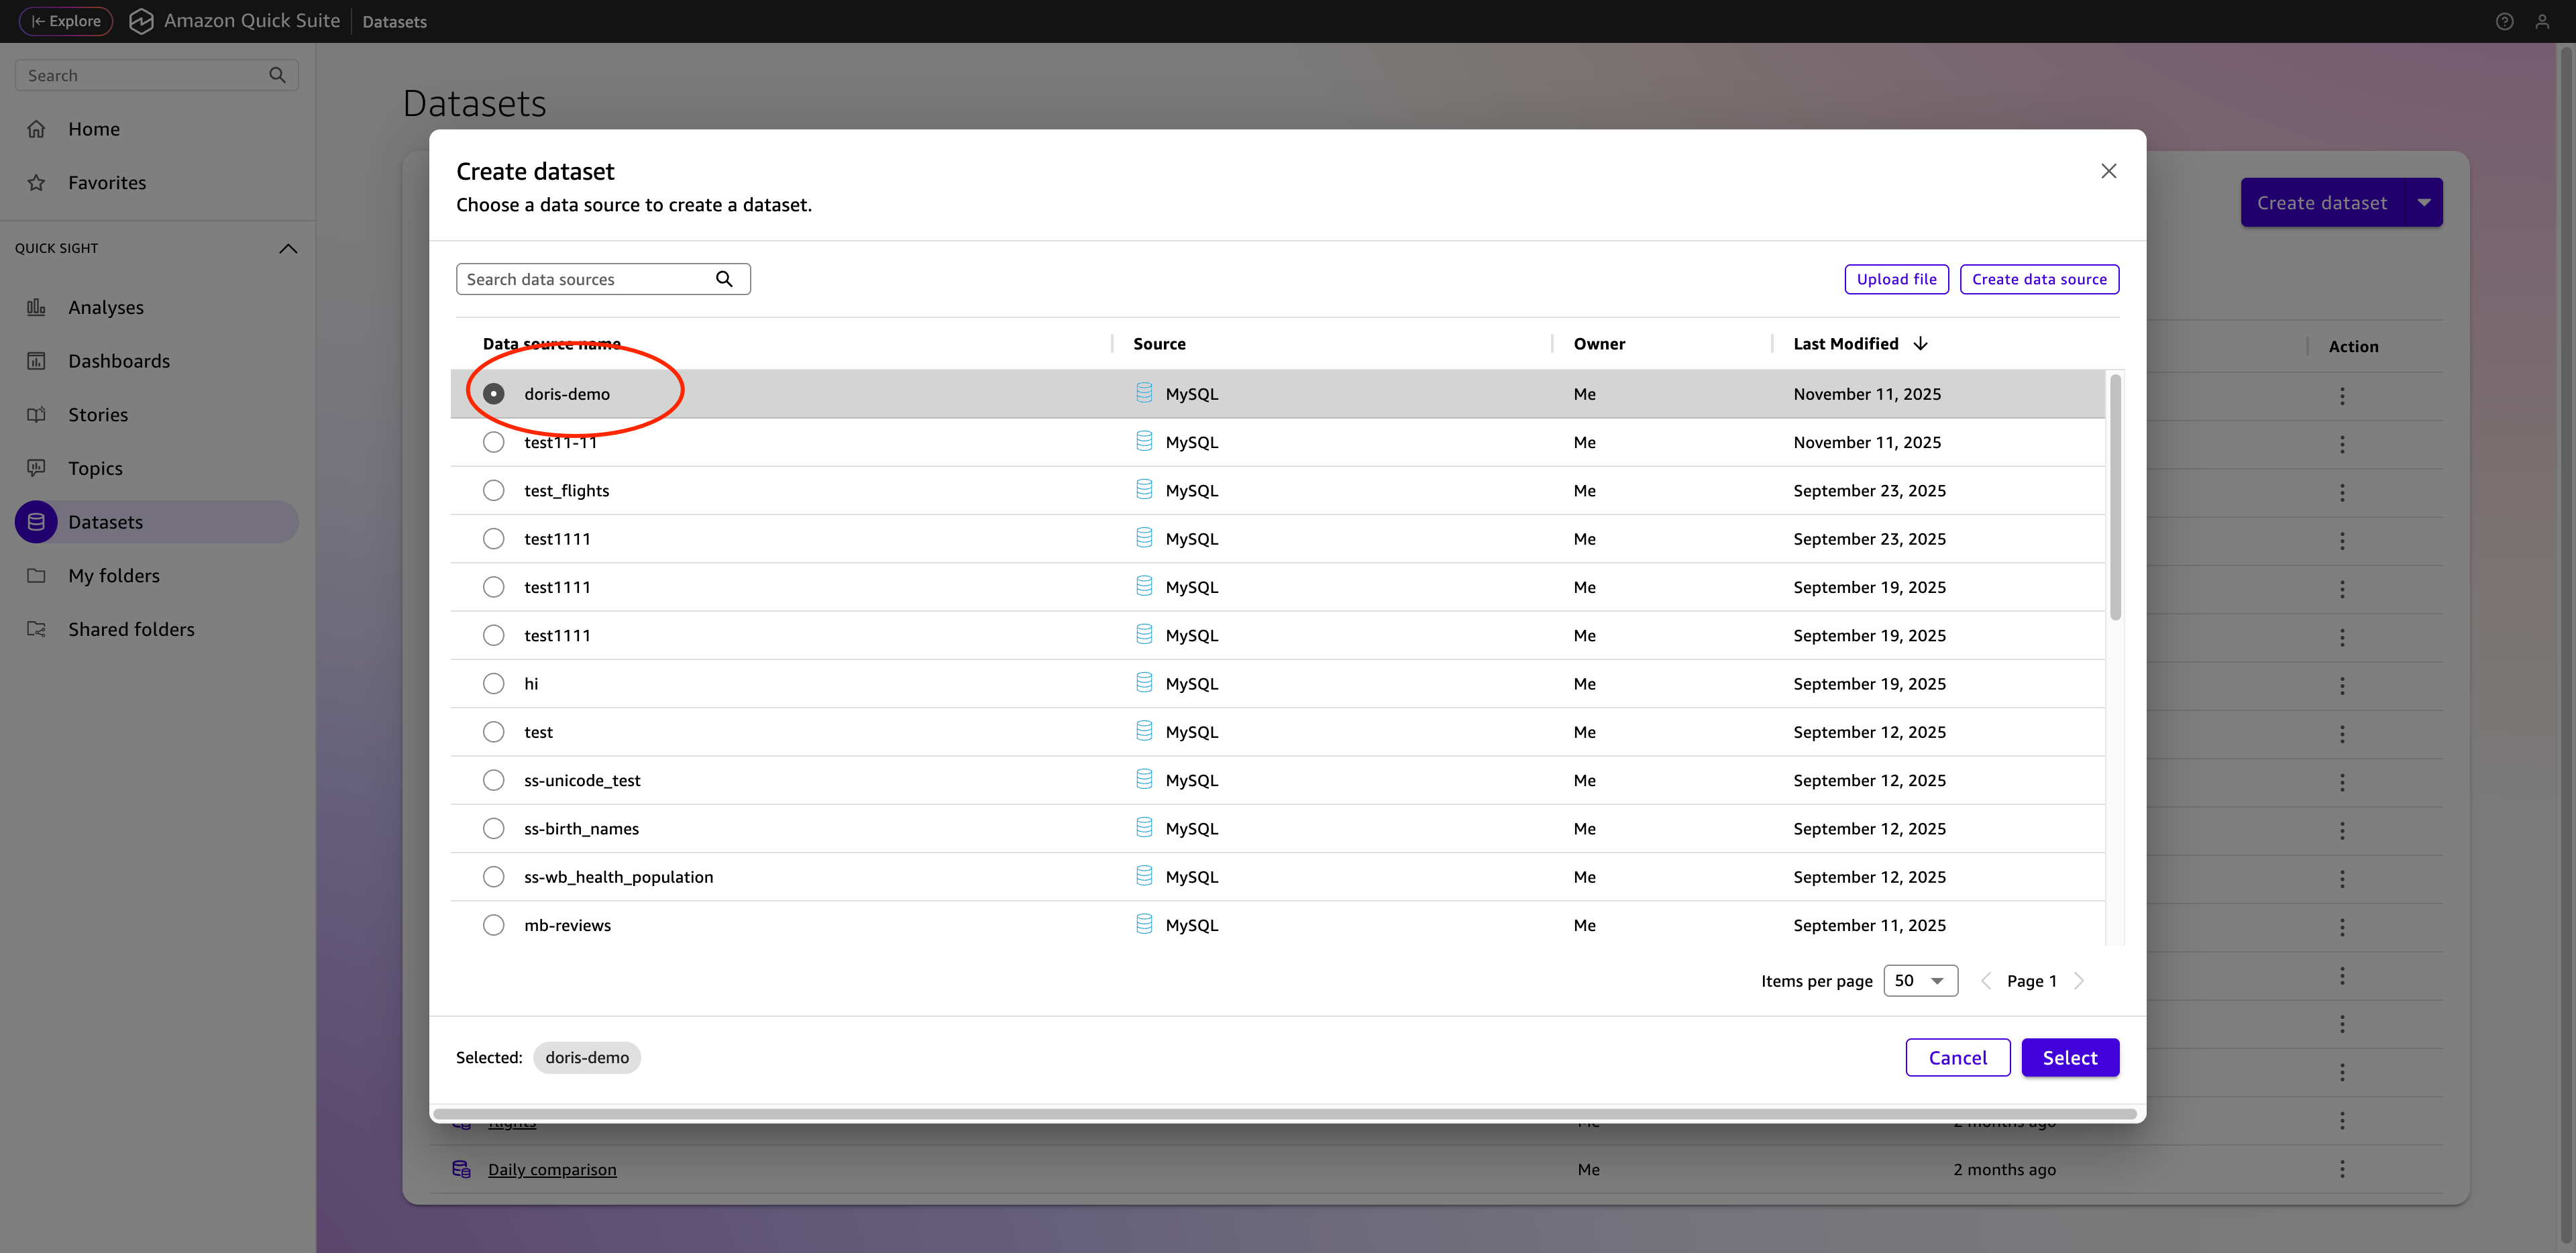
- Select the data source created in the above steps
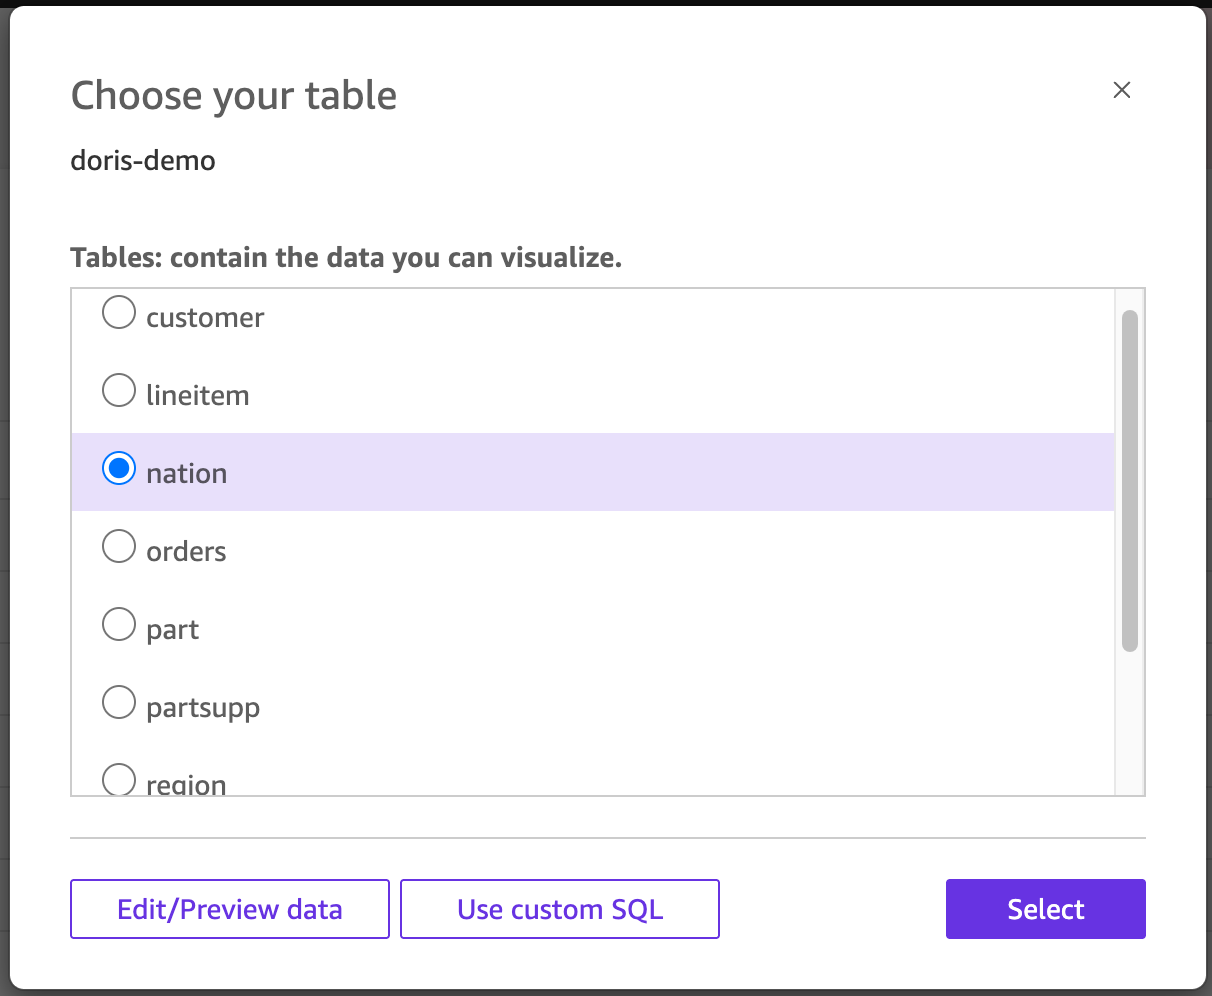
- Select the required tables
Select Directly Query mode
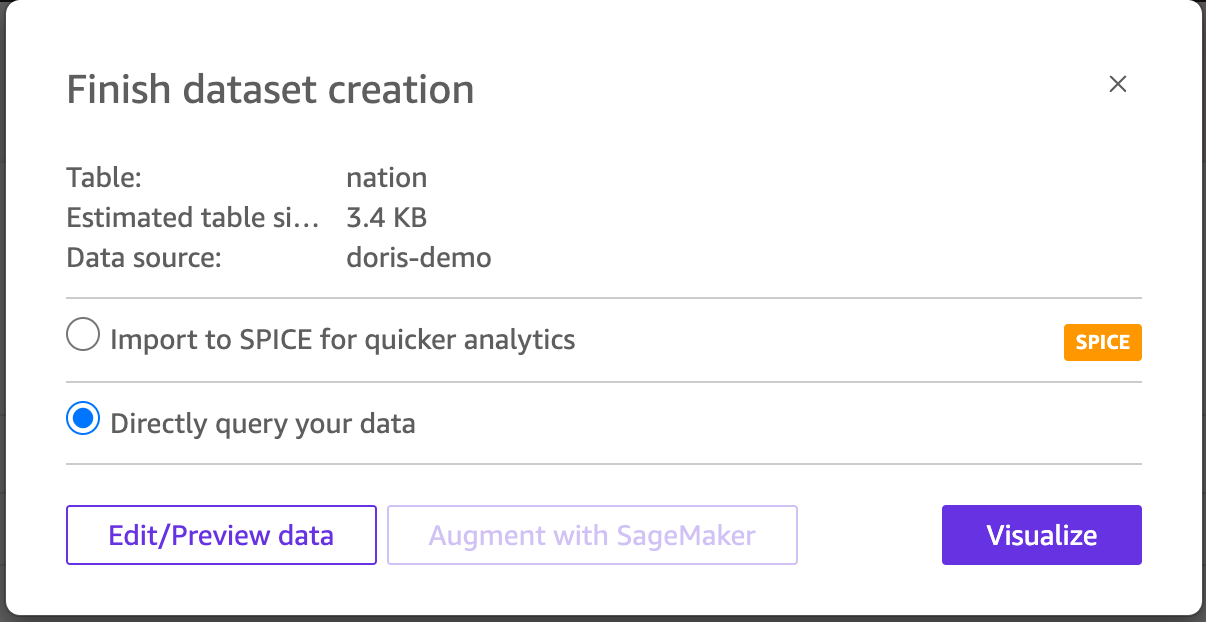
Click 'Visualize' to create the data source. Follow these steps to create data sources for other tables as well.
- Enter the dashboard creation workbench, click the current Dataset dropdown menu, and select Add New Dataset.
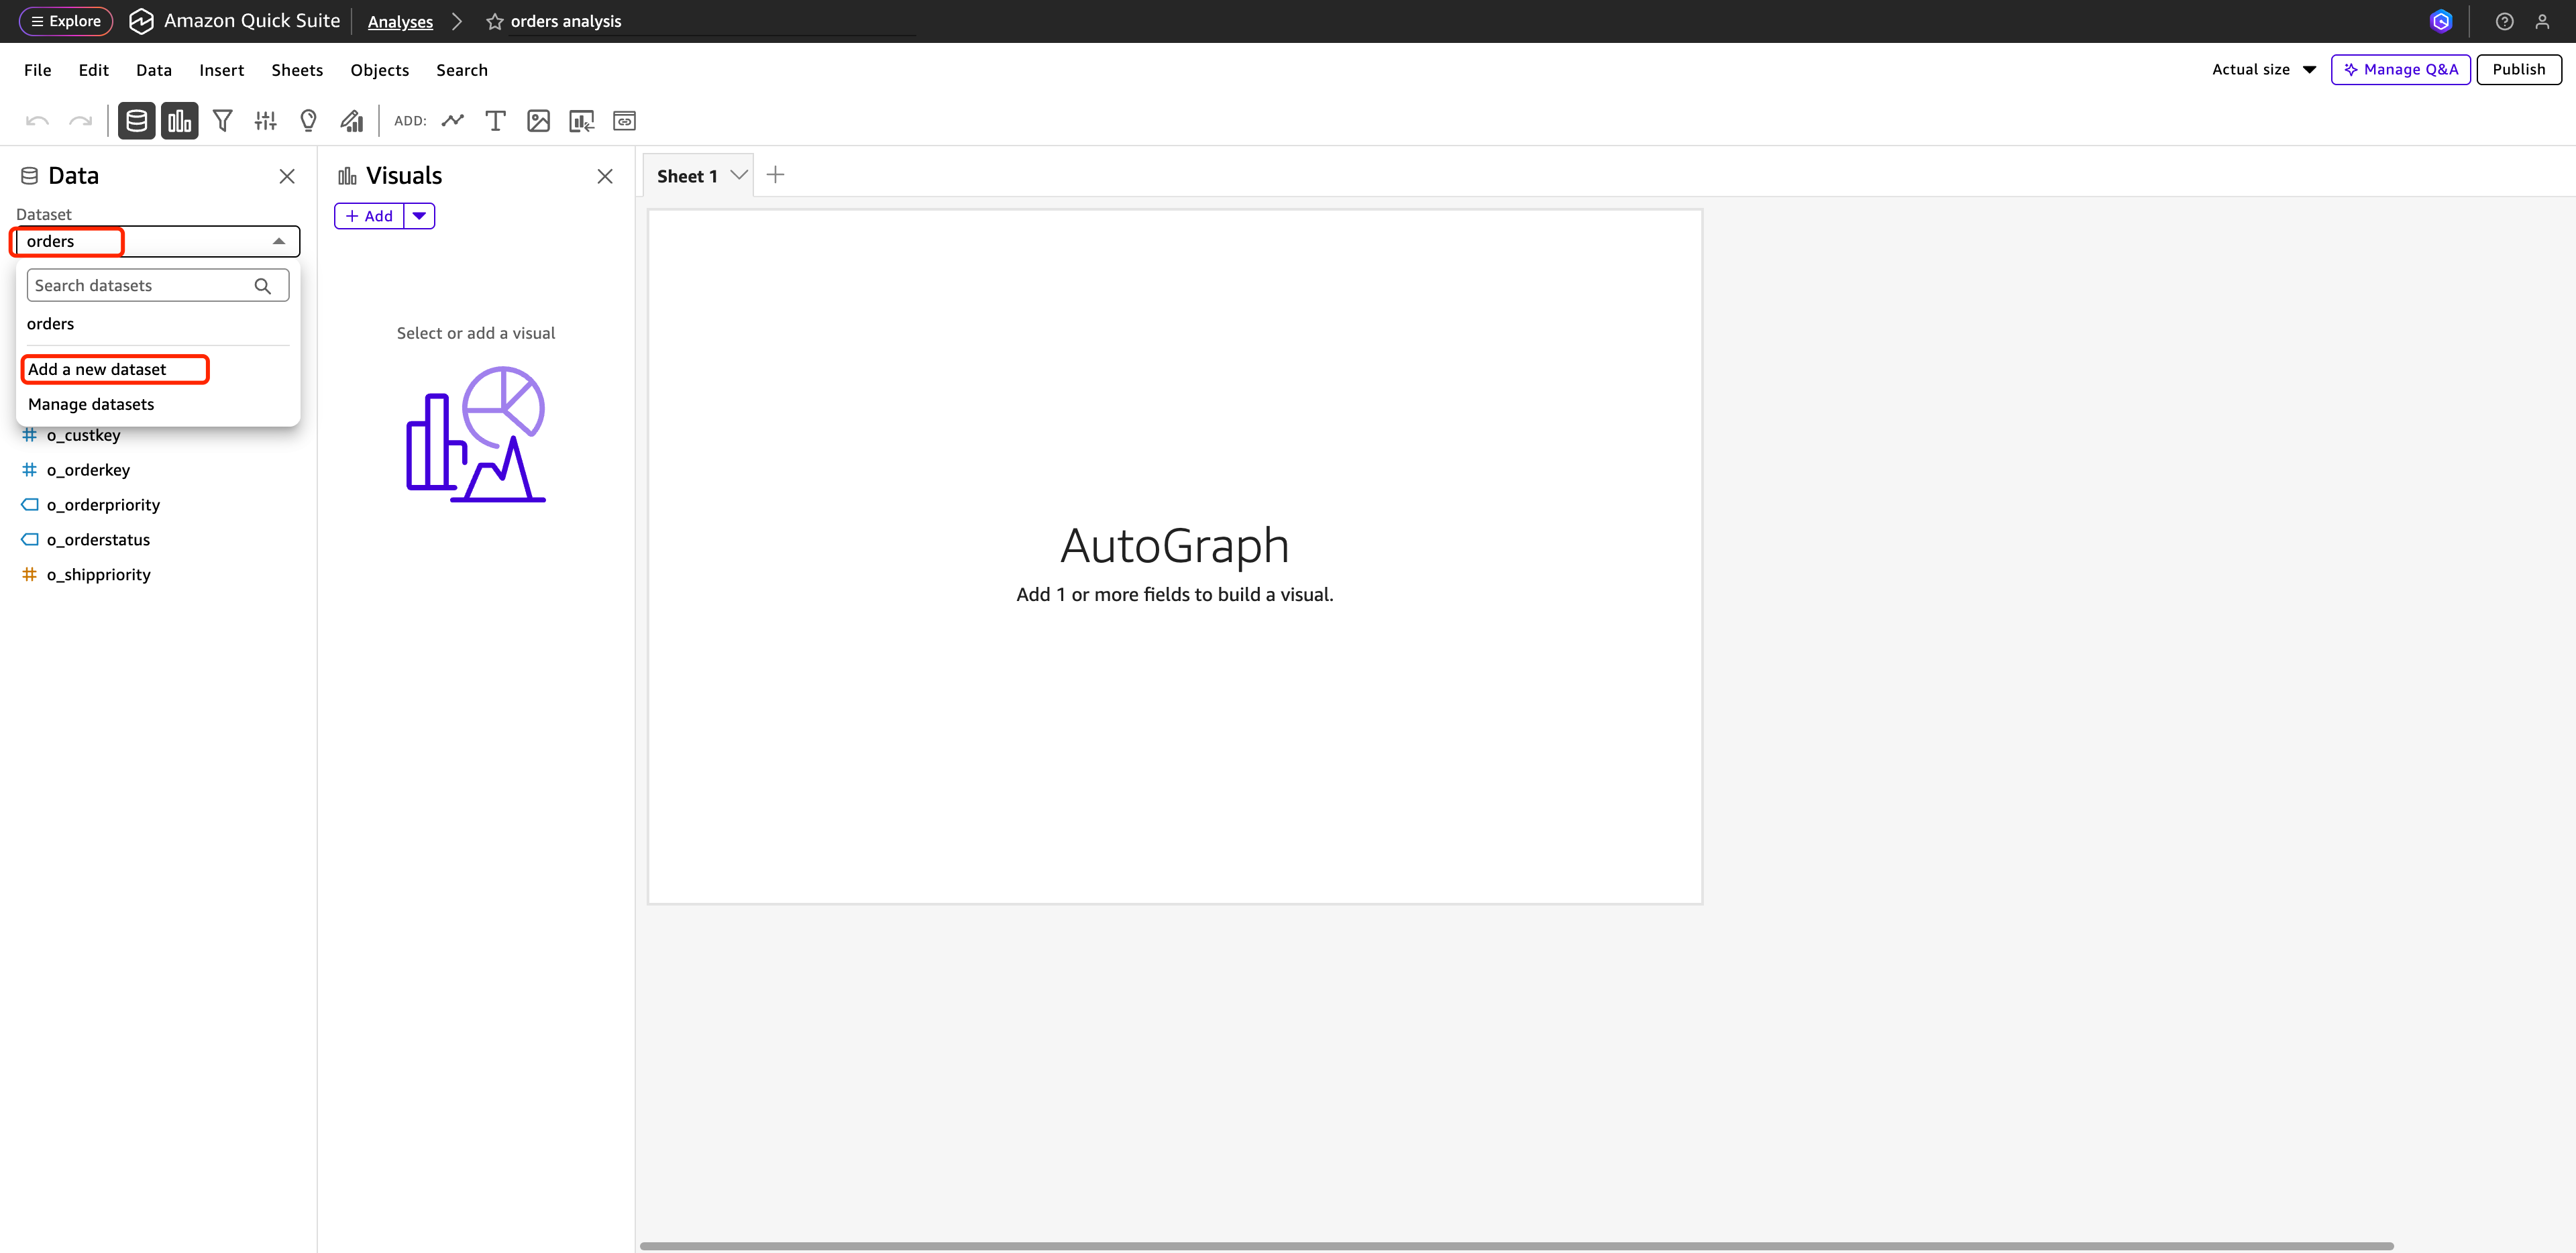
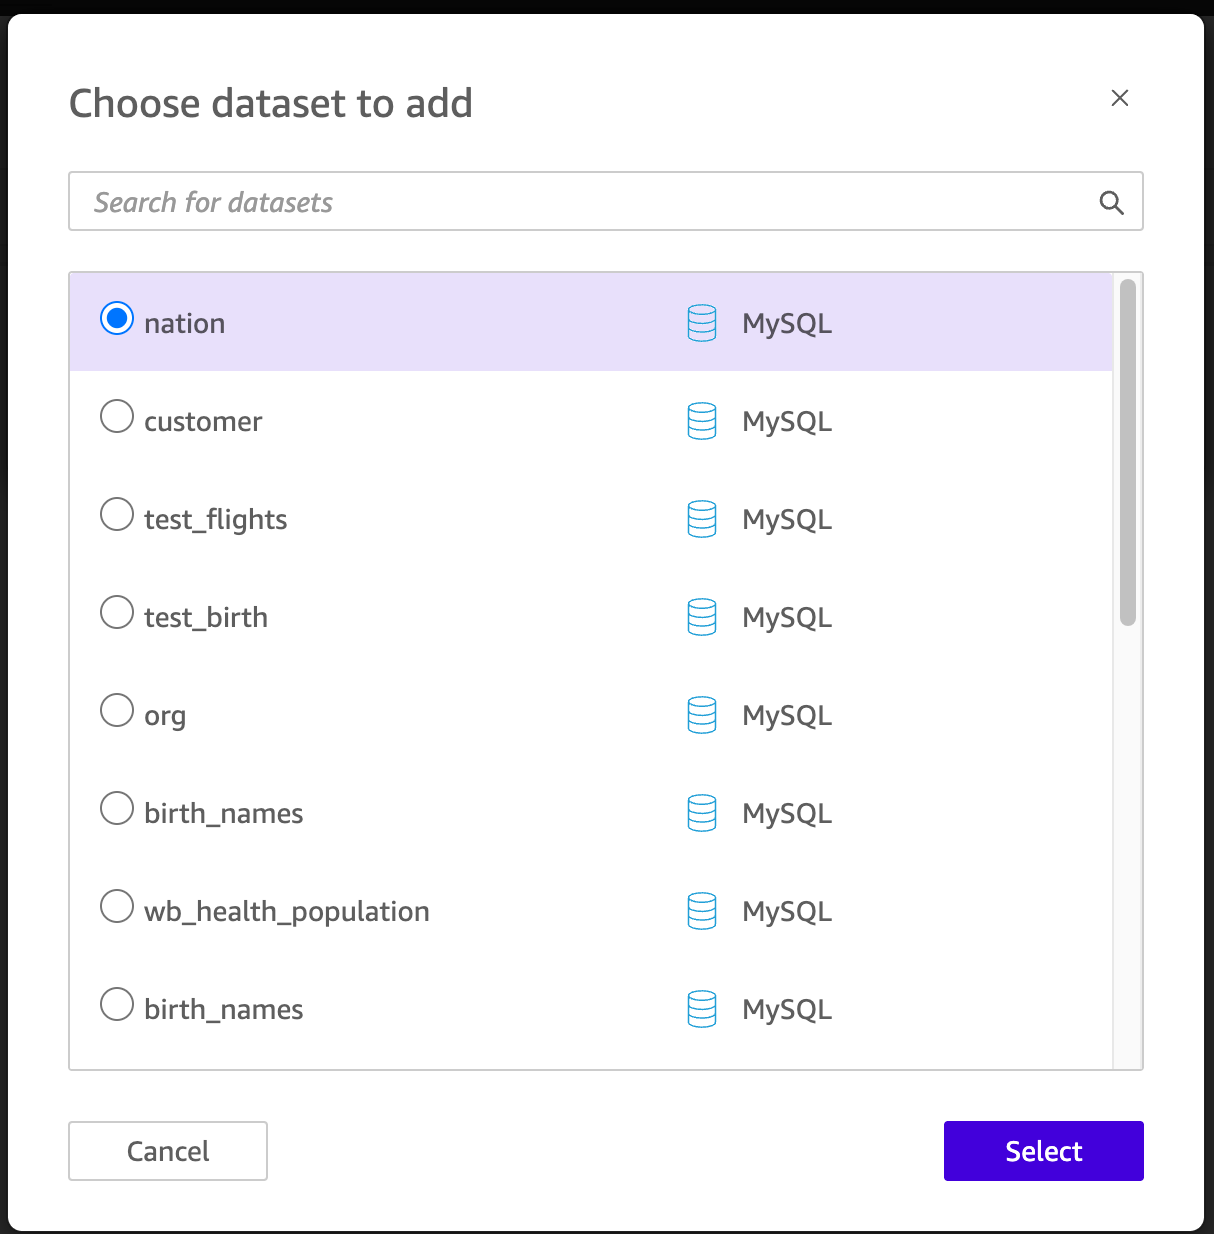
- Select all datasets in sequence, click Select, and add them to the dashboard.
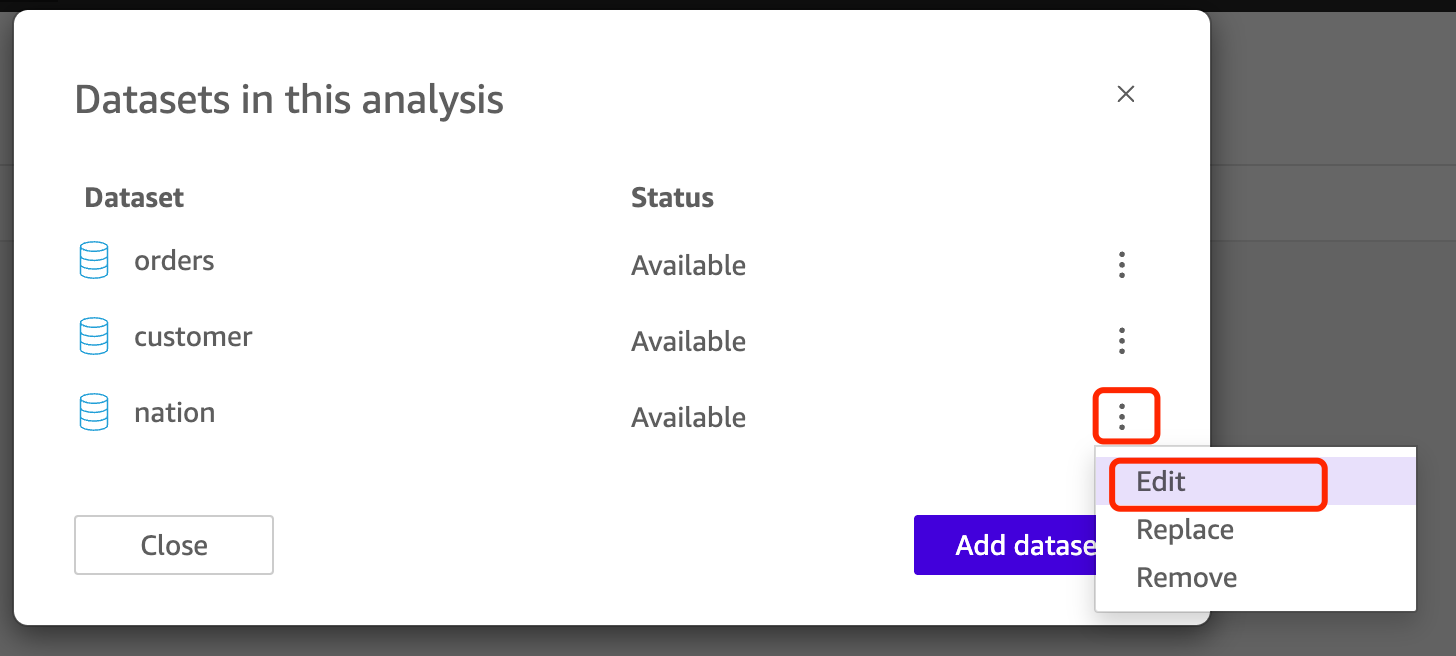
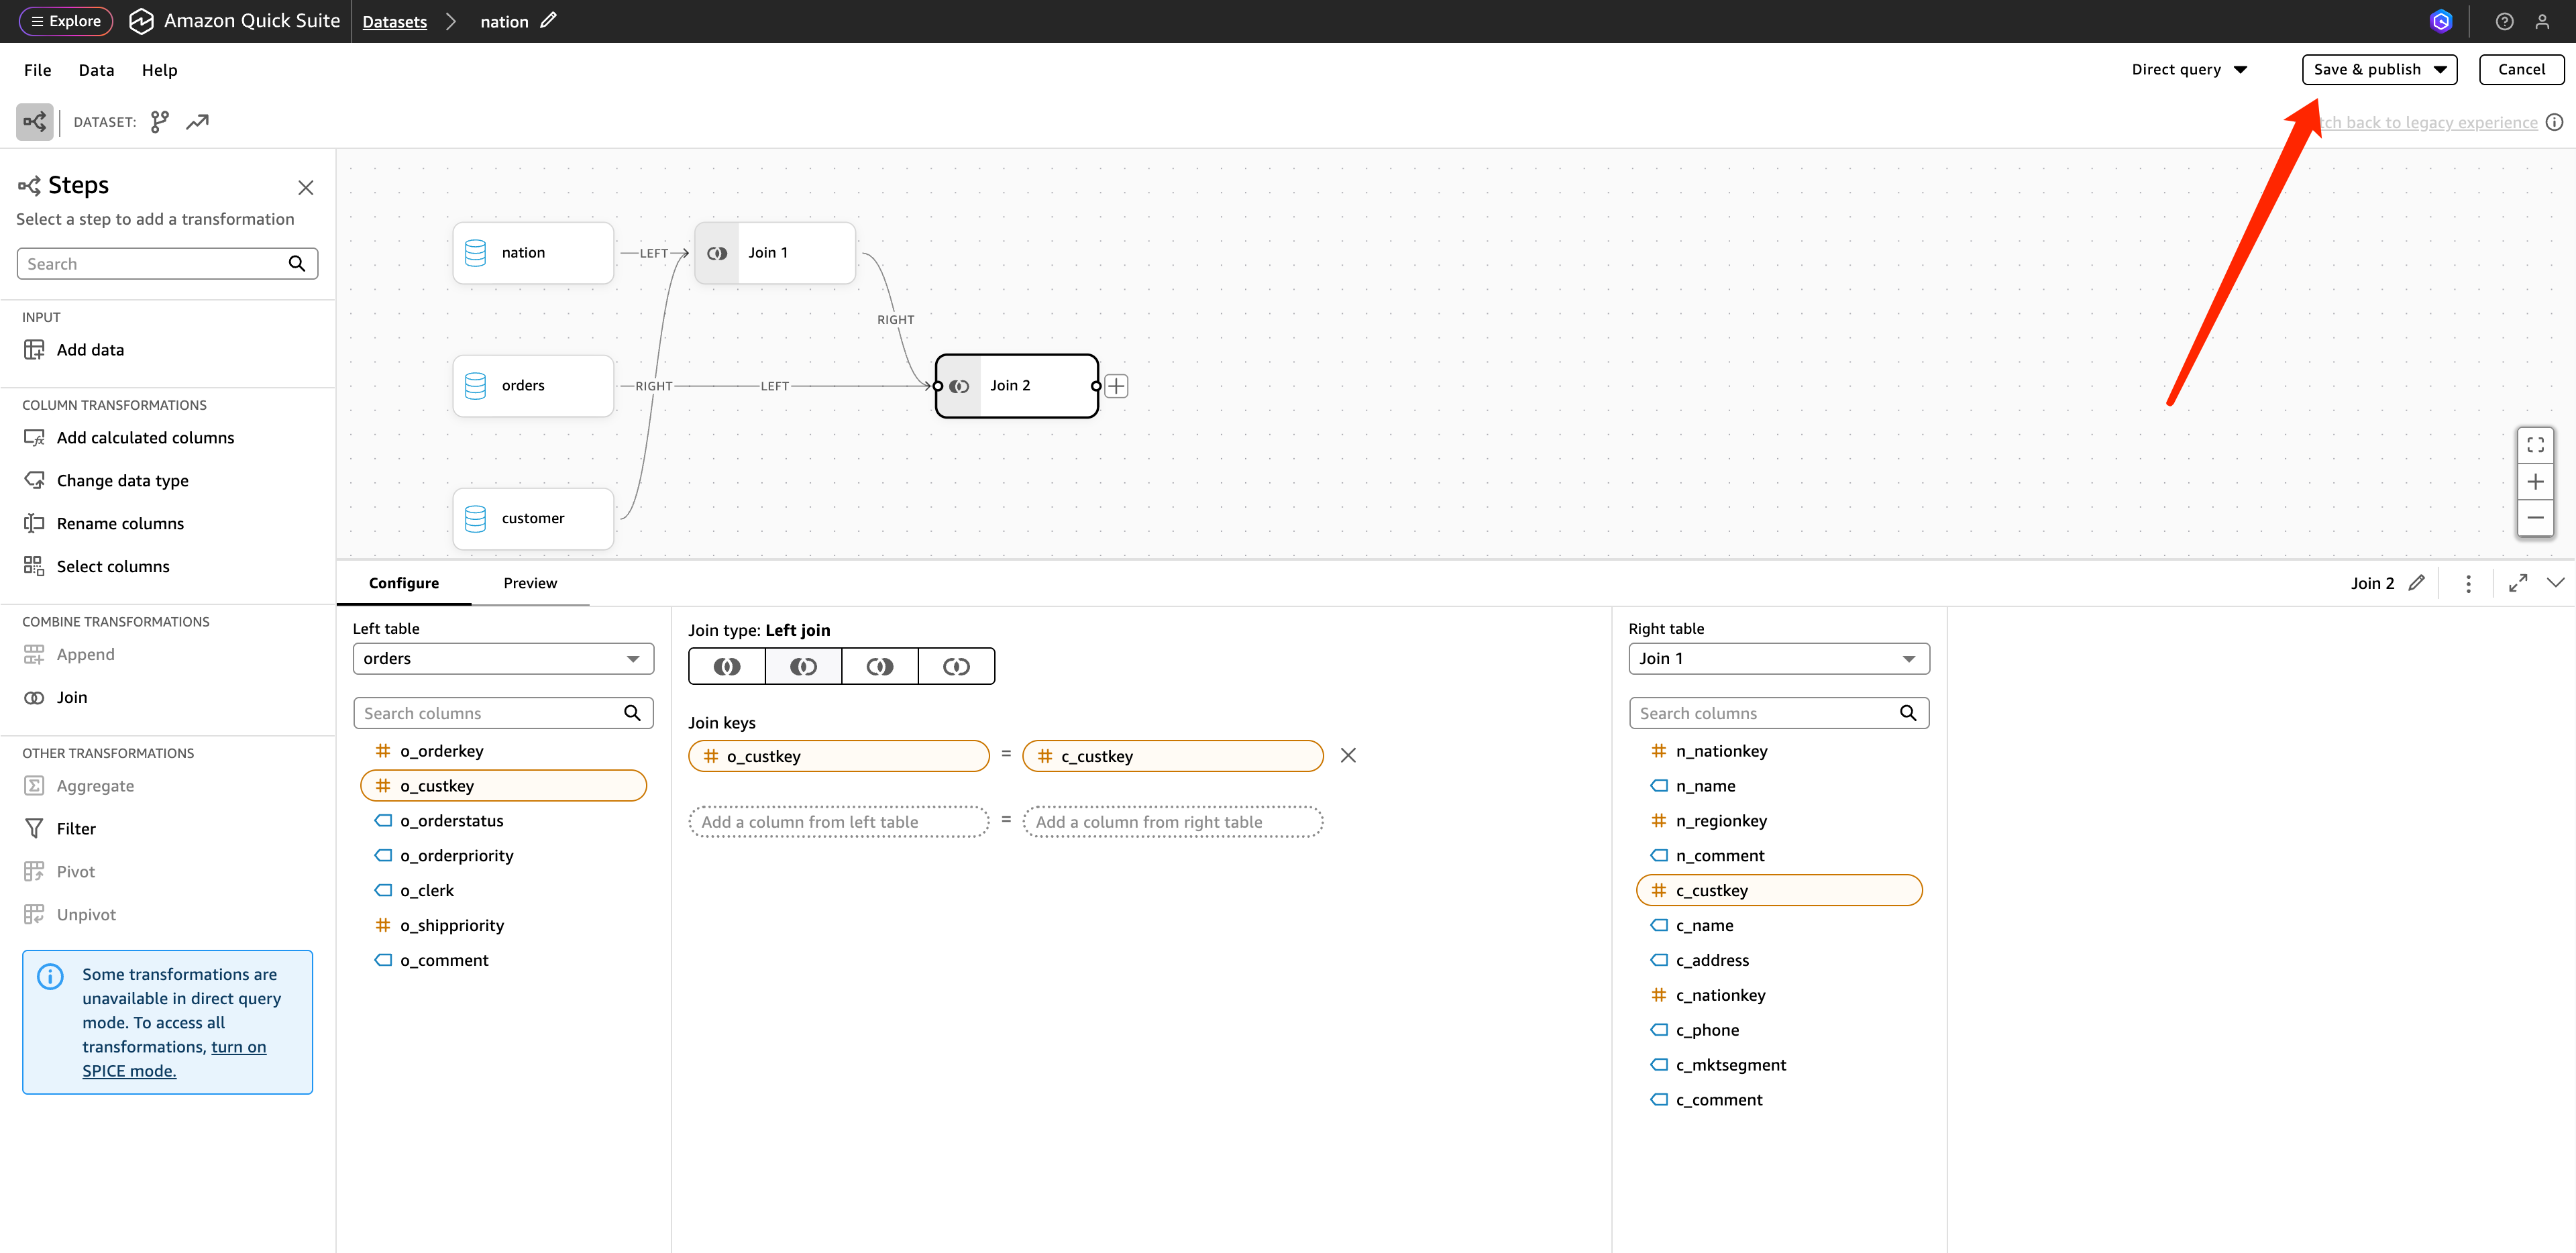
- After completion, click the nation's operation interface to enter the dataset editing interface. We will now perform column joins on the dataset.
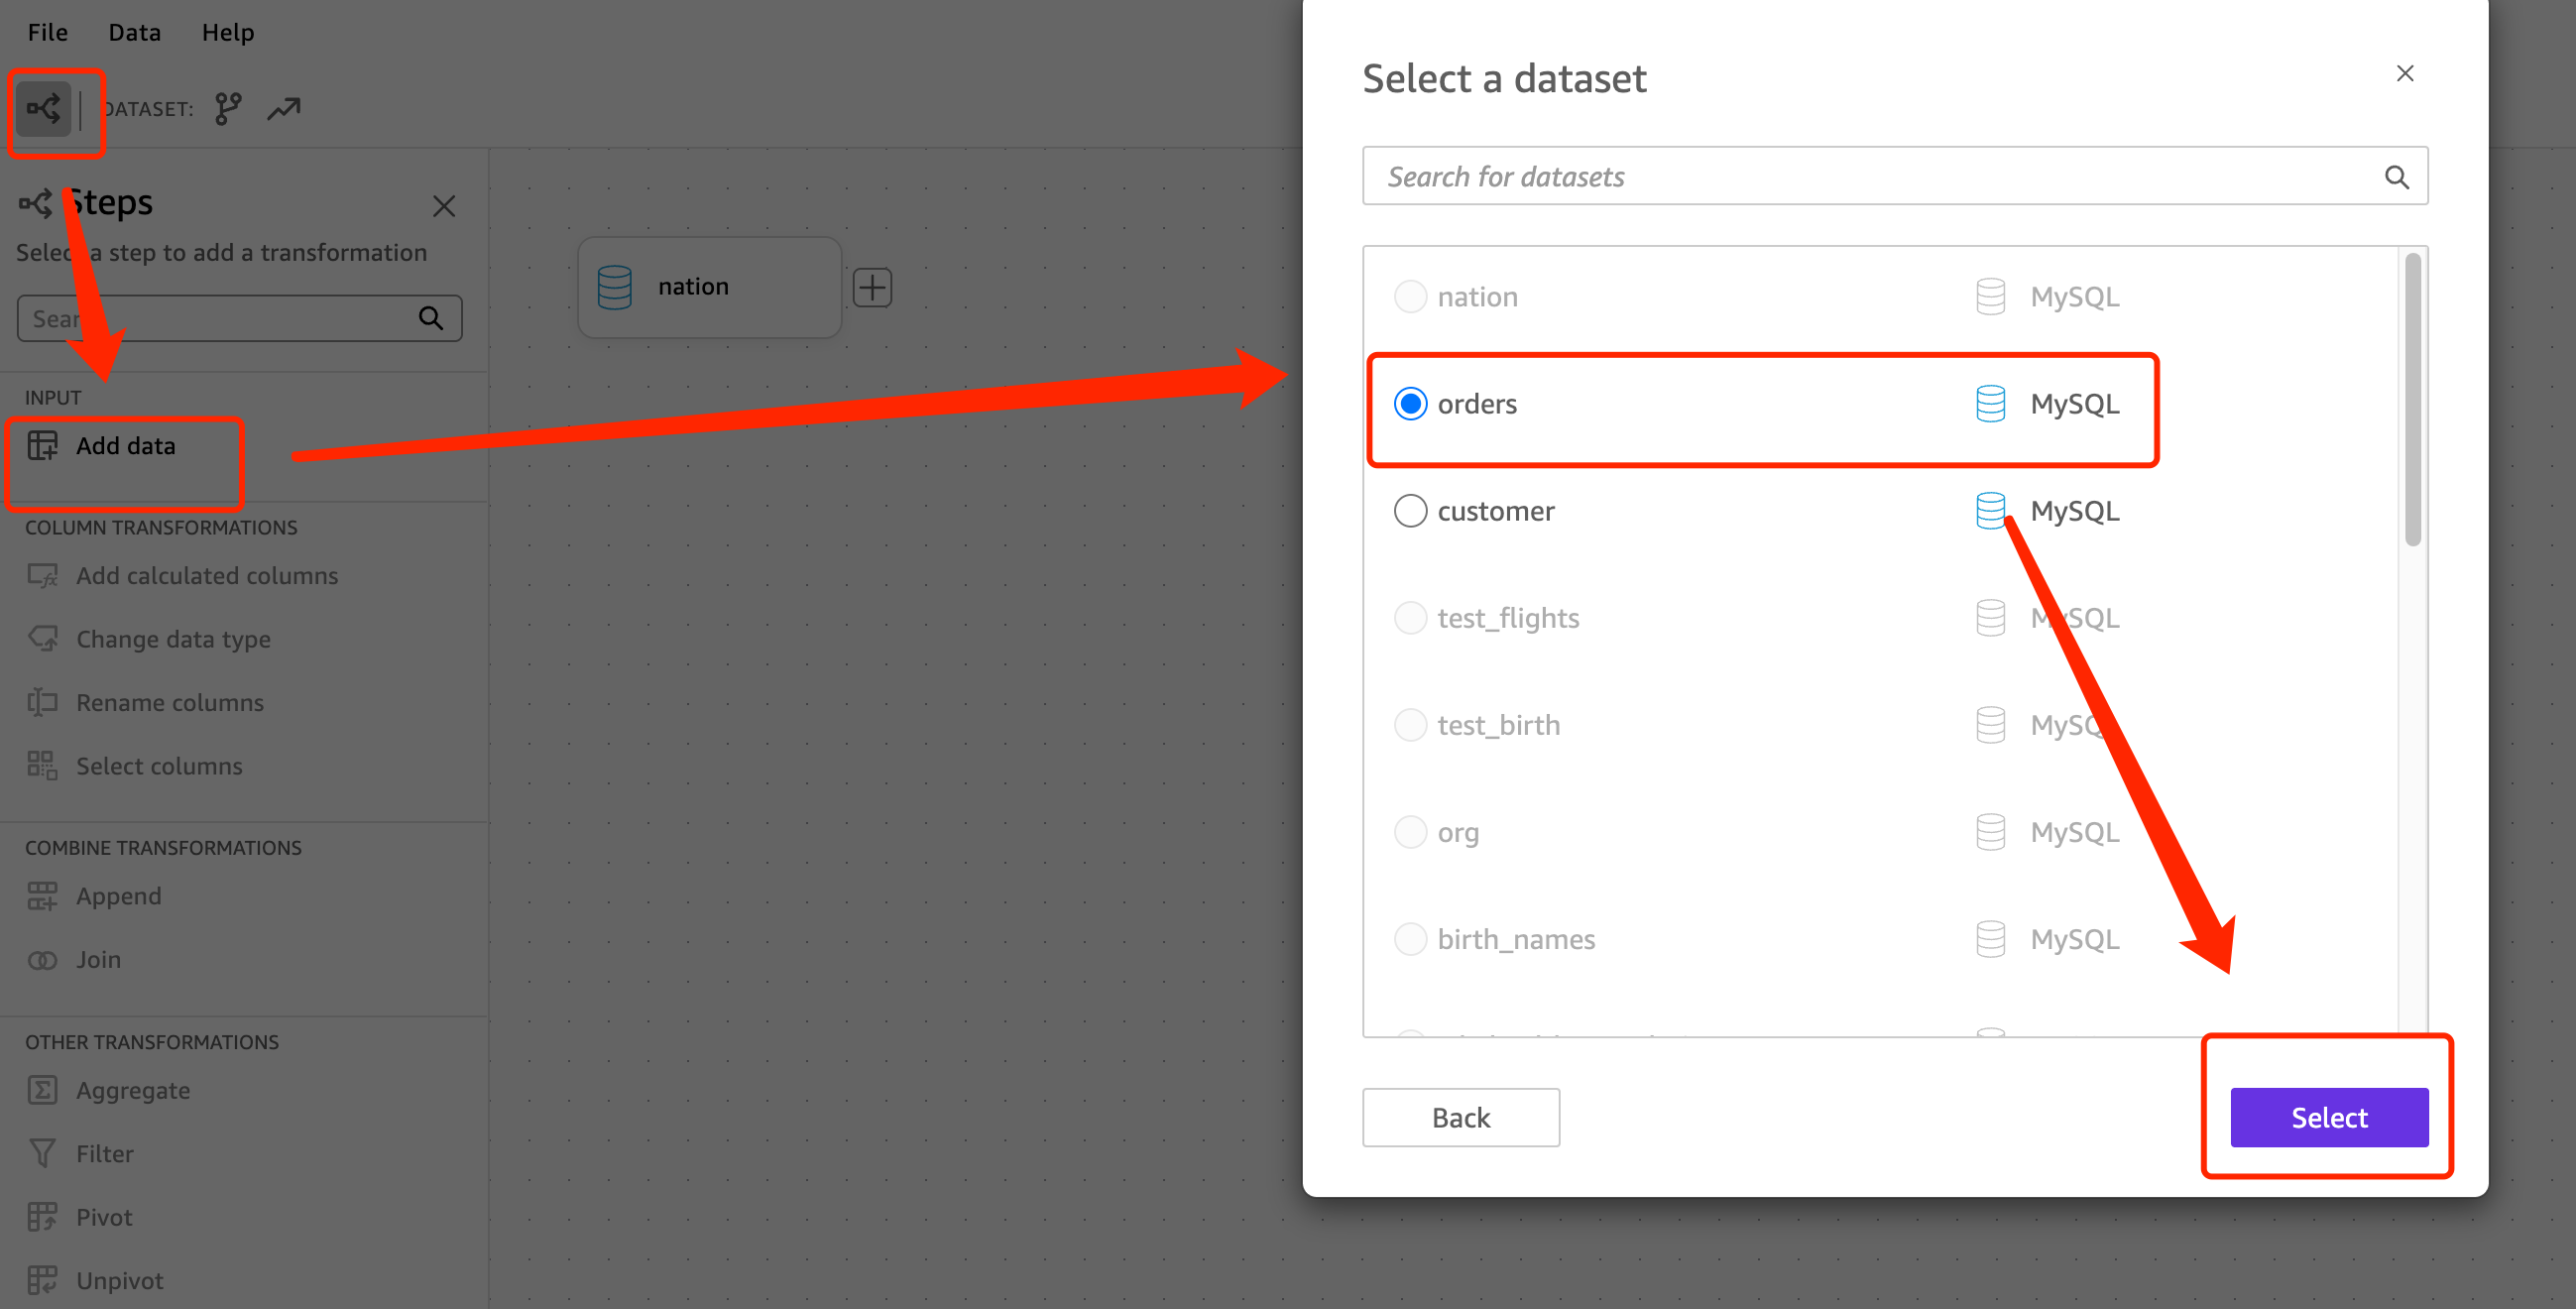
- As shown in the image, click Add data to add a data source.
- After adding the three tables, perform joins. The join relationship is as follows:
- customer :c_nationkey -- nation : n_nationkey
- customer :c_custkey -- orders : o_custkey
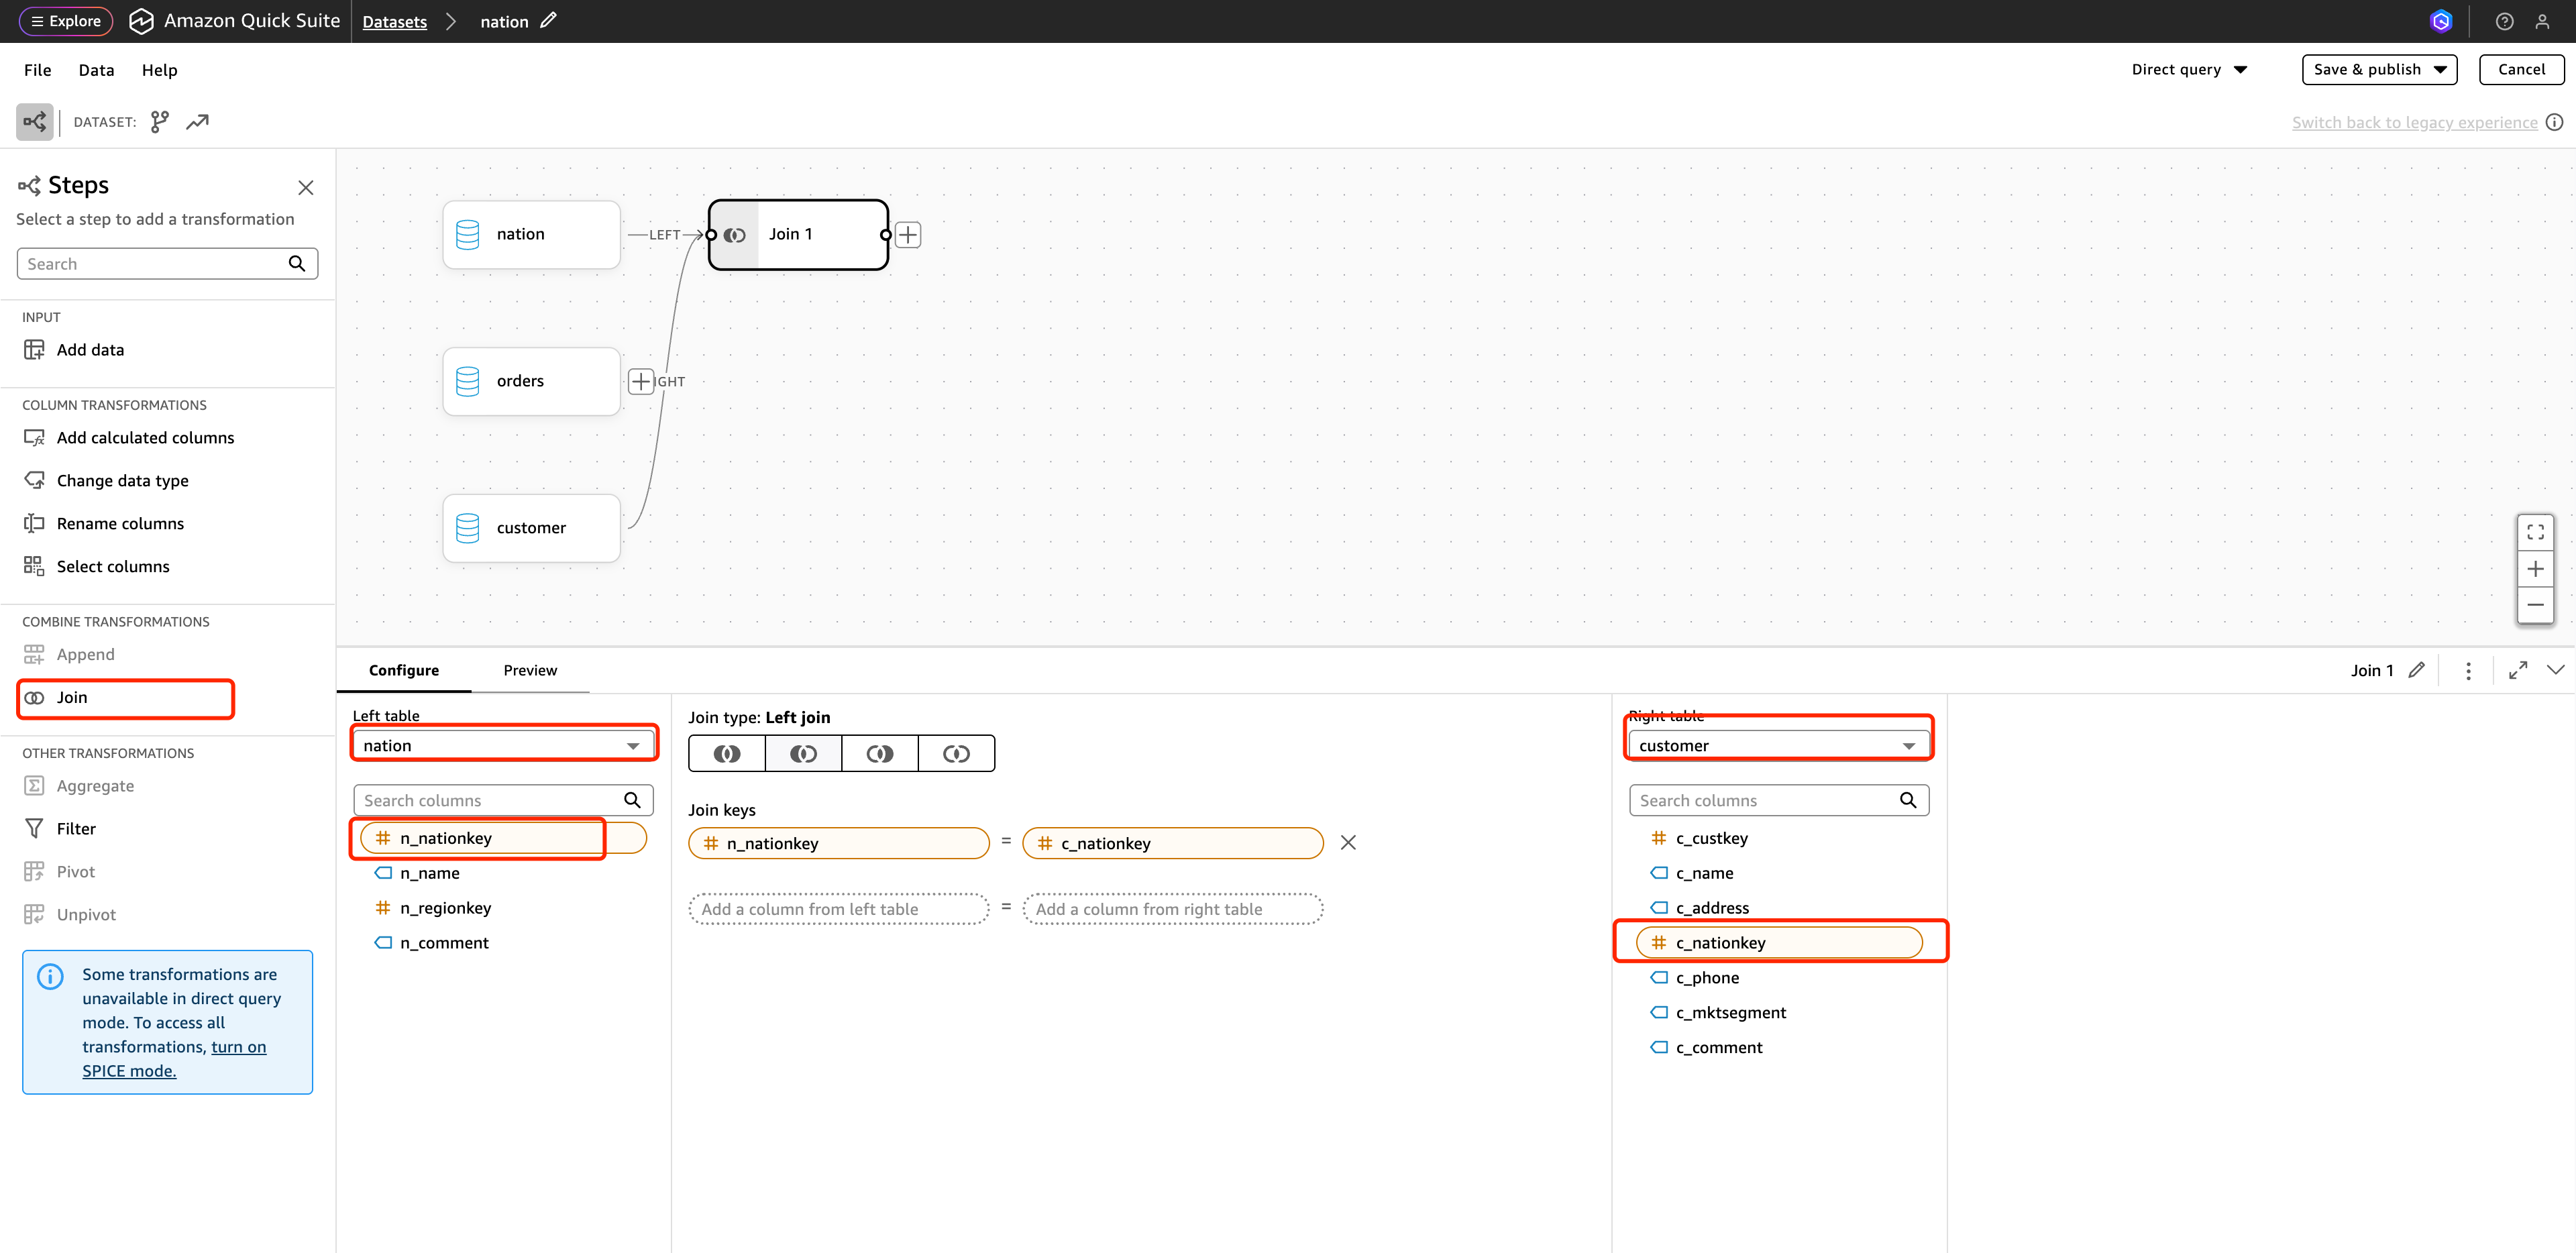
- After the join is complete, click Save & Publish in the upper right corner to publish.
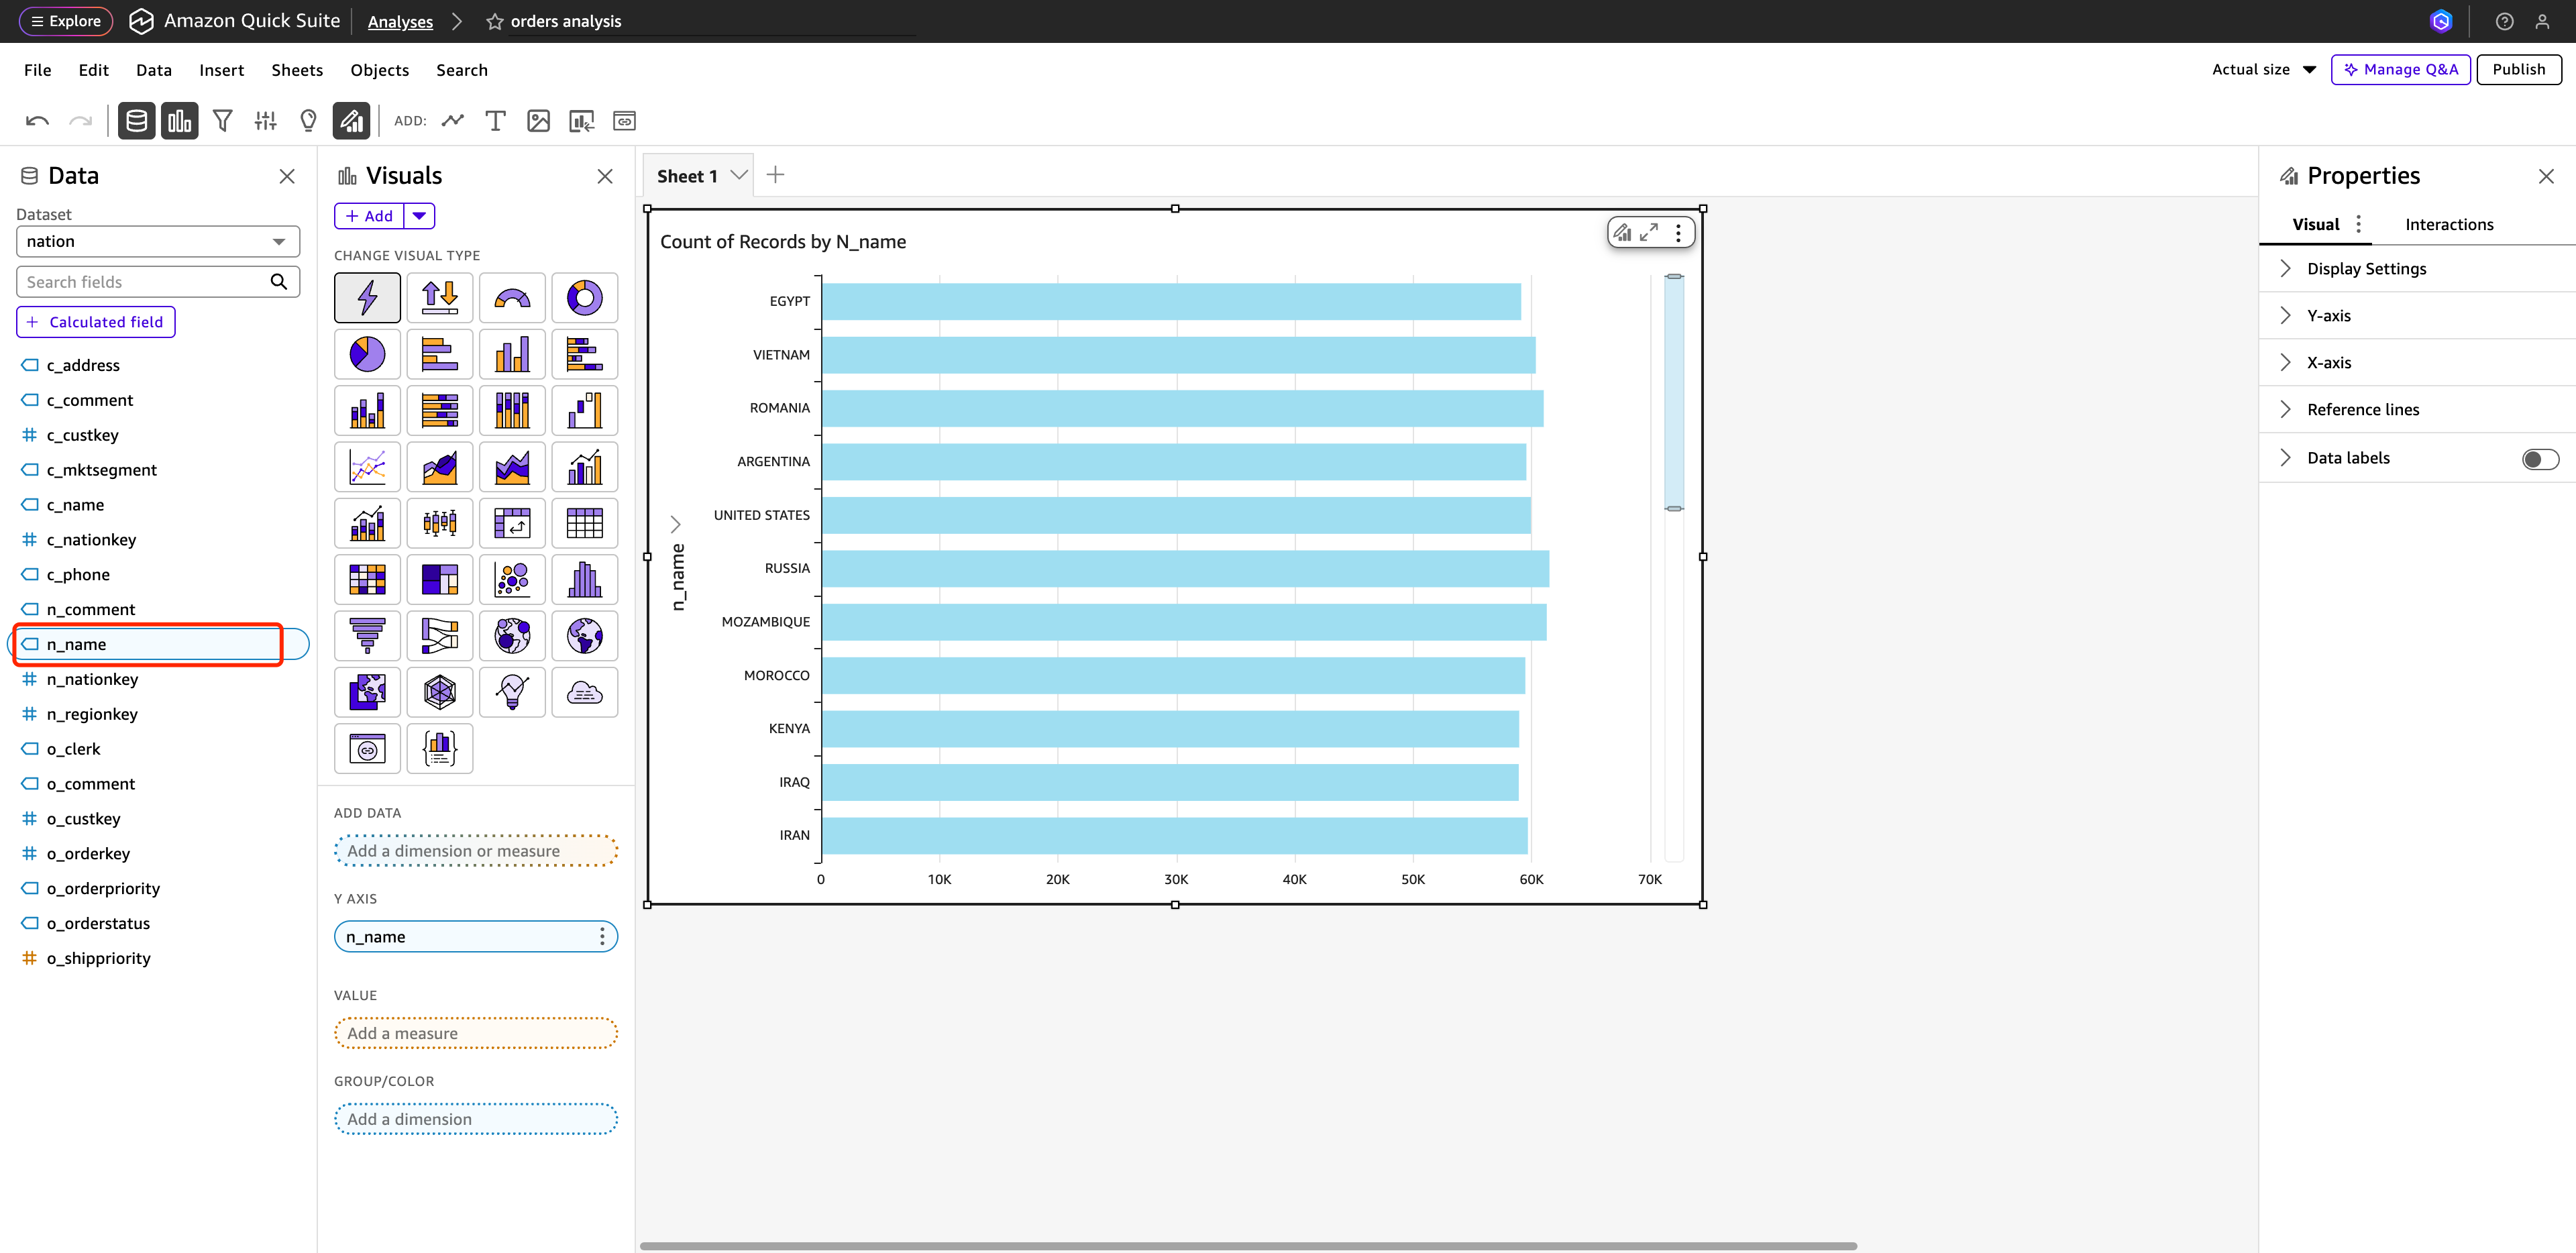
- Return to the Analyses interface where you just added the three data sources, click n_name to display the total number of orders by country name.
- Click VALUE, select o_orderkey, click GROUP/COLOR, and select o_orderstatus to obtain the demand dashboard.
- Click Publish in the upper right corner to complete the dashboard publication.
At this point, QuickSight has been successfully connected to Apache Doris, and data analysis and visualization dashboard creation have been implemented.
