
Tableau
For enabling Apache Doris access on Tableau, Tableau's official MySQL connector can meet your needs. This connector uses the MySQL JDBC driver to access data.
Through the MySQL connector, Tableau can integrate Apache Doris databases and tables as data sources. To enable this feature, follow the setup guide below:
- Required setup before use
- Configuring the Apache Doris data source in Tableau
- Building visualizations in Tableau
- Connection and usage tips
Installing Tableau and the JDBC driver
- Download and install Tableau desktop.
- Obtain MySQL JDBC (version 8.3.0).
- JDBC Driver Placement Path
- macOS: JDBC driver JAR file placement path:
~/Library/Tableau/Drivers - Windows: Assuming
tableau_pathis the Tableau installation directory on the Windows operating system, generally the default is:tableau_path = C:\Program Files\Tableau, then the JDBC driver JAR file placement path is:%tableau_path%\Drivers\
- macOS: JDBC driver JAR file placement path:
Next, you can configure a Doris data source in Tableau and start building data visualizations!
Configuring a Doris Data Source in Tableau
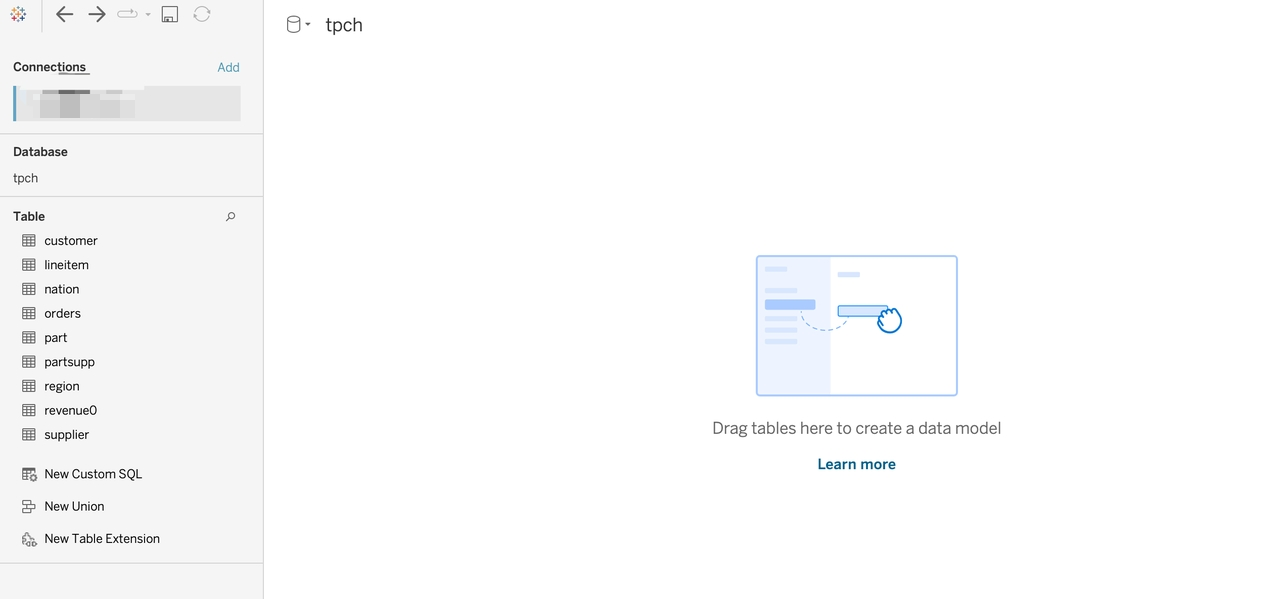
Now that you have installed and set up the JDBC and Connector drivers, let's see how to define a data source in Tableau that connects to the tpch database in Doris.
- Gathering Your Connection Details
To connect to Apache Doris via JDBC, you need the following information:
| Parameter | Meaning | Example |
|---|---|---|
| Server | Database host | 127.0.1.28 |
| Port | Database MySQL port | 9030 |
| Database | Database name | tpch |
| Username | Username | testuser |
| Password | Password | Leave blank |
| Init SQL Statement | Initial SQL statement | select * from database.table |
- Start Tableau. (If you are already running it, please restart it.)
- From the left-hand menu, click More under the To a Server section. Search for mysql in the list of available connectors.
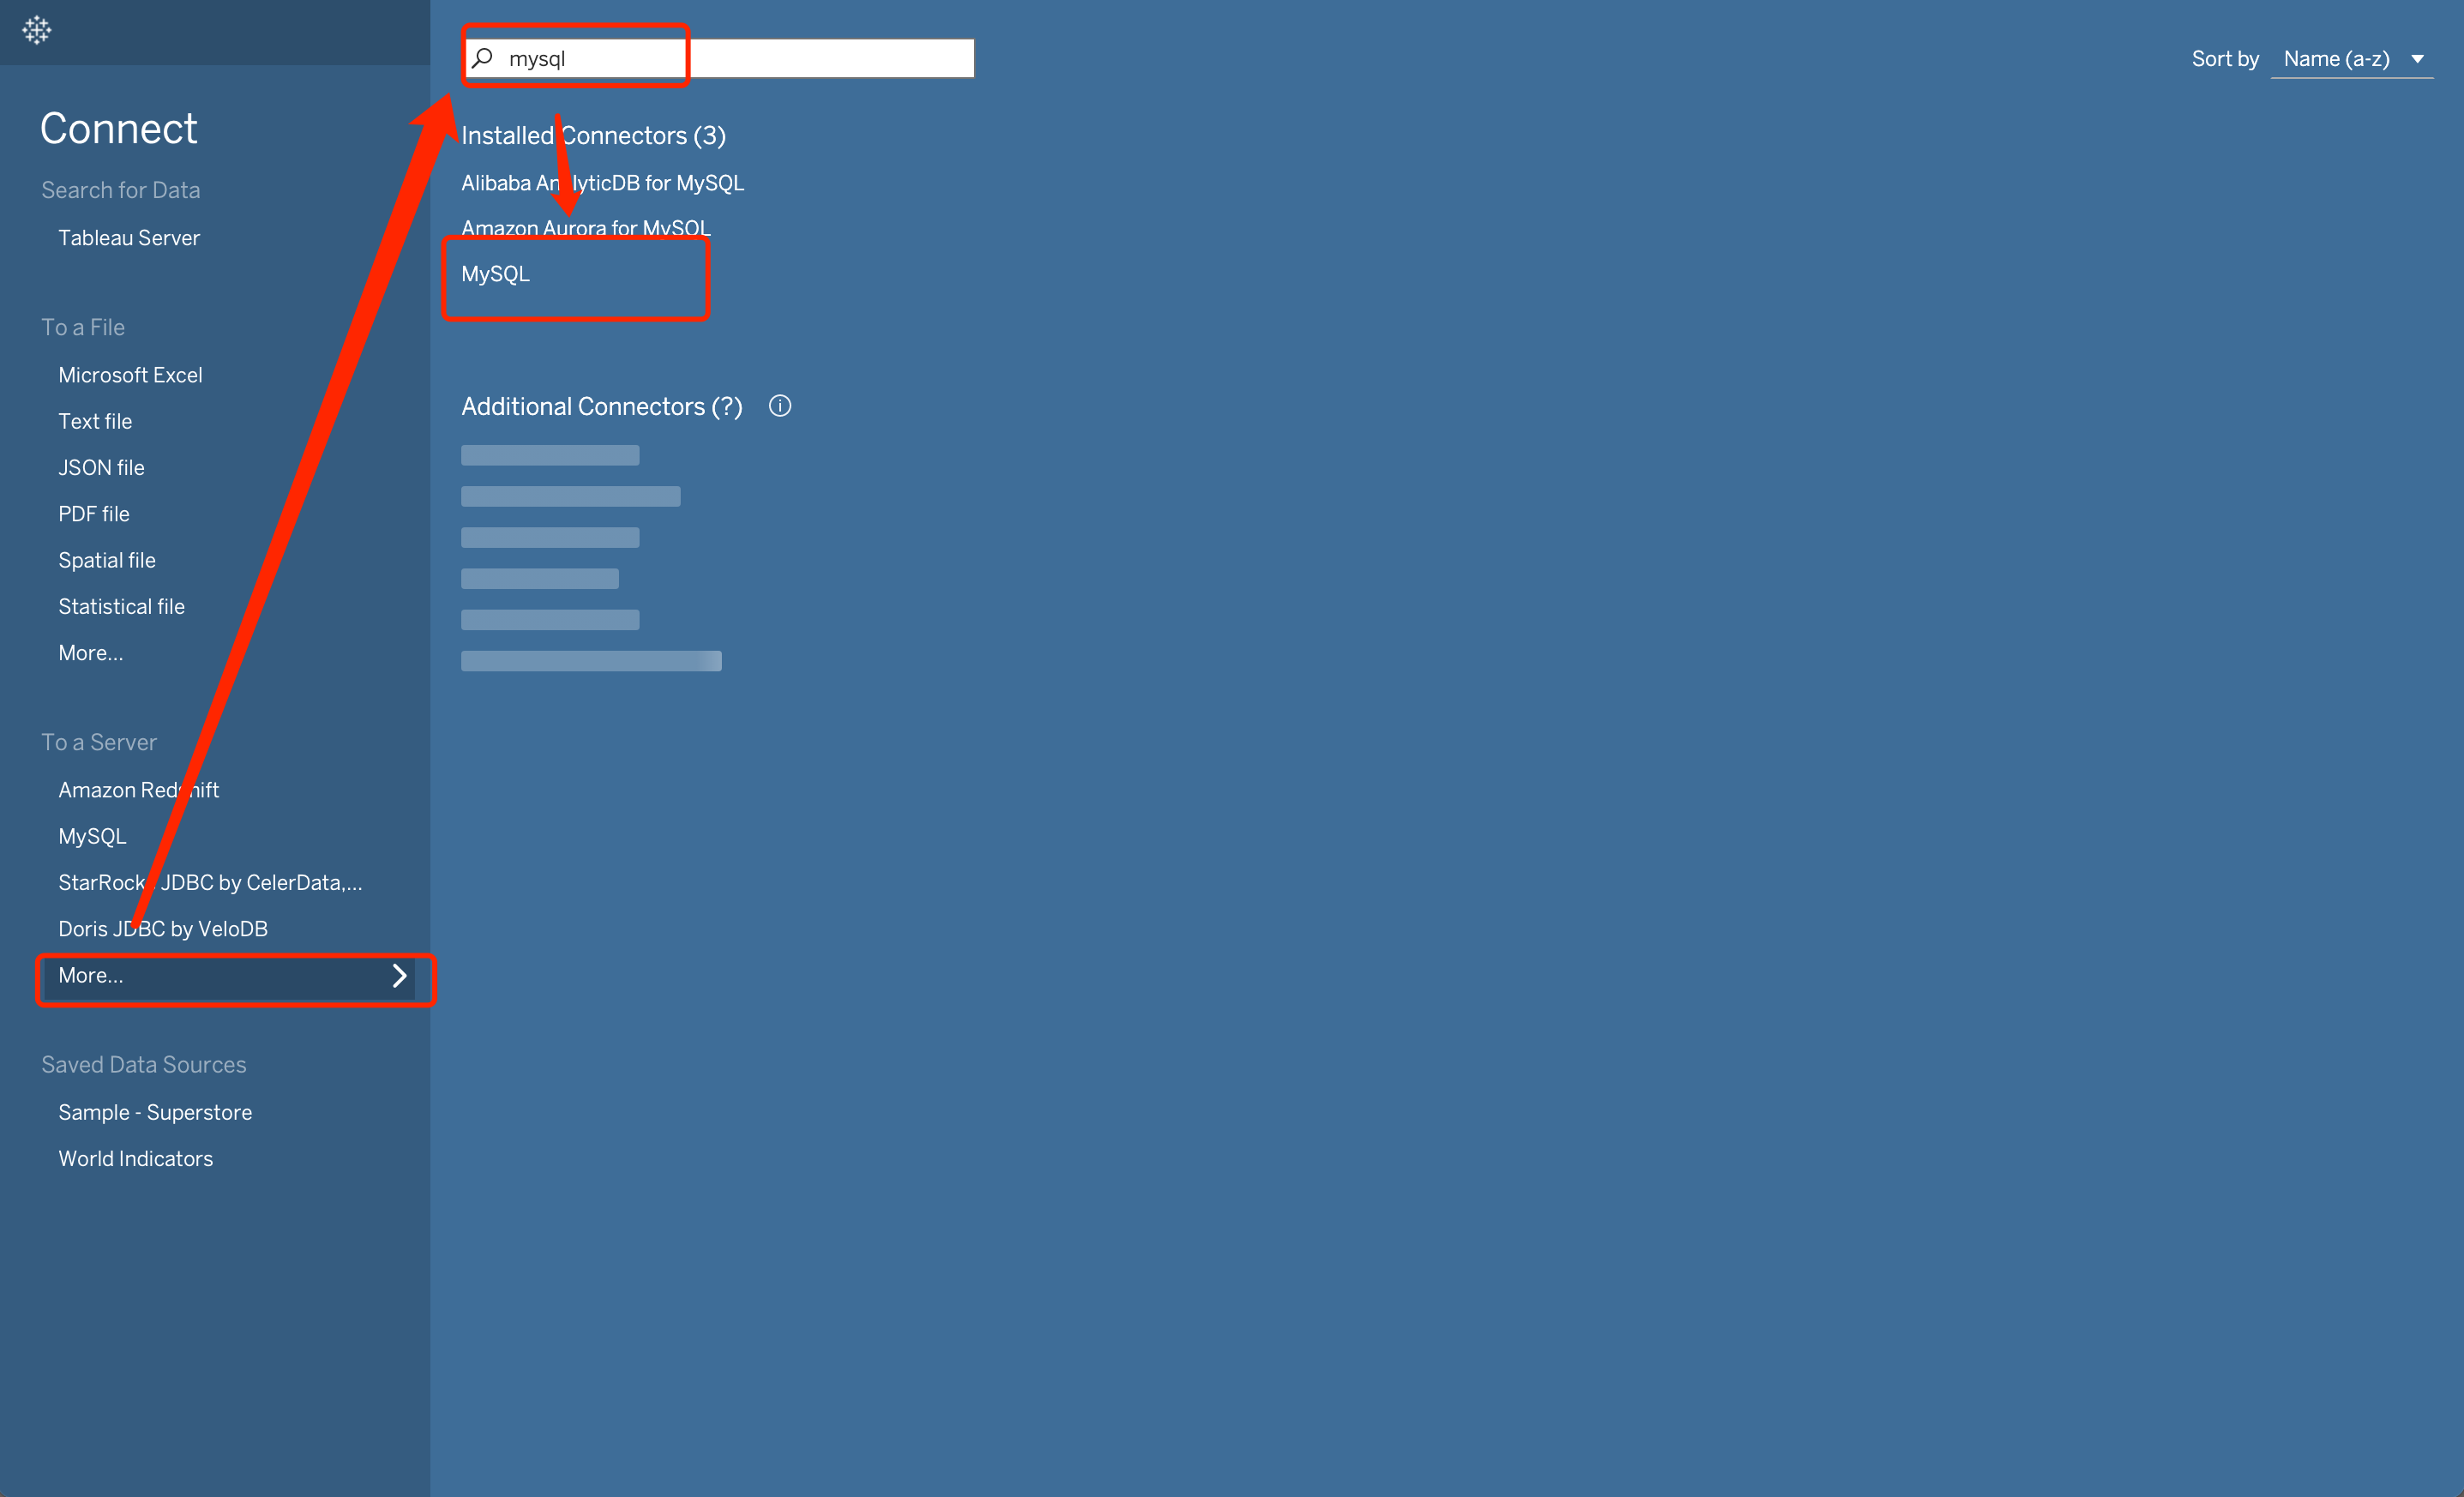
- Clicking MySQL will bring up the following dialog box:
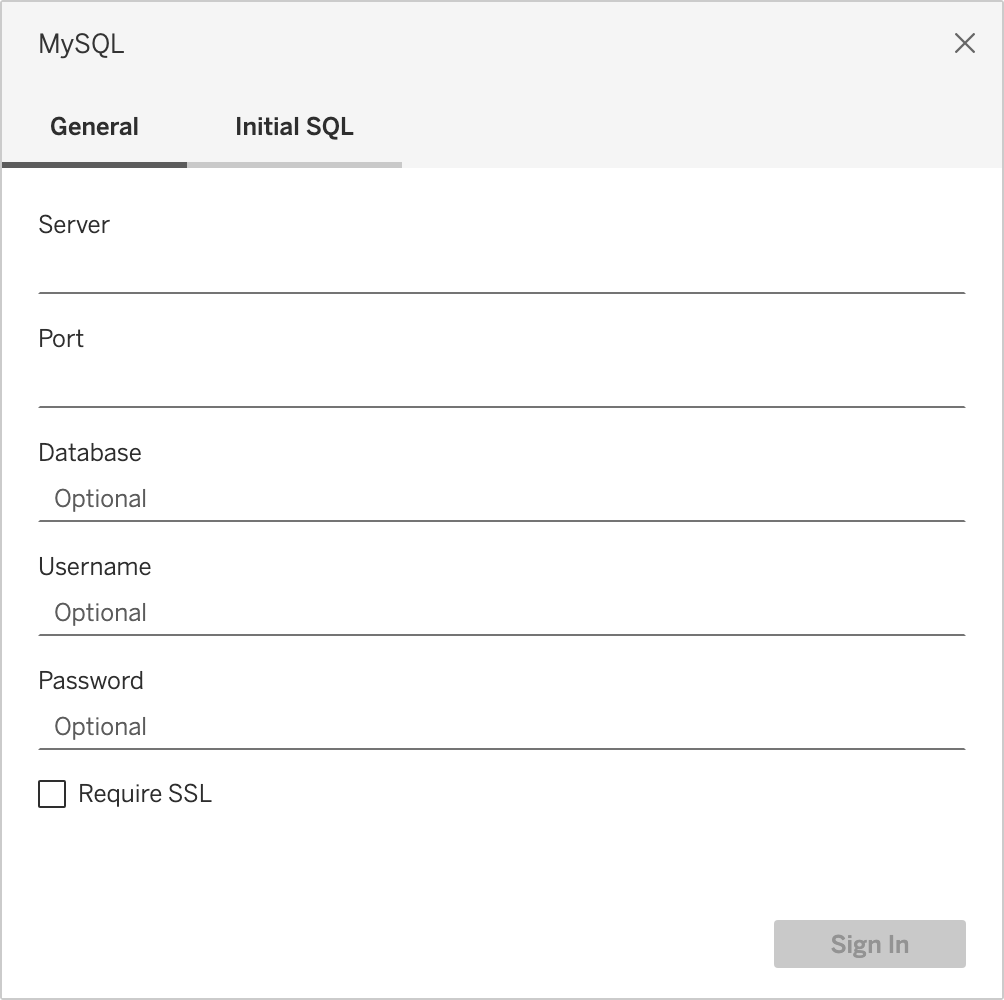
- Follow the prompts in the dialog box to enter the corresponding connection information.
- After completing the above input boxes, click the Sign In button. You should then see a new Tableau workbook.
Next, we can build some visualizations in Tableau!
Building Visualizations in Tableau
We've chosen TPC-H data as our data source. For instructions on building a Doris TPC-H data source, refer to this document.
Now that we've configured the Doris data source in Tableau, let's visualize the data.
- Drag the
customerandorderstables into the workbook. Then, select theCustkeyfield for the table association below.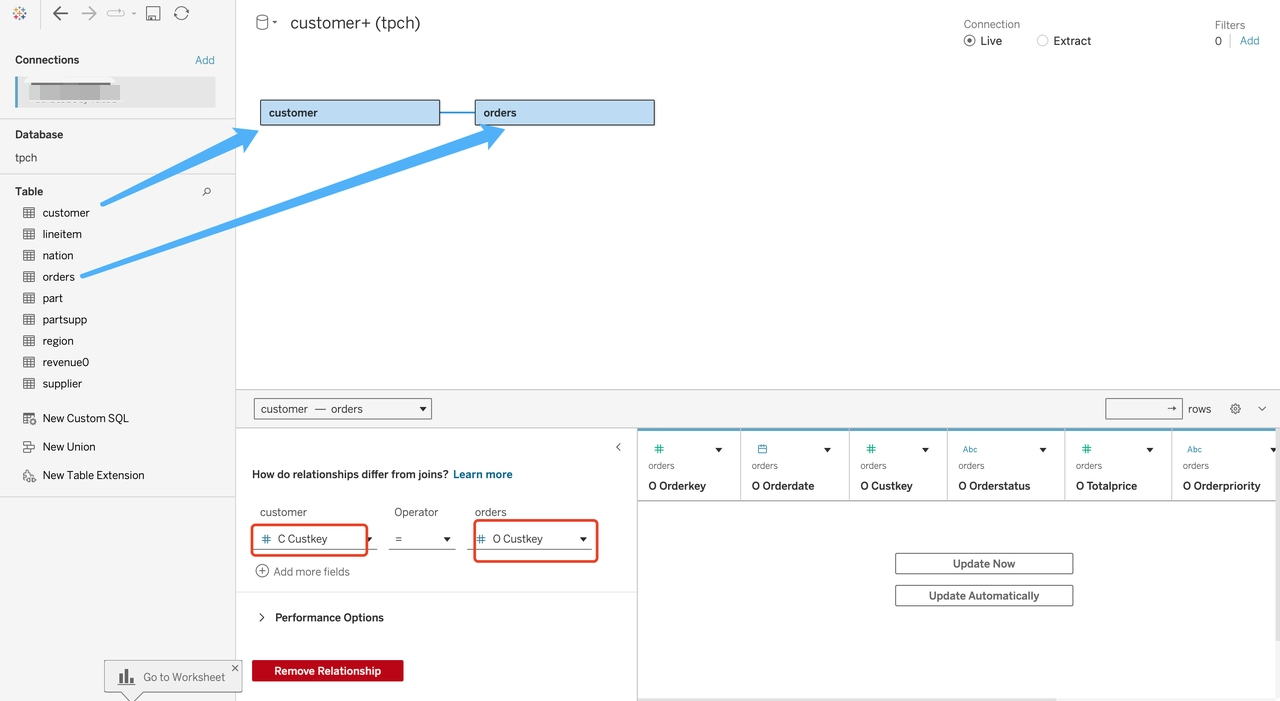
- Drag the
nationtable into the workbook and associate it with thecustomertable by selecting theNationkeyfield.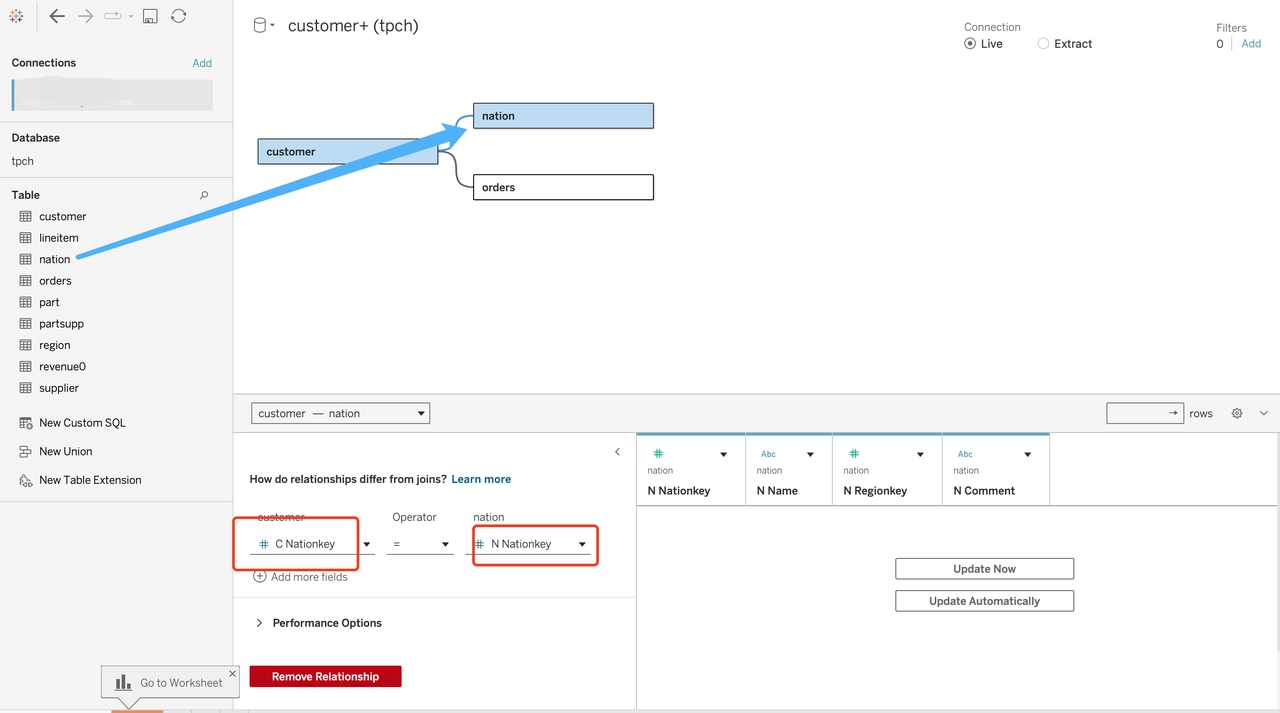
- Now you have linked the
customer,orders, andnationtables as data sources, so you can use this relationship to work on data-related issues. Select theSheet 1tab at the bottom of the workbook to access the workbench.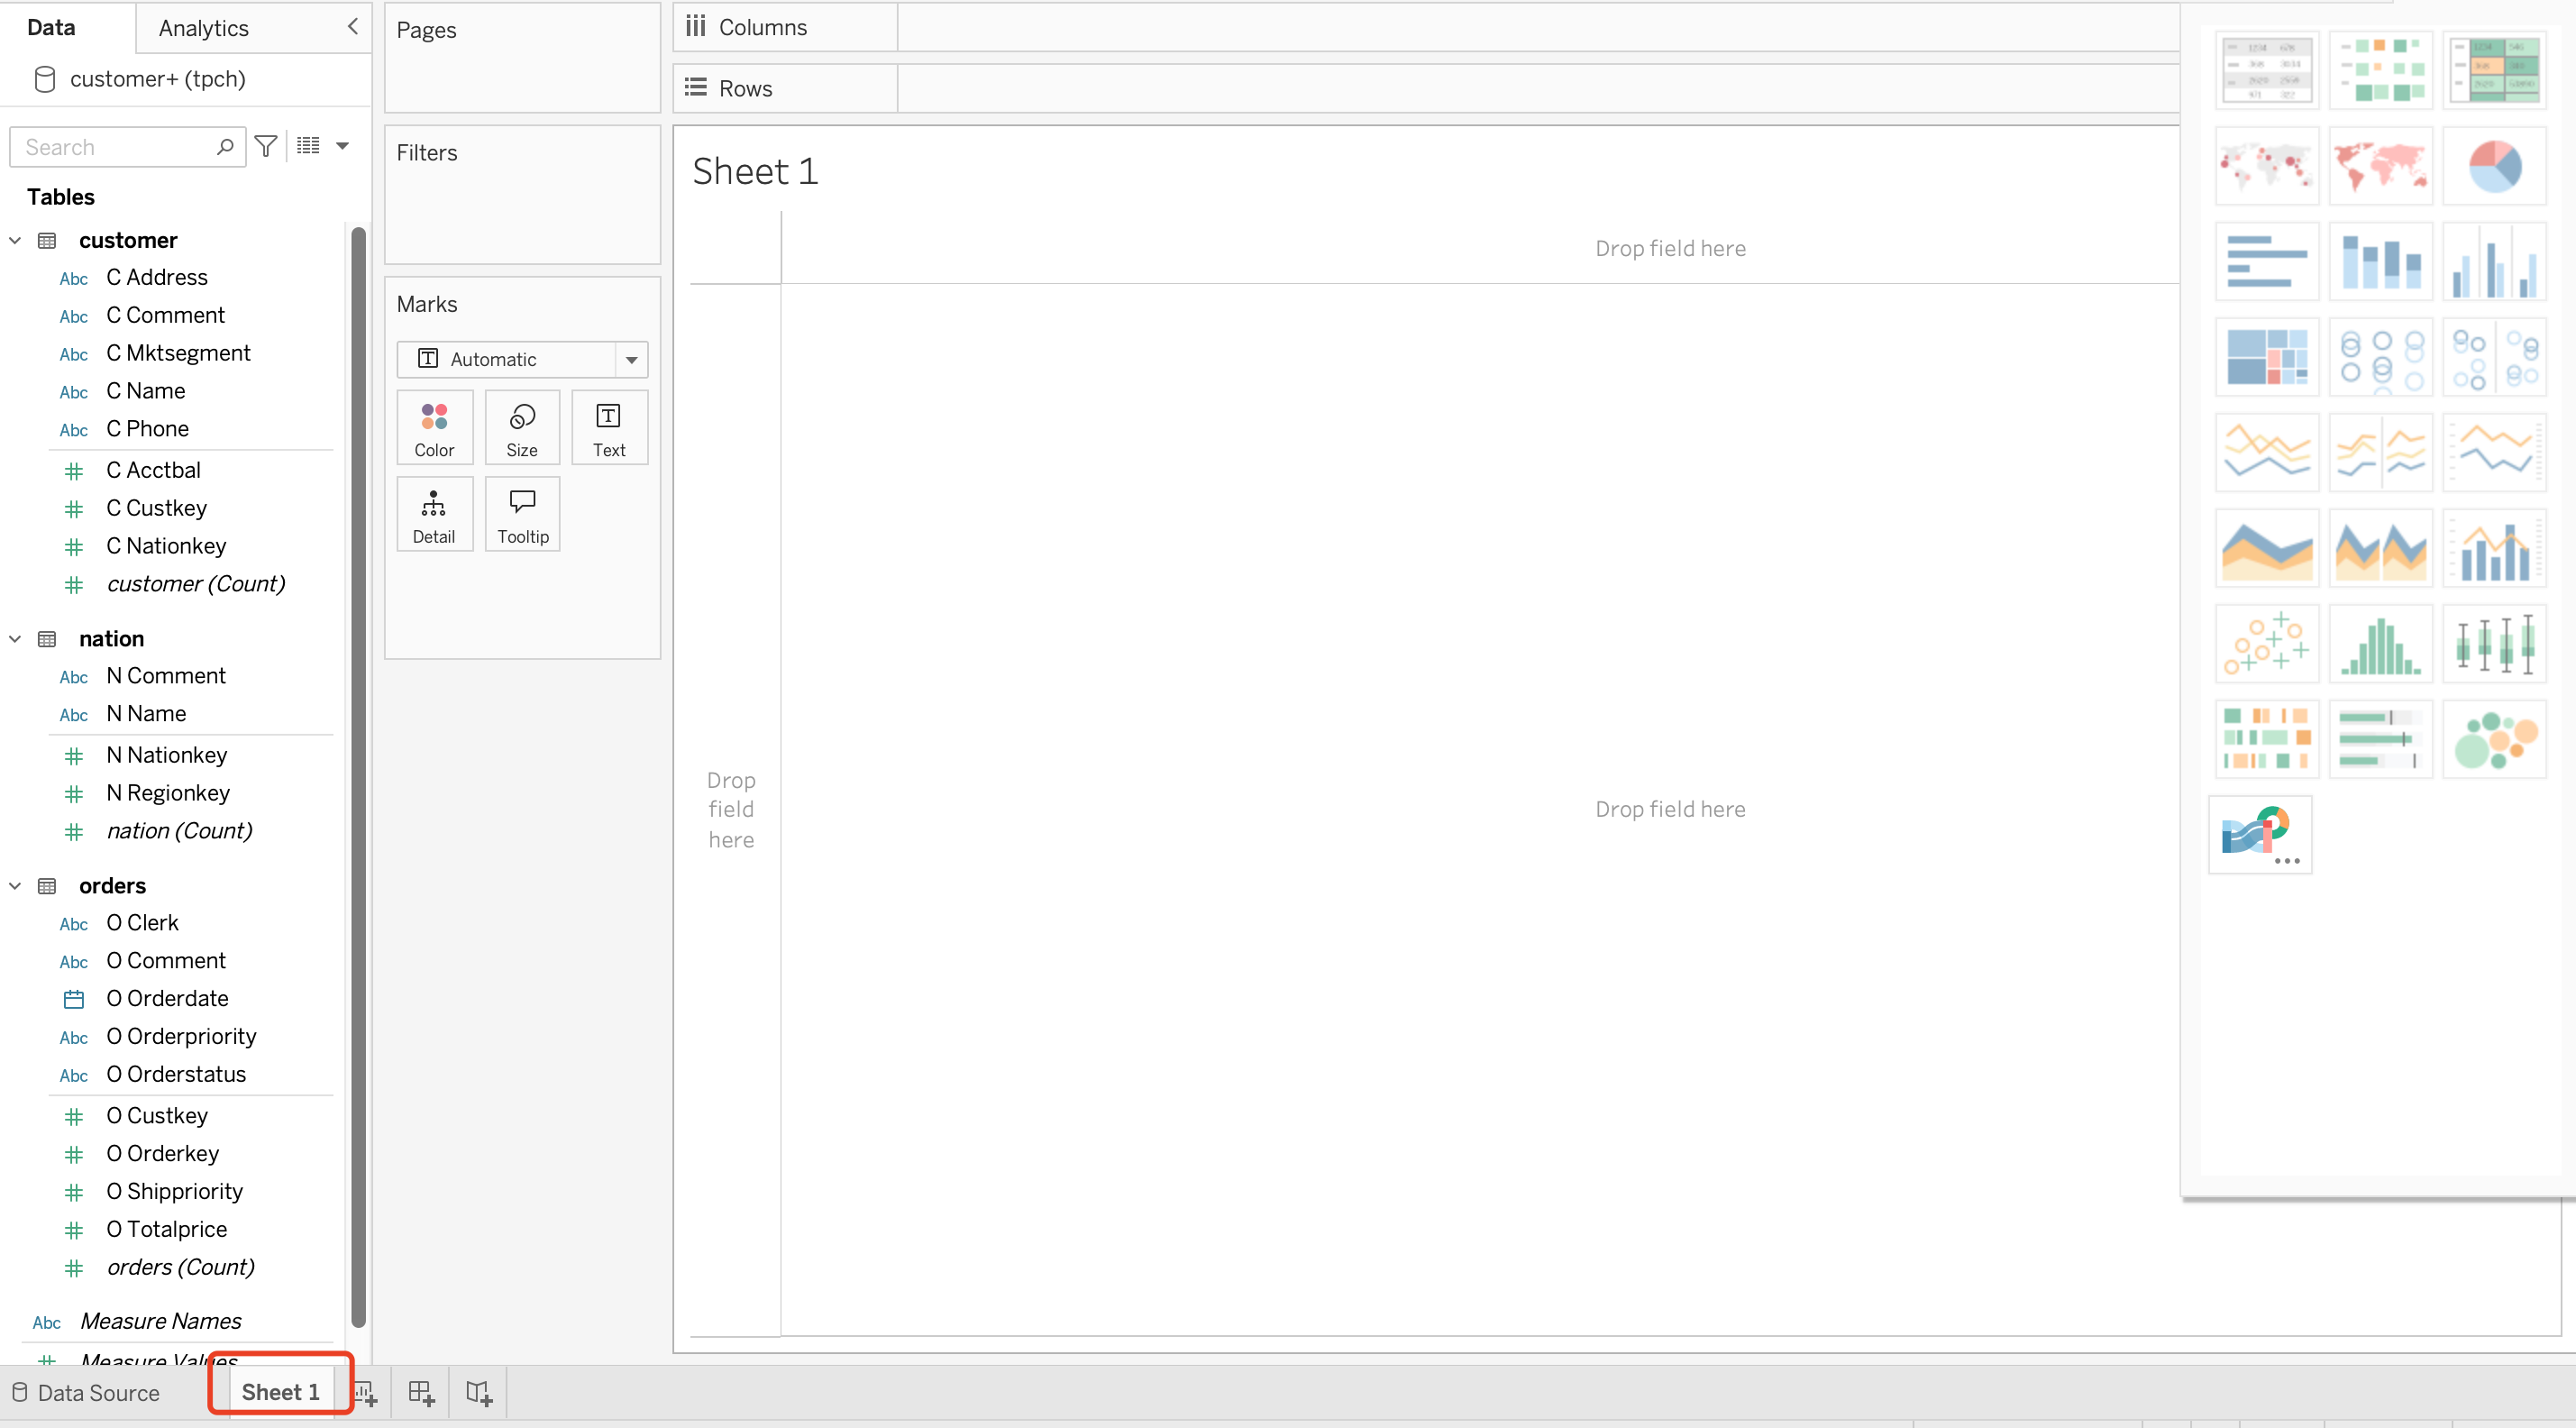
- Suppose you want to know the total number of users each year. Drag OrderDate from orders to the Columns area (a horizontal field), and then drag customer(count) from customer to Rows. Tableau will generate the following line chart:
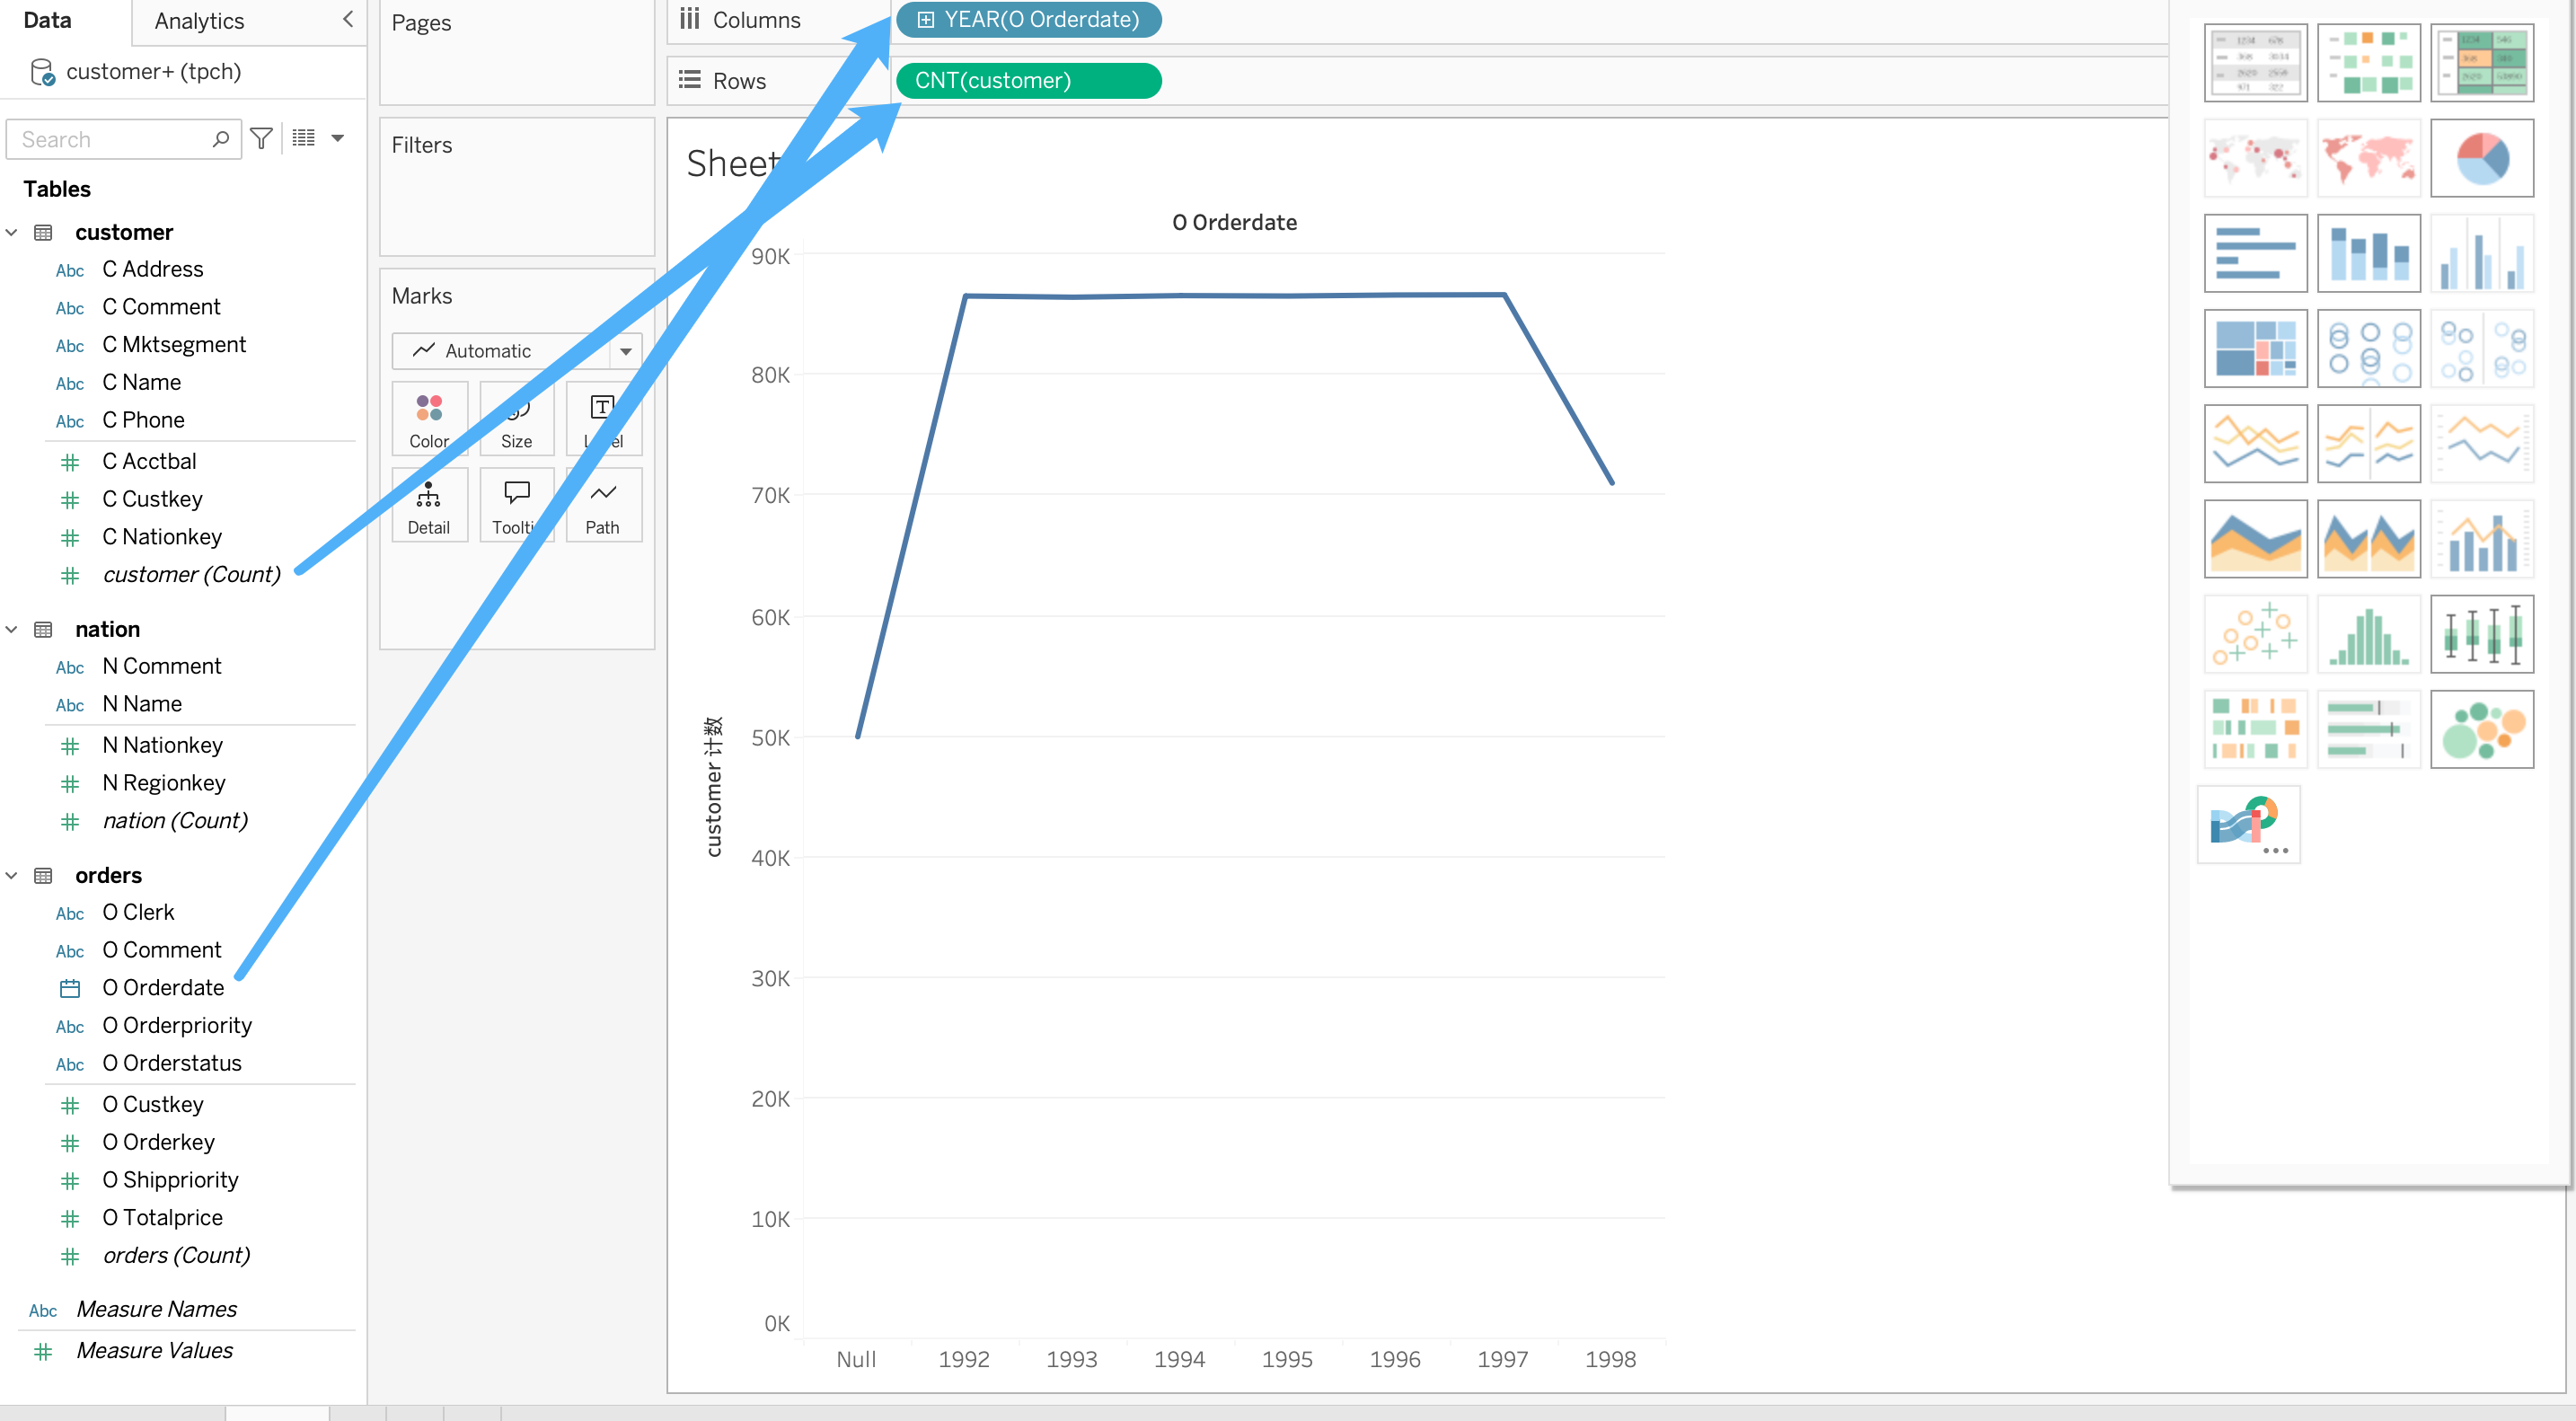
A simple line chart is now complete. However, this dataset is not real data and was automatically generated by the tpch script and default rules; it is intended for testing usability.
- Suppose you want to know the average order amount (USD) by region (country) and year:
- Click the
New Worksheettab to create a new table - Drag Name from the nation table into
Rows - Drag OrderDate from the orders table into
Columns
- Click the
You should see the following:
- Note: The
Abcvalue is just a populated value because you haven't defined the aggregation logic to this icon, so you need to drag the measure onto the table. Drag Totalprice from the orders table to the middle of the table. Note that the default calculation is a SUM on Totalprices: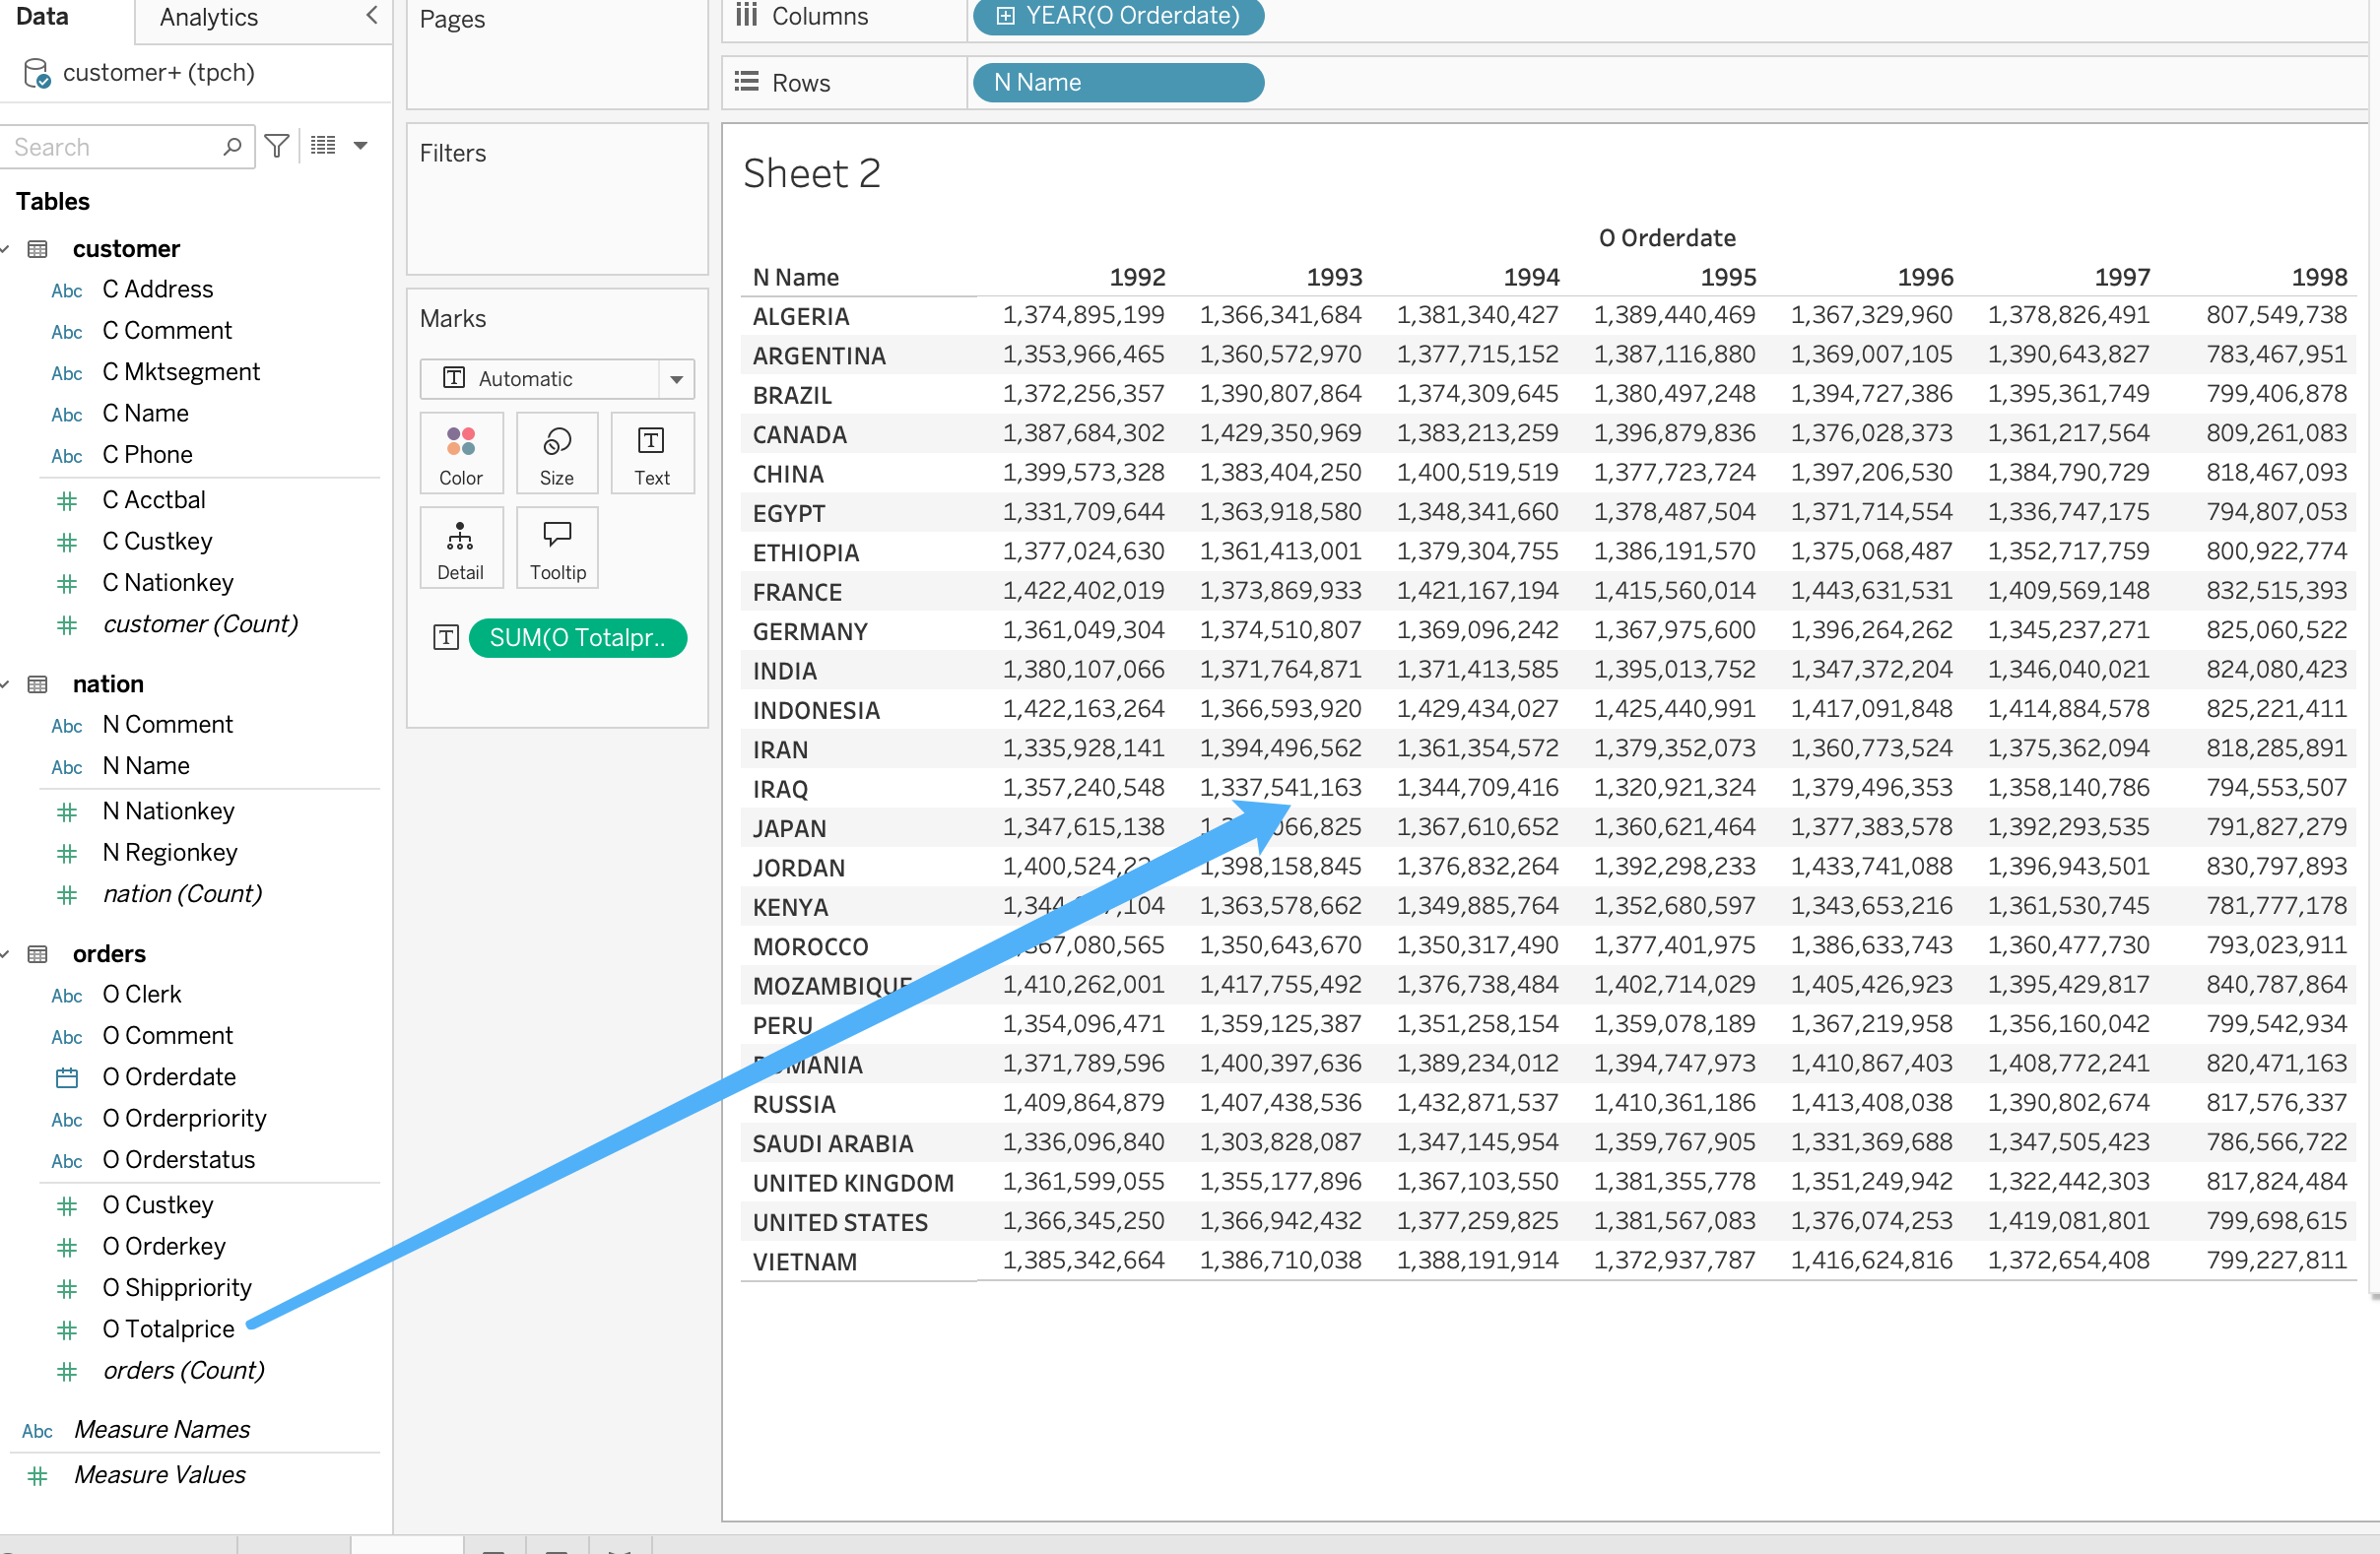
- Click
SUMand changeMeasuretoAverage.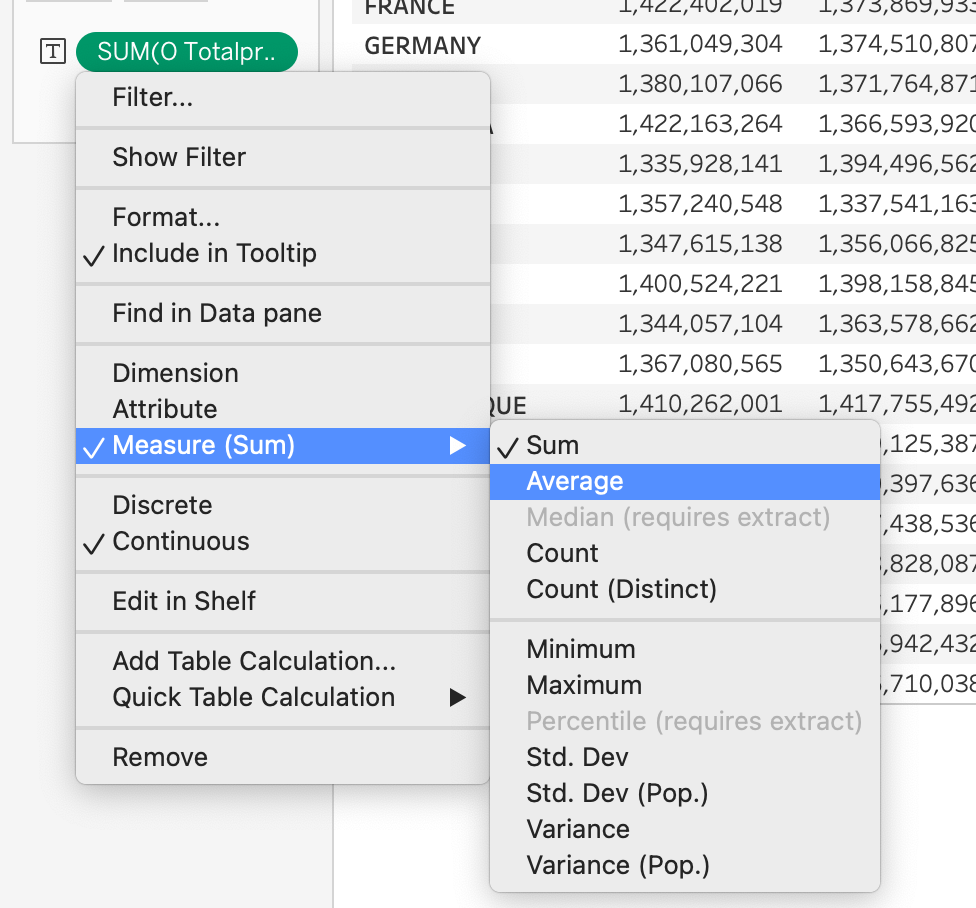
- From the same drop-down menu, select
Formatand changeNumberstoCurrency (Standard)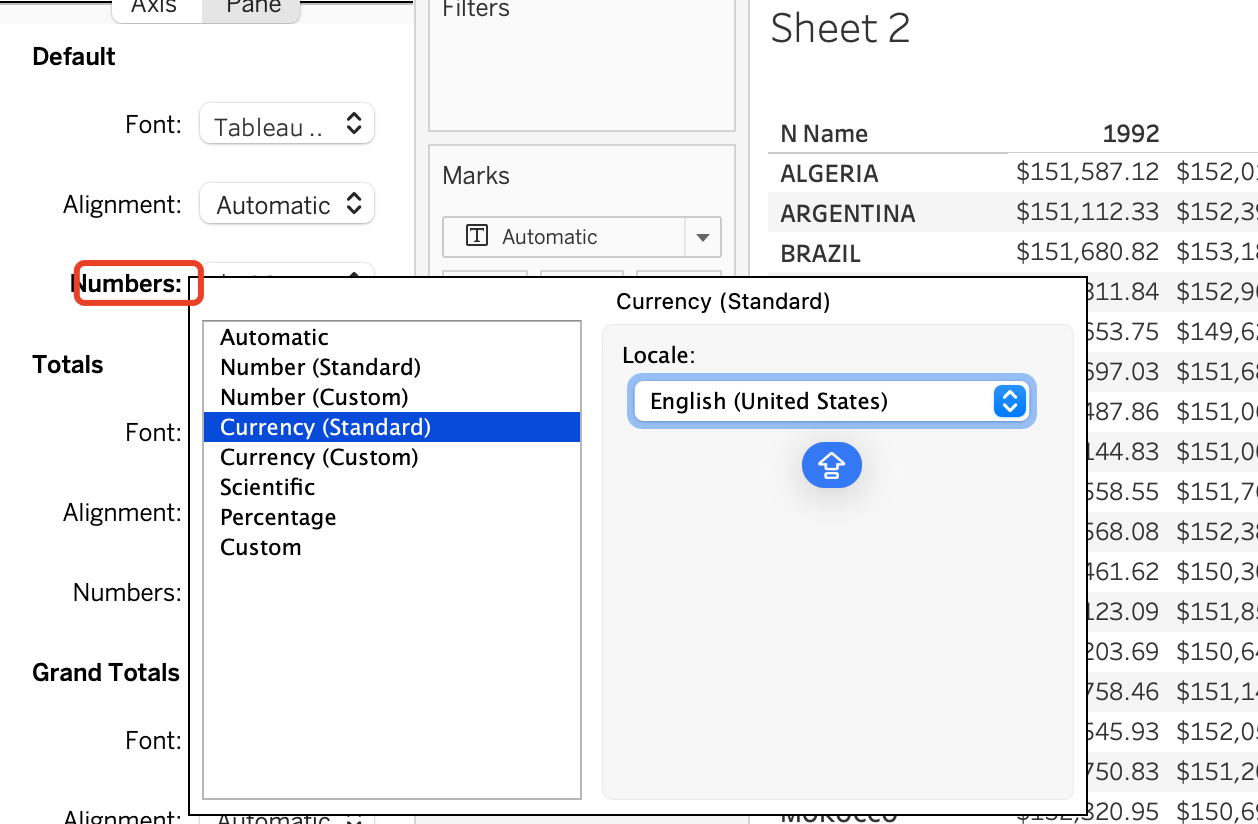
- You will get a table that meets your expectations.
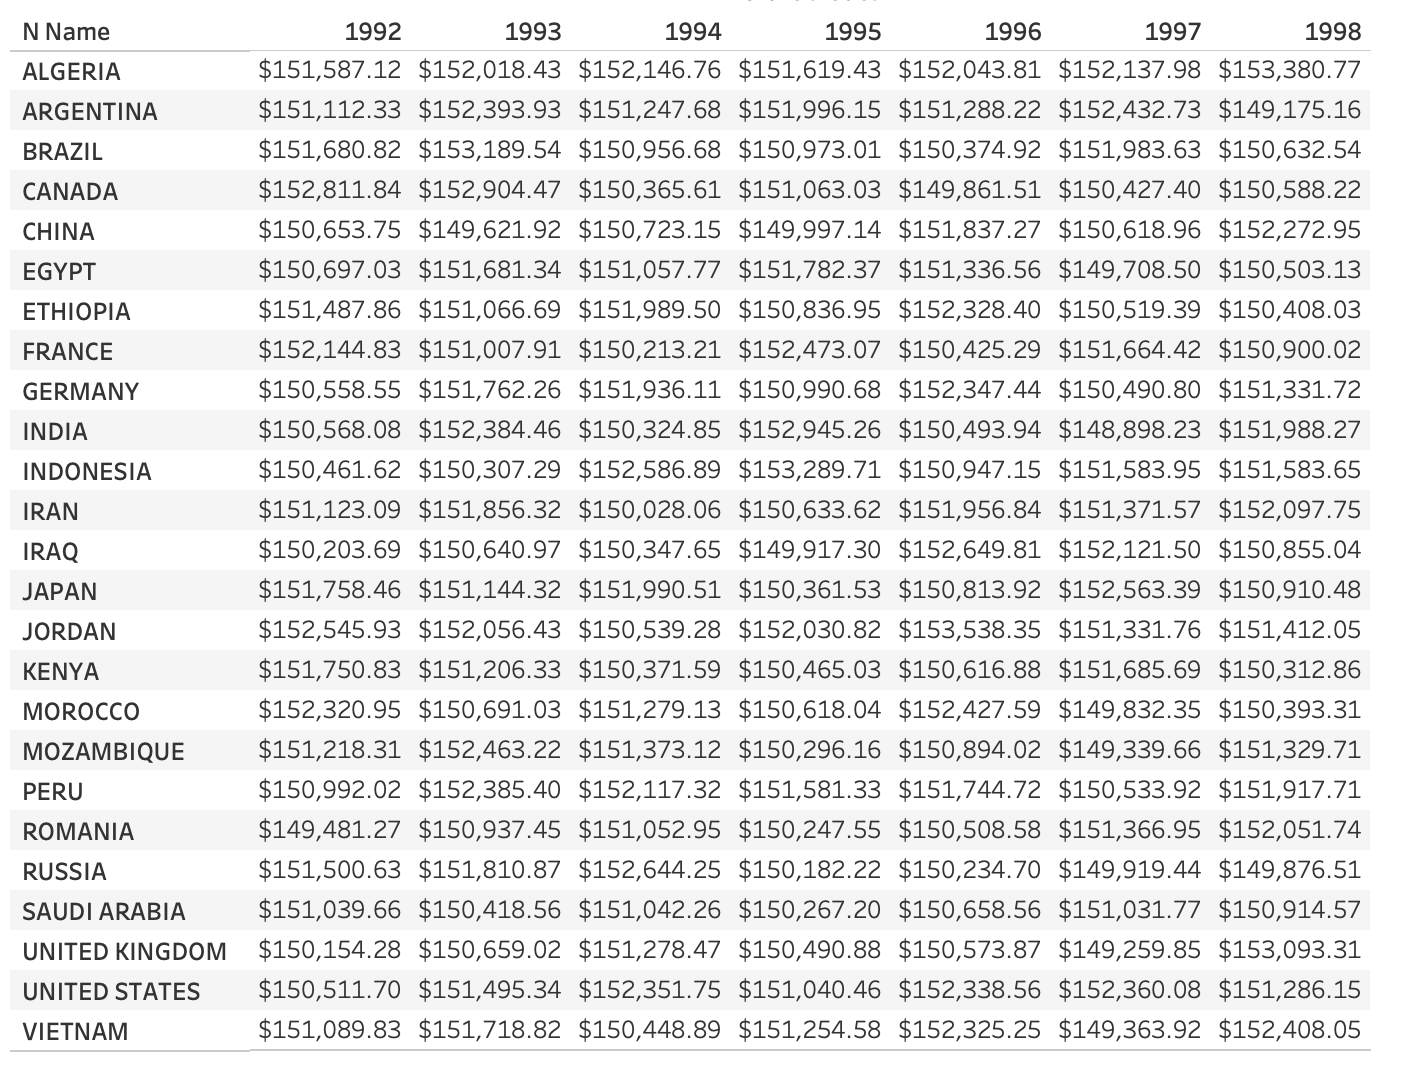
At this point, Tableau has been successfully connected to Apache Doris, enabling data analysis and dashboard creation.
Connection and Usage Tips
Performance Optimization
- Create Doris database tables appropriately based on actual needs, partitioning and bucketing by time to effectively reduce predicate filtering and most data transfer.
- Appropriate data pre-aggregation can be achieved by creating materialized views on the Doris side.
- Set a reasonable refresh schedule to balance refresh computational resource consumption and dashboard data timeliness.
Security Configuration
- It is recommended to use a VPC private connection to avoid security risks introduced by public network access.
- Configure security groups to restrict access.
- Enable SSL/TLS connections and other access methods.
- Fine-tune Doris user account roles and access permissions to avoid excessive delegation of permissions.