Dashboards
Overview
This document explains how to use DOG Stack observability data in Grafana.
DOG Stack uses Doris as the unified storage backend. Doris is MySQL-protocol compatible, so a single MySQL data source in Grafana can query all logs, traces, and metrics. The data path is:
Apps / Infrastructure → OpenTelemetry Collector → Doris Exporter → Doris → Grafana (MySQL DataSource)
This document covers:
- Importing prebuilt dashboards: use the ready-made dashboards we provide.
- Understanding the data model: how OTel data is stored in Doris.
- Creating custom dashboards: build panels, queries, and variables from scratch.
- Reference: schema and syntax cheat sheet.
Prerequisites
Before you start, make sure:
- DOG Stack is deployed, and both Grafana and Doris are running.
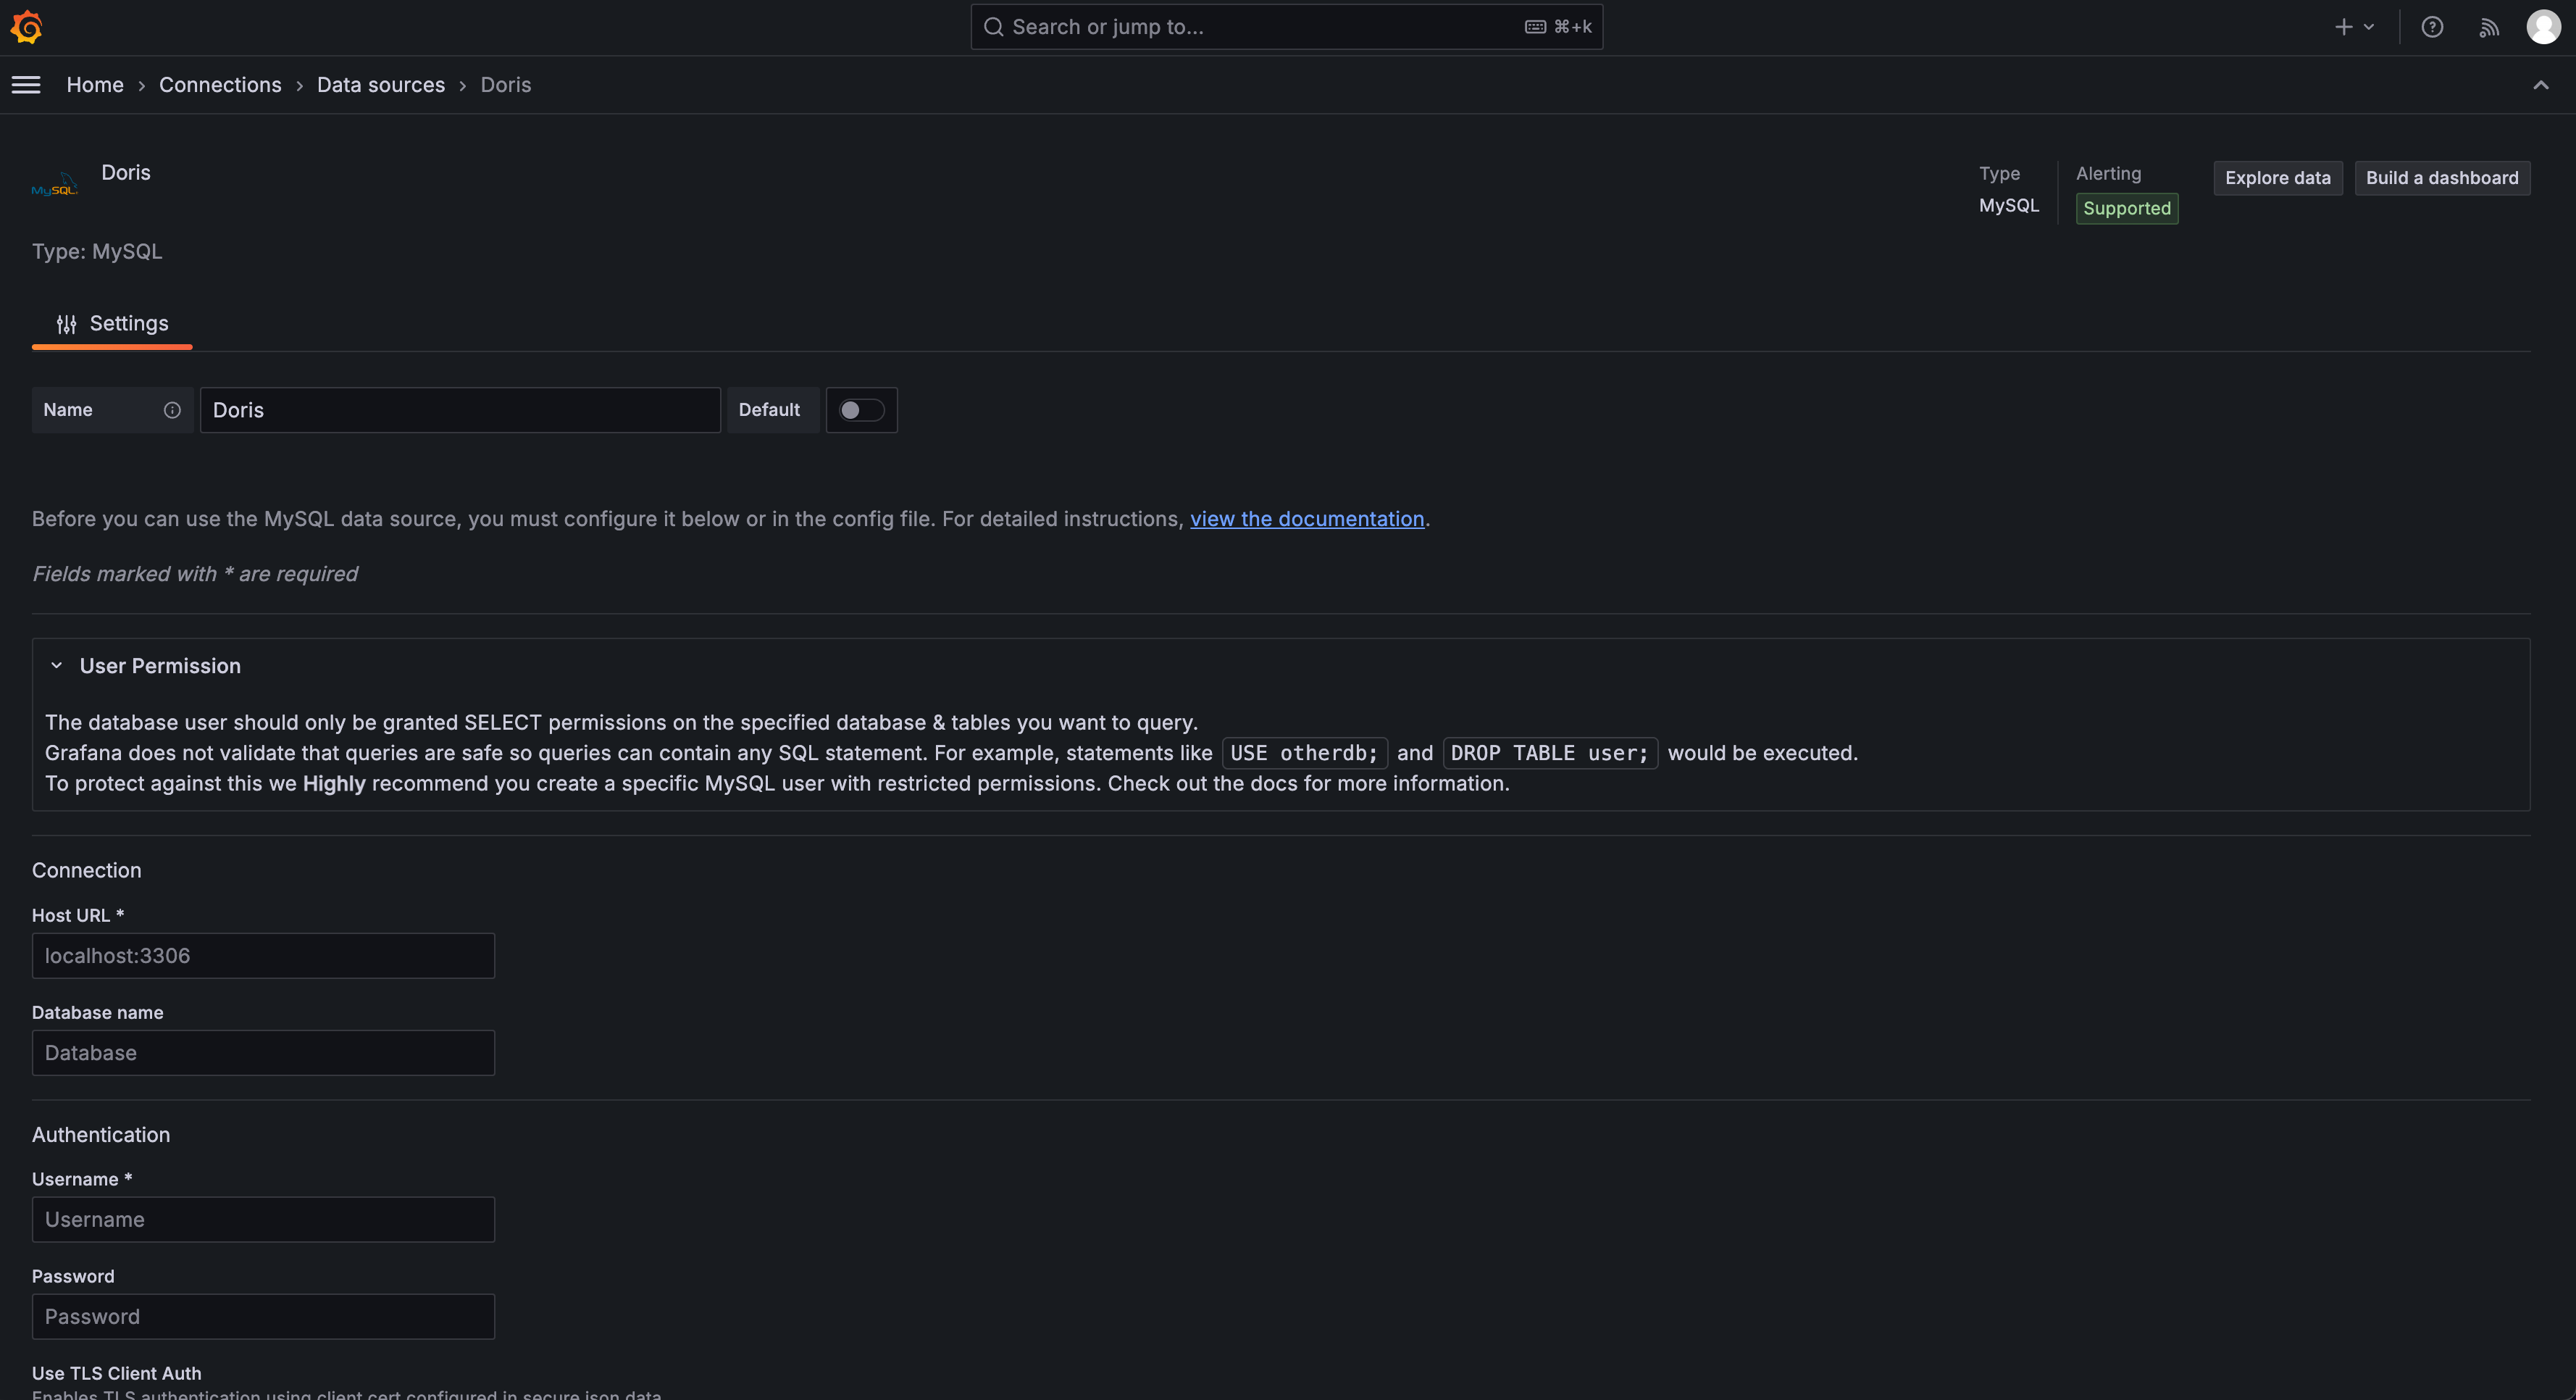
- A MySQL-type data source connecting to Doris is configured in Grafana (the Grafana shipped with DOG Stack already has a pre-configured Doris data source).
If you have not configured a data source yet, follow these steps:
-
In Grafana's left-side menu, click Connections > Data sources > Add data source.
-
Select MySQL.
-
Fill in the connection information:
- Host:
<Doris-fe-host>:9030- Database:
otel- User:
root(or the user you configured)- Password: leave empty (if no password is set)
-
Click Save & test to confirm the connection works.
Importing prebuilt dashboards
We provide 4 prebuilt dashboards covering common observability scenarios:
| Dashboard | File | What it monitors |
|---|---|---|
| Host Metrics | host_metrics_dashboard.json | CPU, memory, disk, network, system load |
| JVM Monitoring | jvm_metrics_dashboard.json | Heap memory, GC, threads, CPU utilization |
| K8s Observability | k8s_kubelet_dashboard.json | Pod / Node / Namespace resource usage |
| Nginx Logs | nginx_logs_dashboard.json | Requests, status codes, top URLs, error logs |
| PostgreSQL Metrics | postgresql-metrics-dashboard.json | Connections, transactions, DB size, Checkpoint, BGWriter |
To import a prebuilt dashboard:
-
In Grafana's left-side menu, click Dashboards > New > Import.
-
Click Upload dashboard JSON file and choose the JSON file under
grafana-dashboard/. -
On the import page, set the data source to your configured Doris (MySQL) data source.
-
Click Import.
-
Repeat the steps above for the remaining JSON files.
Once imported, the variable selectors at the top of the dashboard (such as Service, Namespace) automatically query their candidate values from Doris.
Per-dashboard panel details
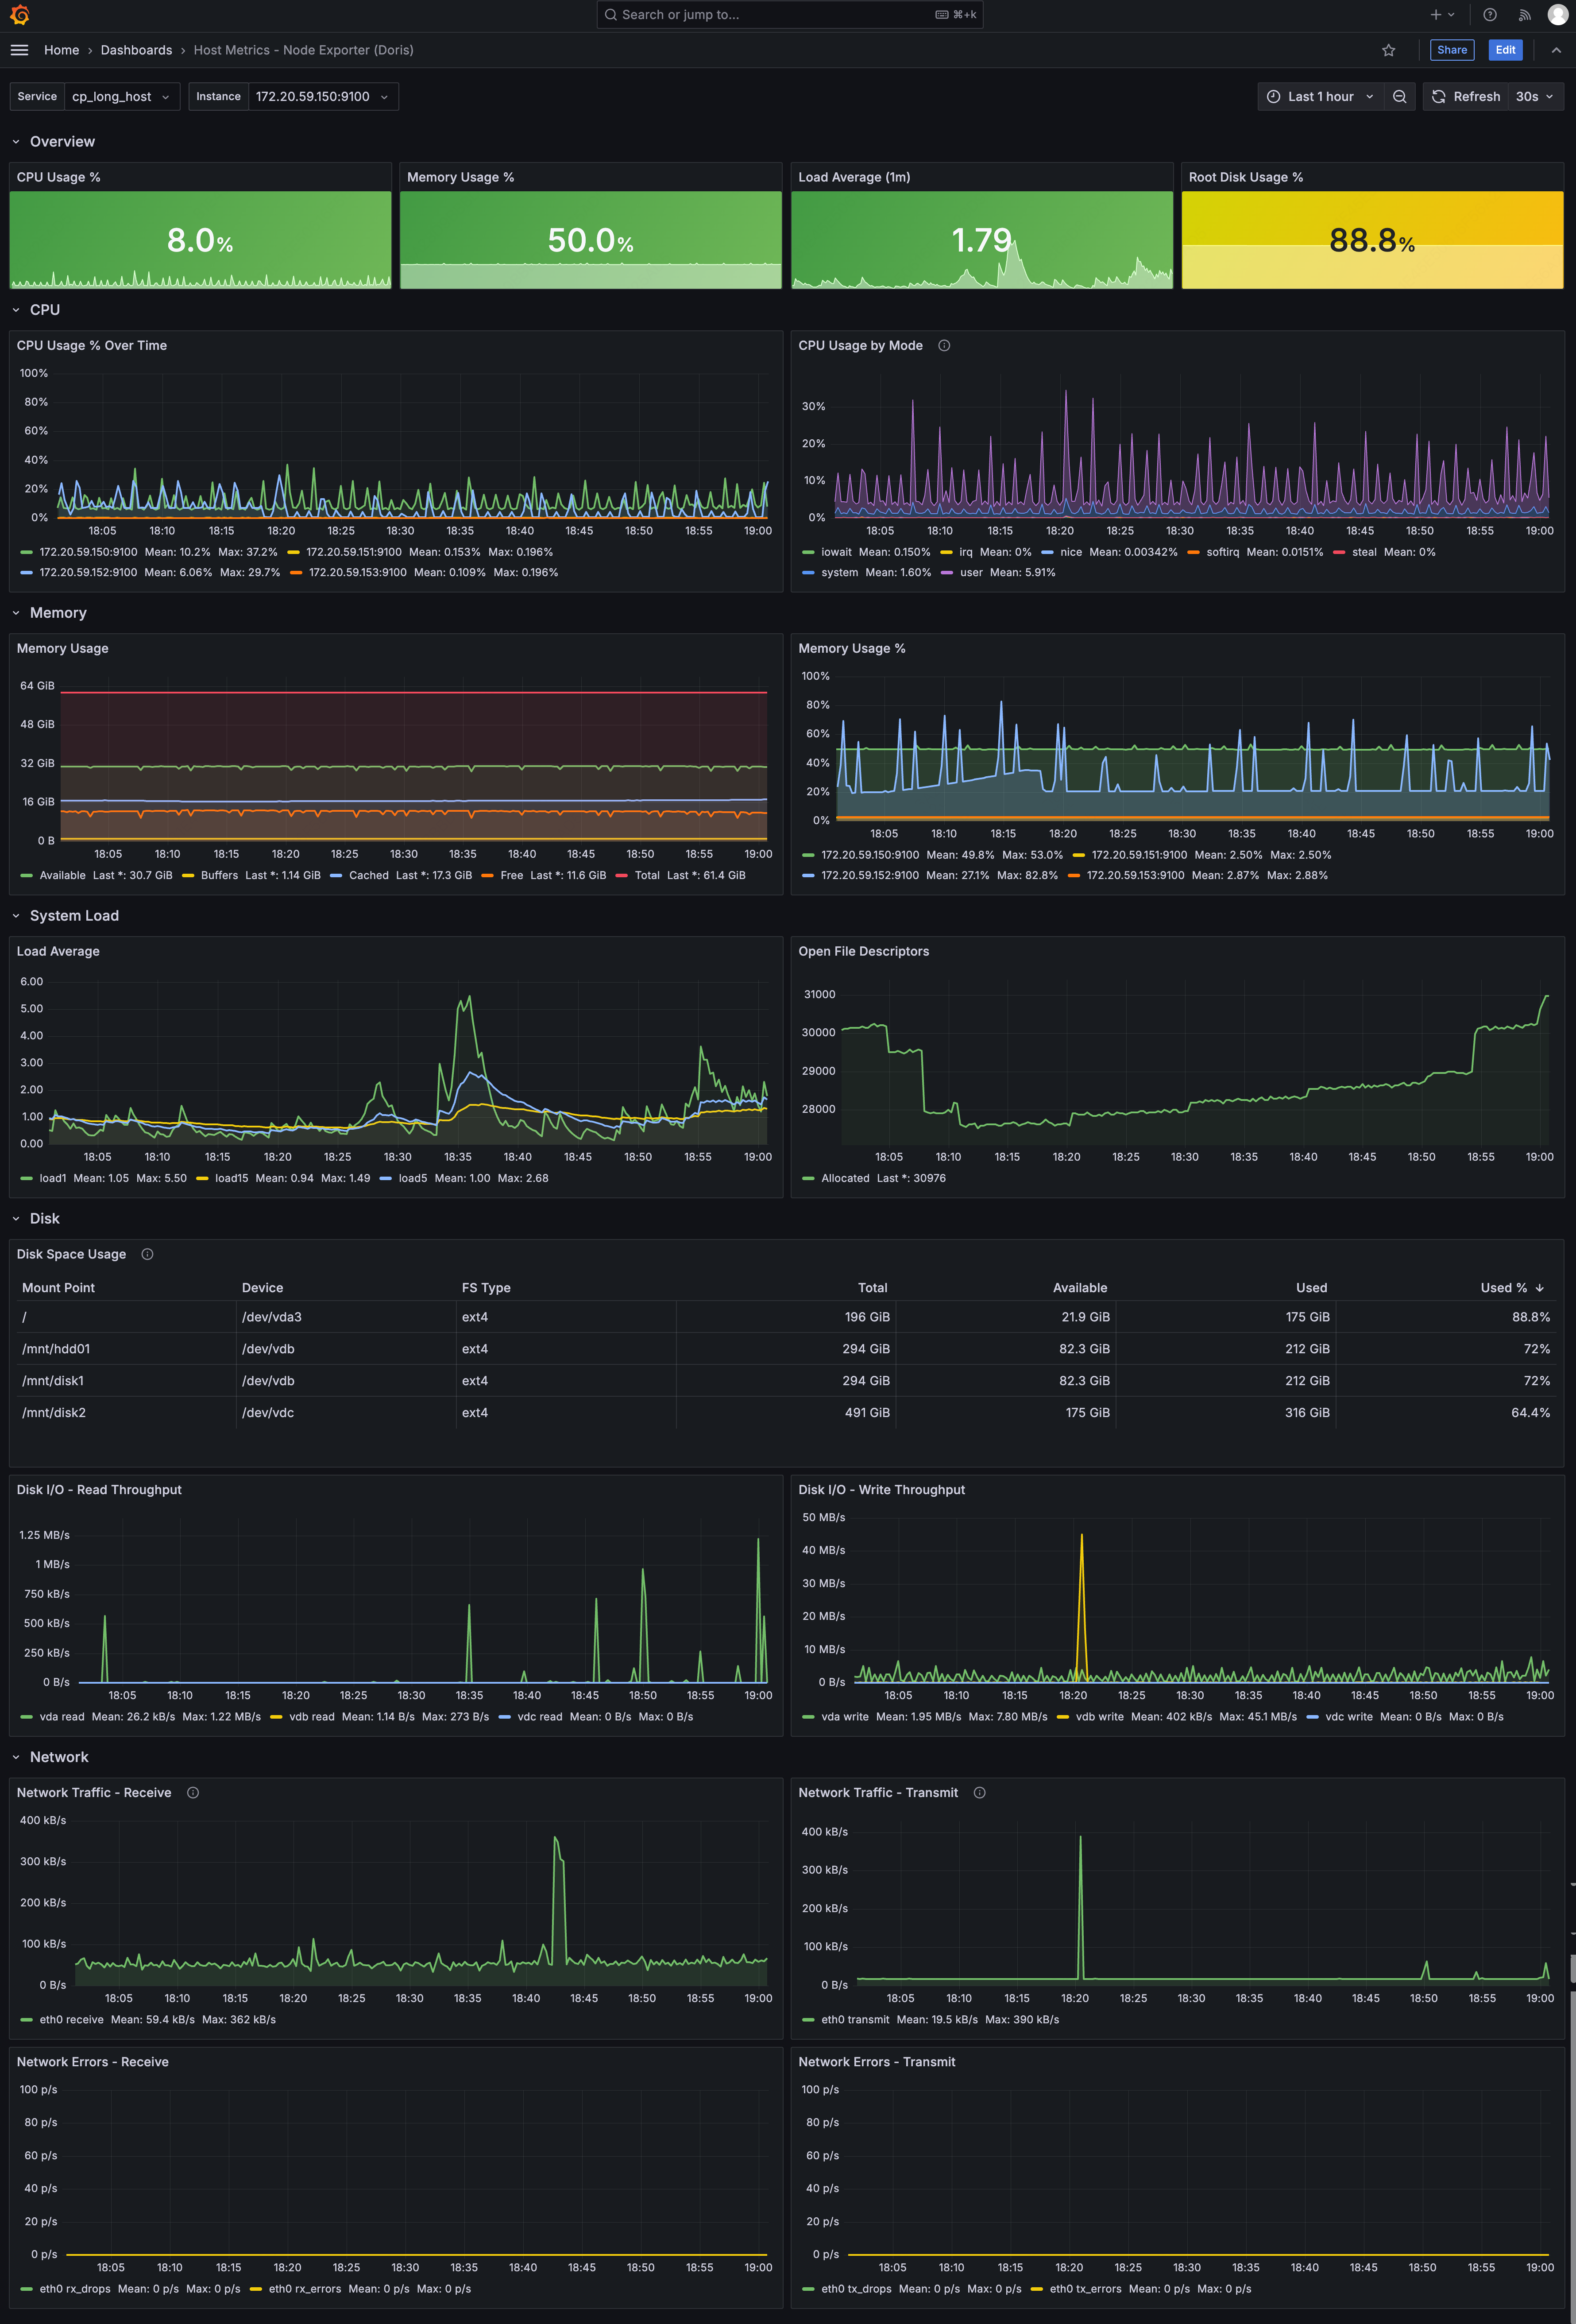
Host Metrics Dashboard
- Overview: CPU usage, memory usage, 1-minute load, root disk usage
- CPU: usage trend, usage by Mode
- Memory: memory details (Total / Available / Free / Cached / Buffers), usage trend
- System Load: 1 / 5 / 15-minute load, open file descriptors
- Disk: disk space usage table, read/write throughput
- Network: ingress/egress traffic, errors and packet drops
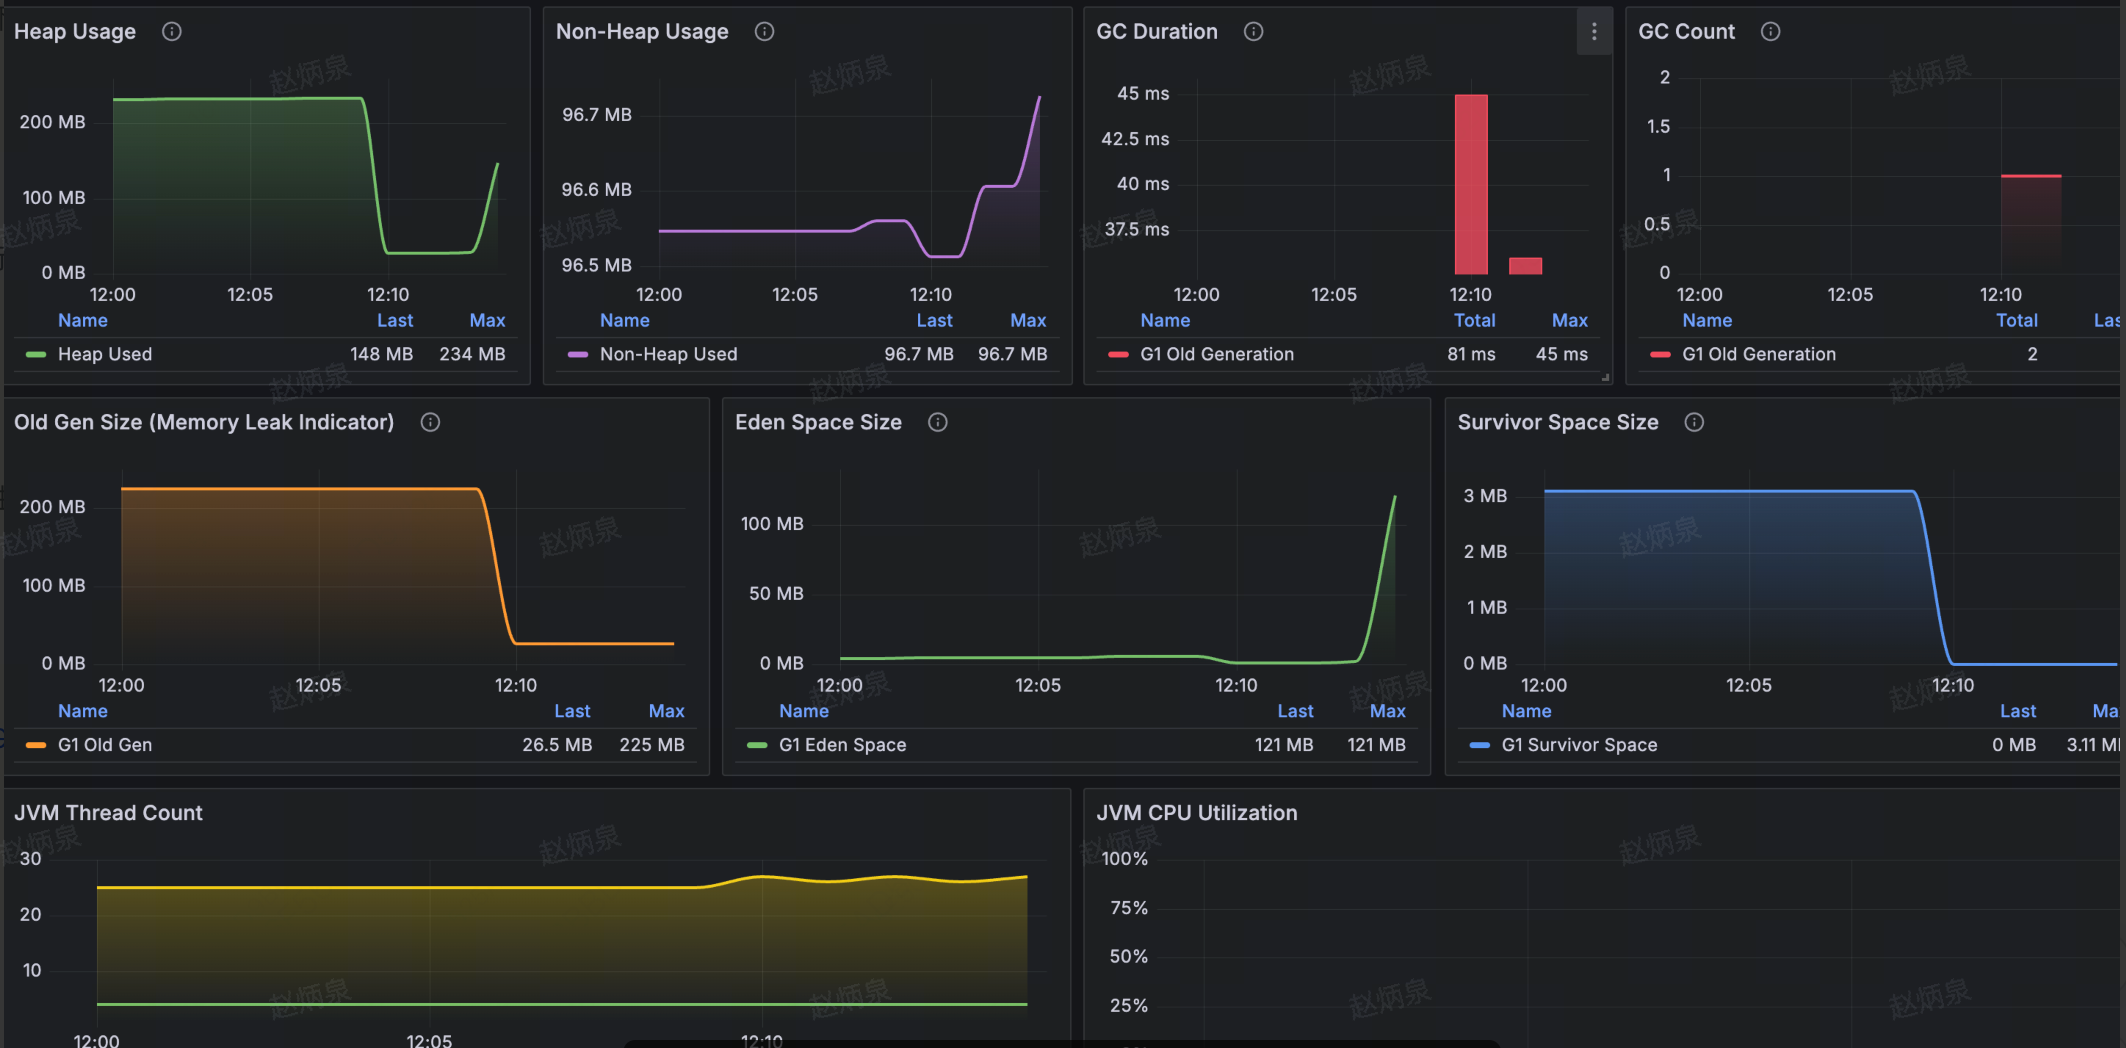
JVM Monitoring Dashboard
- Overview: heap usage, Full GC count, CPU usage, thread count
- Memory: heap / non-heap trends; details for Old Gen / Eden / Survivor pools
- GC: time (Young / Old) and counts
- Thread & CPU: thread count trend, CPU utilization
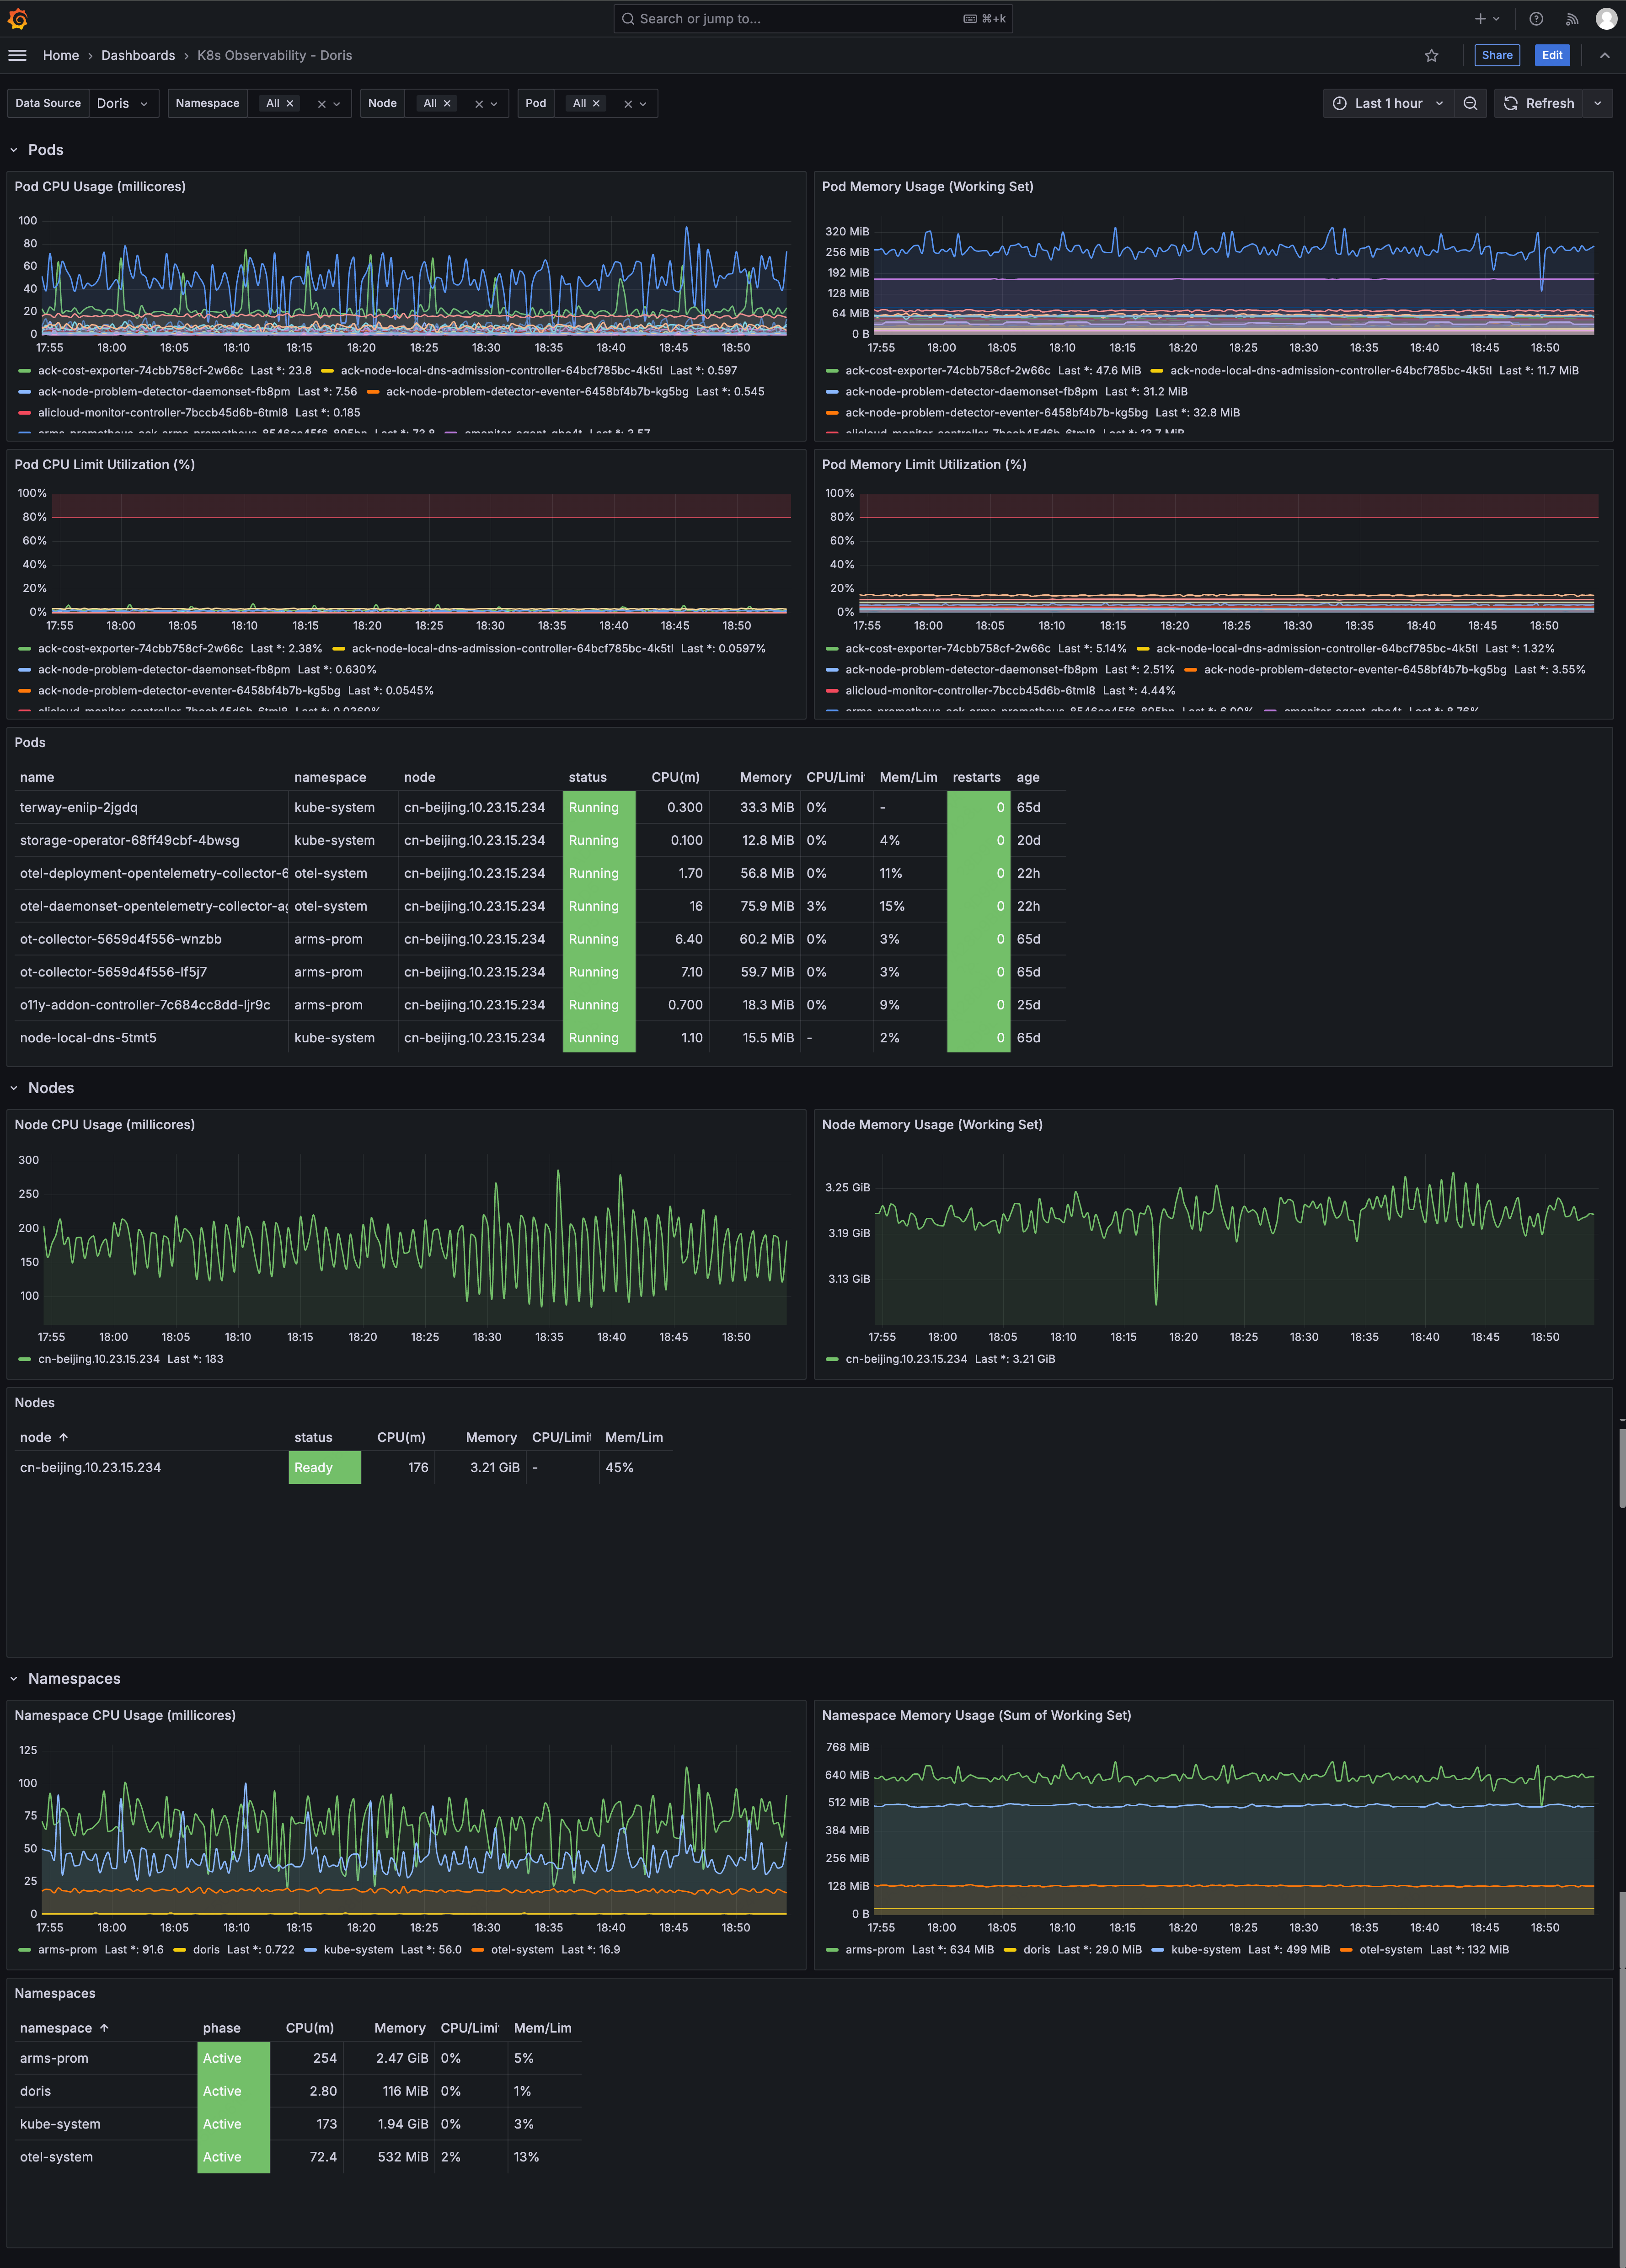
K8s Observability Dashboard
- Pods: CPU (millicores), memory, Limit utilization, status table (with restart count and uptime)
- Nodes: CPU / memory trends, status table
- Namespaces: CPU / memory aggregates, status table
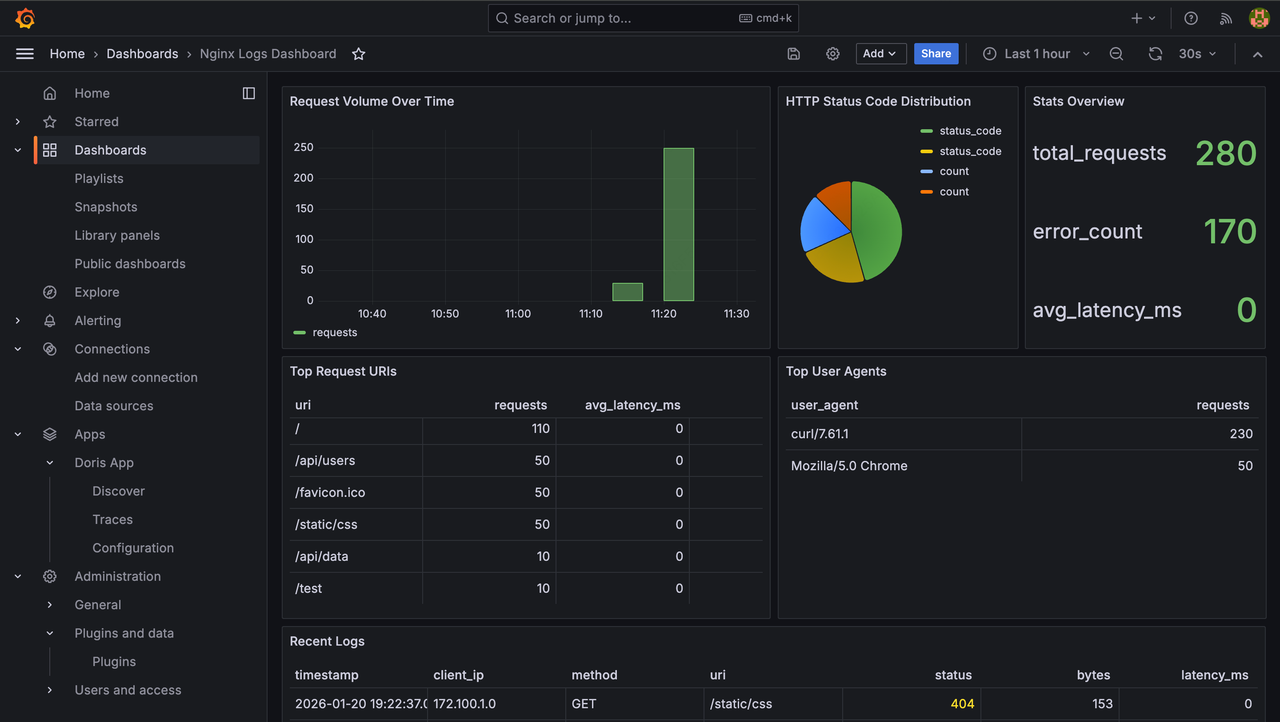
Nginx Logs Dashboard
- Overview: requests, errors, 5xx / 4xx stats, status-code pie chart
- Trends: request volume / error log trends
- Analysis: Top URL, Top IP, HTTP method distribution, top error messages
- Recent Logs: access / error log details
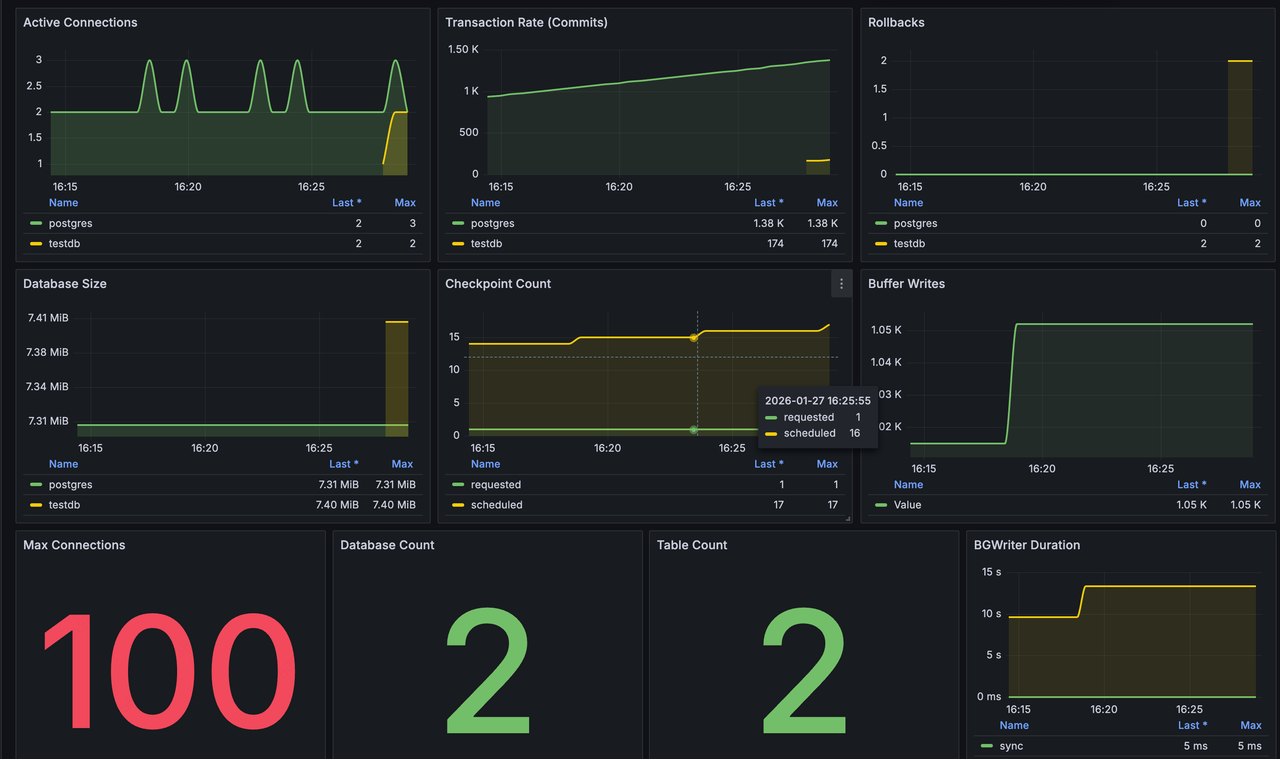
PostgreSQL Metrics Dashboard
- Connections: active connections (split by database), max connections
- Transactions: commit rate, rollback count
- Storage: database size (split by database), number of databases, number of tables
- BGWriter: checkpoint count (scheduled / requested), buffer writes, BGWriter time
Understanding the data model
Before creating a custom dashboard, you need to know how OTel data is stored in Doris.
Tables
Unlike Prometheus, in Doris you cannot query by metric name alone — you also need to know which table to query. OTel data is stored across multiple tables by signal type and metric type:
| Table | Content | Value field | Query approach |
|---|---|---|---|
otel_metrics_gauge | Instantaneous metrics | value | Aggregate directly, e.g. AVG(value) |
otel_metrics_sum | Cumulative counters | value (monotonically increasing) | Compute rate with LAG() |
otel_metrics_histogram | Histogram | count, sum, bucket_counts | Compute deltas with LAG() |
otel_logs | Logs | body, severity_text | COUNT aggregation or detail queries |
otel_traces | Traces | duration, span_name | Sort or aggregate by duration |
To determine which table holds a given metric, run:
SELECT 'gauge' AS type, metric_name FROM otel.otel_metrics_gauge WHERE metric_name = 'your_metric_name' LIMIT 1
UNION ALL
SELECT 'sum', metric_name FROM otel.otel_metrics_sum WHERE metric_name = 'your_metric_name' LIMIT 1
UNION ALL
SELECT 'histogram', metric_name FROM otel.otel_metrics_histogram WHERE metric_name = 'your_metric_name' LIMIT 1;
To browse all available metrics, run the following on each table:
SELECT DISTINCT metric_name FROM otel.otel_metrics_gauge ORDER BY metric_name;
Attribute fields
In Prometheus, all labels are accessed uniformly as {key="value"}. In Doris, attributes are spread across several variant (JSON) columns and accessed with bracket syntax:
| Table | Field | Content | Example |
|---|---|---|---|
| metrics | attributes | Metric dimensions (Prometheus labels) | attributes['mode'] |
| metrics | resource_attributes | Resource info (K8s pod/node, etc.) | resource_attributes['k8s.pod.name'] |
| logs | log_attributes | Log fields | log_attributes['status'] |
| traces | span_attributes | Span fields | span_attributes['http.method'] |
Note: service_name and service_instance_id are top-level columns, not part of attributes. Use them directly, e.g. WHERE service_name = '...'.
When using SELECT, GROUP BY, PARTITION BY, or LIKE, you need to use CAST for type conversion:
-- Extract a value in SELECT
CAST(attributes['device'] AS VARCHAR) AS device

-- Pattern match in WHERE
CAST(attributes['device'] AS VARCHAR) NOT LIKE 'veth%'

-- Numeric comparison in WHERE
CAST(log_attributes['status'] AS INT) >= 500

-- Use in GROUP BY
GROUP BY CAST(resource_attributes['k8s.pod.name'] AS VARCHAR)
For simple equality comparisons in WHERE, CAST is usually unnecessary:
WHERE attributes['mode'] = 'idle'
Caution: Using a wrong attribute field name (for example, log_attributes on a metrics table) does not raise an error — it silently returns NULL, causing empty query results.
Counter metrics and rate calculation
For Gauge metrics, value directly represents the current value and can be aggregated with AVG or MAX.
For Counter / Sum metrics, value is a monotonically increasing cumulative value (such as total CPU seconds or total network bytes). To get the rate, you need the delta between adjacent data points. Prometheus's rate() is implemented in Doris with the LAG() window function.
Here is a generic rate template:
SELECT
  t.timestamp AS time,
  t.<dimension_field> AS metric,
  CASE
    WHEN UNIX_TIMESTAMP(t.timestamp) > UNIX_TIMESTAMP(t.prev_ts)
         AND t.value >= t.prev_value
    THEN (t.value - t.prev_value) / (UNIX_TIMESTAMP(t.timestamp) - UNIX_TIMESTAMP(t.prev_ts))
    ELSE NULL
  END AS value
FROM (
  SELECT timestamp, value, <dimension_field>,
    LAG(value) OVER (PARTITION BY <dimension_field> ORDER BY timestamp) AS prev_value,
    LAG(timestamp) OVER (PARTITION BY <dimension_field> ORDER BY timestamp) AS prev_ts
  FROM otel.otel_metrics_sum
  WHERE metric_name = '<metric_name>'
    AND $__timeFilter(timestamp)
) t
WHERE t.prev_ts IS NOT NULL
ORDER BY time
To use this template, replace the following placeholders:
<dimension_field>: the field that splits the series, e.g.CAST(attributes['device'] AS VARCHAR).<metric_name>: the metric name, e.g.node_network_receive_bytes_total.
The template includes three layers of safety:
| Condition | Purpose |
|---|---|
WHERE t.prev_ts IS NOT NULL | Skips the first row of each partition (LAG returns NULL) |
UNIX_TIMESTAMP(t.timestamp) > UNIX_TIMESTAMP(t.prev_ts) | Prevents divide-by-zero from duplicate timestamps |
t.value >= t.prev_value | Prevents negative deltas caused by counter resets |
The choice of PARTITION BY directly determines whether the rate is correct. Choosing wrong causes data from different dimensions to be mixed. Here are the choices used in the prebuilt dashboards:
| Scenario | PARTITION BY |
|---|---|
| CPU usage (multi-core aggregation) | service_instance_id, CAST(attributes['cpu'] AS VARCHAR) |
| Disk I/O | CAST(attributes['device'] AS VARCHAR) |
| Network traffic | CAST(attributes['device'] AS VARCHAR) |
| GC time | CAST(attributes['jvm.gc.name'] AS VARCHAR) |
Creating a custom dashboard
This section walks through, in practice, creating a dashboard with multiple panels and variables from scratch.
Create a Dashboard and a Time Series panel
We will create a Time Series panel that shows the CPU usage trend of a K8s pod. This example uses a Gauge metric and shows the complete thought process of writing the SQL.
-
In Grafana's left-side menu, click Dashboards > New > New dashboard.
-
Click Add visualization.
-
From the data source dropdown, choose your configured MySQL (Doris) data source.
-
In the top-right of the query editor, switch to Code mode.
Now we write the SQL query. The following builds it up step by step.
Write the base query. The goal is to monitor pod CPU; the metric name is k8s.pod.cpu.usage. It is a Gauge metric stored in otel_metrics_gauge, where value can be aggregated directly:
SELECT timestamp, value
FROM otel.otel_metrics_gauge
WHERE metric_name = 'k8s.pod.cpu.usage'
Add time filtering. Grafana's MySQL data source provides two ways to filter on time:
-- Option A: use the $__timeFilter macro (recommended)
WHERE metric_name = 'k8s.pod.cpu.usage'
  AND $__timeFilter(timestamp)

-- Option B: use $__from and $__to (more flexible inside subqueries or JOINs)
WHERE metric_name = 'k8s.pod.cpu.usage'
  AND timestamp >= FROM_UNIXTIME($__from/1000)
  AND timestamp < FROM_UNIXTIME($__to/1000)
Note: $__from and $__to are millisecond timestamps — divide by 1000 before using them in FROM_UNIXTIME().
Add time bucketing. Raw data points are too dense; aggregate them at a fixed interval. Use FLOOR(UNIX_TIMESTAMP(timestamp) / N) * N to round time to N-second buckets:
SELECT
  FLOOR(UNIX_TIMESTAMP(timestamp) / 20) * 20 AS time,
  AVG(value) AS value
FROM otel.otel_metrics_gauge
WHERE metric_name = 'k8s.pod.cpu.usage'
  AND timestamp >= FROM_UNIXTIME($__from/1000)
  AND timestamp < FROM_UNIXTIME($__to/1000)
GROUP BY time
ORDER BY time
Split into multiple series by dimension. For the Time Series format, Grafana's MySQL data source requires three columns:
| Column | Purpose |
|---|---|
time or time_sec | X-axis time. Either a datetime value or a UNIX timestamp in seconds. |
metric | Series name. Grafana splits into multiple lines by distinct values of this column. |
value | Y-axis value. |
Add the pod name as the metric column for the complete query:
SELECT
  FLOOR(UNIX_TIMESTAMP(timestamp) / 20) * 20 AS time,
  CAST(resource_attributes['k8s.pod.name'] AS VARCHAR) AS metric,
  AVG(value) AS value
FROM otel.otel_metrics_gauge
WHERE metric_name = 'k8s.pod.cpu.usage'
  AND timestamp >= FROM_UNIXTIME($__from/1000)
  AND timestamp < FROM_UNIXTIME($__to/1000)
GROUP BY time, metric
ORDER BY time
To monitor a different Gauge metric, change:
metric_name: the target metric name.- The
metriccolumn: the dimension used to split series, chosen fromattributesorresource_attributes.
-
Paste the complete SQL into the query editor.
-
Below the editor, set Format to Time series.
-
Click the panel title to set a name.
-
In the right-side panel settings, find Standard options > Unit and choose an appropriate unit.
-
Click Apply at the top right.
Add a Counter metric panel
This section creates a Time Series panel showing the rate of a Counter metric. A Counter's value is a monotonically increasing cumulative value — use the generic rate template to compute the rate.
- On the dashboard, click Add > Visualization.
- Choose the data source and switch to Code mode.
Replace the placeholders in the rate template with concrete values. The example below computes the network receive byte rate, split by network device:
SELECT
  t.timestamp AS time,
  t.device AS metric,
  CASE
    WHEN UNIX_TIMESTAMP(t.timestamp) > UNIX_TIMESTAMP(t.prev_ts)
         AND t.value >= t.prev_value
    THEN (t.value - t.prev_value) / (UNIX_TIMESTAMP(t.timestamp) - UNIX_TIMESTAMP(t.prev_ts))
    ELSE NULL
  END AS value
FROM (
  SELECT timestamp, CAST(attributes['device'] AS VARCHAR) AS device, value,
    LAG(value) OVER (PARTITION BY CAST(attributes['device'] AS VARCHAR) ORDER BY timestamp) AS prev_value,
    LAG(timestamp) OVER (PARTITION BY CAST(attributes['device'] AS VARCHAR) ORDER BY timestamp) AS prev_ts
  FROM otel.otel_metrics_sum
  WHERE metric_name = 'node_network_receive_bytes_total'
    AND $__timeFilter(timestamp)
) t
WHERE t.prev_ts IS NOT NULL
ORDER BY time
To use a different Counter metric, change two things:
metric_name: the target metric name.- The dimension field in
PARTITION BYandSELECT: the dimension used to split that metric (such asattributes['cpu'],attributes['gc_name'], etc.). - Paste the SQL and set Format to Time series.
- In Standard options > Unit, choose an appropriate unit.
- Click Apply.
Add a Stat panel
A Stat panel shows a single value, such as the current utilization or the latest count. The SQL just needs to return one value.
- Click Add > Visualization and switch to Code mode.
The following query gets the latest metric value within the time range:
SELECT value
FROM otel.otel_metrics_gauge
WHERE metric_name = 'node_memory_MemAvailable_bytes'
  AND $__timeFilter(timestamp)
ORDER BY timestamp DESC
LIMIT 1
If you need to compute on multiple metrics (such as a ratio), see "Querying multiple metrics in one SQL" in Optimization tips.
- Paste the SQL and set Format to Table (Stat panels use Table format).
- In the right-side panel settings, change the panel type to Stat.
- In Standard options > Unit, choose an appropriate unit.
- Click Apply.
Add a Table panel
The Table panel is suitable for multi-row, multi-column data; each column alias in the SQL becomes a column header.
- Click Add > Visualization and switch to Code mode.
The following query shows recent log details:
SELECT
  timestamp,
  service_name,
  severity_text,
  body,
  CAST(log_attributes['your_key'] AS VARCHAR) AS your_key
FROM otel.otel_logs
WHERE $__timeFilter(timestamp)
ORDER BY timestamp DESC
LIMIT 100
Replace your_key with the actual log attribute field name. To see the available attributes, run:
SELECT log_attributes FROM otel.otel_logs LIMIT 1;
- Paste the SQL and set Format to Table.
- Click Apply.
Add template variables
Template variables add interactive dropdown filters to a dashboard, letting users filter data without modifying the SQL.
Single-select variable:
-
Click the gear icon at the top right of the dashboard, then go to Settings > Variables > New variable.
-
Fill in the configuration:
- Name:
service_name- Type: Query
- Data source: choose your Doris data source
- Query:
sql SELECT DISTINCT service_name FROM otel.otel_metrics_gauge WHERE service_name != '' AND service_name IS NOT NULL AND $__timeFilter(timestamp) ORDER BY service_name
- Click Apply.
In a panel's SQL, reference a single-select variable with the $variable syntax:
AND service_name = '$service_name'
Multi-select variable:
-
Create a new variable with the following configuration:
- Name:
namespace- Type: Query
- Multi-value: checked
- Include All option: checked
- Query:
sql SELECT DISTINCT CAST(resource_attributes['k8s.namespace.name'] AS VARCHAR) AS __text FROM otel.otel_metrics_gauge WHERE metric_name = 'k8s.pod.phase' AND timestamp >= NOW() - INTERVAL 1 HOUR ORDER BY 1
- Click Apply.
Note: The column alias __text is a Grafana convention used to control the display text of the dropdown.
In a panel's SQL, reference a multi-select variable with the ${variable:sqlstring} syntax combined with IN():
AND CAST(resource_attributes['k8s.namespace.name'] AS VARCHAR) IN (${namespace:sqlstring})
Caution: Multi-select variables produce a SQL syntax error if :sqlstring is omitted.
Cascading variables:
The candidate values of one variable can depend on another. For example, the following Pod variable filters its candidates by the currently selected Namespace:
SELECT DISTINCT CAST(resource_attributes['k8s.pod.name'] AS VARCHAR) AS __text
FROM otel.otel_metrics_gauge
WHERE metric_name = 'k8s.pod.phase'
  AND timestamp >= NOW() - INTERVAL 1 HOUR
  AND CAST(resource_attributes['k8s.namespace.name'] AS VARCHAR) IN (${namespace:sqlstring})
ORDER BY 1
Optimization tips
The following are common optimization techniques used in the prebuilt dashboards.
Adjust the time-bucket interval. Choose a bucket size that matches the time range. Modify N in FLOOR(UNIX_TIMESTAMP(timestamp) / N) * N:
- 20 seconds: suited to short-window real-time monitoring.
- 60 seconds: suited to hour-level overviews.
- 300 seconds: suited to day-level trends.
Set meaningful series names. Use CONCAT() to combine multiple fields:
CONCAT(device, ' read') AS metric
Use CASE WHEN to map numeric values to readable text:
CASE WHEN value = 2 THEN 'Running'
     WHEN value = 1 THEN 'Pending'
     WHEN value = 3 THEN 'Succeeded'
     WHEN value = 4 THEN 'Failed'
     ELSE 'Unknown'
END AS status
Handle divide-by-zero and NULLs. Use NULLIF to guard against divide-by-zero and COALESCE to provide default values:
/ NULLIF(SUM(...), 0)
COALESCE(restarts, 0)
Query multiple metrics in one SQL. Use CASE WHEN metric_name instead of JOIN:
SELECT timestamp AS time,
  SUM(CASE WHEN metric_name = 'node_memory_MemAvailable_bytes' THEN value END) AS available,
  SUM(CASE WHEN metric_name = 'node_memory_MemTotal_bytes' THEN value END) AS total
FROM otel.otel_metrics_gauge
WHERE metric_name IN ('node_memory_MemTotal_bytes', 'node_memory_MemAvailable_bytes')
GROUP BY timestamp
Filter out noise data. Exclude virtual network interfaces:
AND CAST(attributes['device'] AS VARCHAR) NOT LIKE 'veth%'
AND CAST(attributes['device'] AS VARCHAR) NOT LIKE 'br-%'
AND CAST(attributes['device'] AS VARCHAR) != 'lo'
Keep only real filesystems:
AND CAST(attributes['fstype'] AS VARCHAR) IN ('ext4', 'xfs', 'btrfs')
Reference
OTel table schema
Metrics tables (gauge / sum / histogram — shared fields)
| Field | Type | Description |
|---|---|---|
service_name | varchar(200) | Service name |
timestamp | datetime(6) | Data timestamp |
service_instance_id | varchar(200) | Service instance ID |
metric_name | varchar(200) | Metric name |
metric_description | text | Metric description |
metric_unit | text | Metric unit |
attributes | variant (JSON) | Metric dimensions |
resource_attributes | variant (JSON) | Resource attributes |
scope_name | text | Collector name |
gauge-only field: value (double)
sum extra fields: value (double), aggregation_temporality (text), is_monotonic (boolean)
histogram extra fields: count (bigint), sum (double), bucket_counts (array<bigint>), explicit_bounds (array<double>), min (double), max (double)
Logs table
| Field | Type | Description |
|---|---|---|
timestamp | datetime(6) | Log timestamp |
service_name | varchar(200) | Service name |
service_instance_id | varchar(200) | Service instance ID |
trace_id | varchar(200) | Associated trace ID |
span_id | text | Associated span ID |
severity_number | int | Severity number |
severity_text | text | Severity text (INFO / WARN / ERROR) |
body | text | Log body |
resource_attributes | variant (JSON) | Resource attributes |
log_attributes | variant (JSON) | Log attributes |
Traces table
| Field | Type | Description |
|---|---|---|
timestamp | datetime(6) | Span start time |
service_name | varchar(200) | Service name |
trace_id | varchar(200) | Trace ID |
span_id | text | Span ID |
parent_span_id | text | Parent span ID |
span_name | text | Span name |
span_kind | text | Span kind (CLIENT / SERVER / INTERNAL) |
end_time | datetime(6) | Span end time |
duration | bigint | Duration (nanoseconds) |
span_attributes | variant (JSON) | Span attributes |
events | array | Span events |
links | array | Span links |
status_code | text | Status code (OK / ERROR / UNSET) |
status_message | text | Status message |
resource_attributes | variant (JSON) | Resource attributes |
Syntax cheat sheet
| Purpose | Syntax |
|---|---|
| Time filter (macro) | $__timeFilter(timestamp) |
| Time filter (manual) | timestamp >= FROM_UNIXTIME($__from/1000) |
| Time bucket (20 seconds) | FLOOR(UNIX_TIMESTAMP(timestamp) / 20) * 20 AS time |
| Time bucket (1 minute) | UNIX_TIMESTAMP(DATE_FORMAT(timestamp, '%Y-%m-%d %H:%i:00')) * 1000 AS time |
| Attribute access | attributes['key'] |
| Attribute CAST | CAST(attributes['key'] AS VARCHAR) |
| Single-select variable | service_name = '$service_name' |
| Multi-select variable | IN (${namespace:sqlstring}) |
| Divide-by-zero guard | / NULLIF(..., 0) |
| Default value | COALESCE(..., 0) |
| Series naming | CONCAT(device, ' read') AS metric |
| Status mapping | CASE WHEN value = 2 THEN 'Running' ... END |
| URL stripping query string | SUBSTRING_INDEX(url, '?', 1) |
| Filter out virtual network cards | NOT LIKE 'veth%' + NOT LIKE 'br-%' + != 'lo' |