Log Storage and Analysis
Logs are detailed records of system operation, containing key information such as the event subject, time, location, and content. Driven by needs in operational observability, network security monitoring, and business analysis, enterprises typically need to centrally collect, store, and analyze scattered logs in order to extract value from massive log volumes.
For this scenario, beyond its general OLAP capabilities, Apache Doris adds inverted indexes and high-speed full-text search, and it pushes write performance and storage footprint to the limit. With Apache Doris, you can build an open, high-performance, low-cost, unified log storage and analysis platform.
This article covers the following topics around the solution:
- Overall architecture: The core components and underlying architecture of a log platform built on Apache Doris.
- Features and advantages: Differentiated capabilities compared with Elasticsearch.
- Operations guide: End-to-end steps from resource estimation to log querying.
1. Overall architecture
The architecture of a log storage and analysis platform built on Apache Doris is shown below:
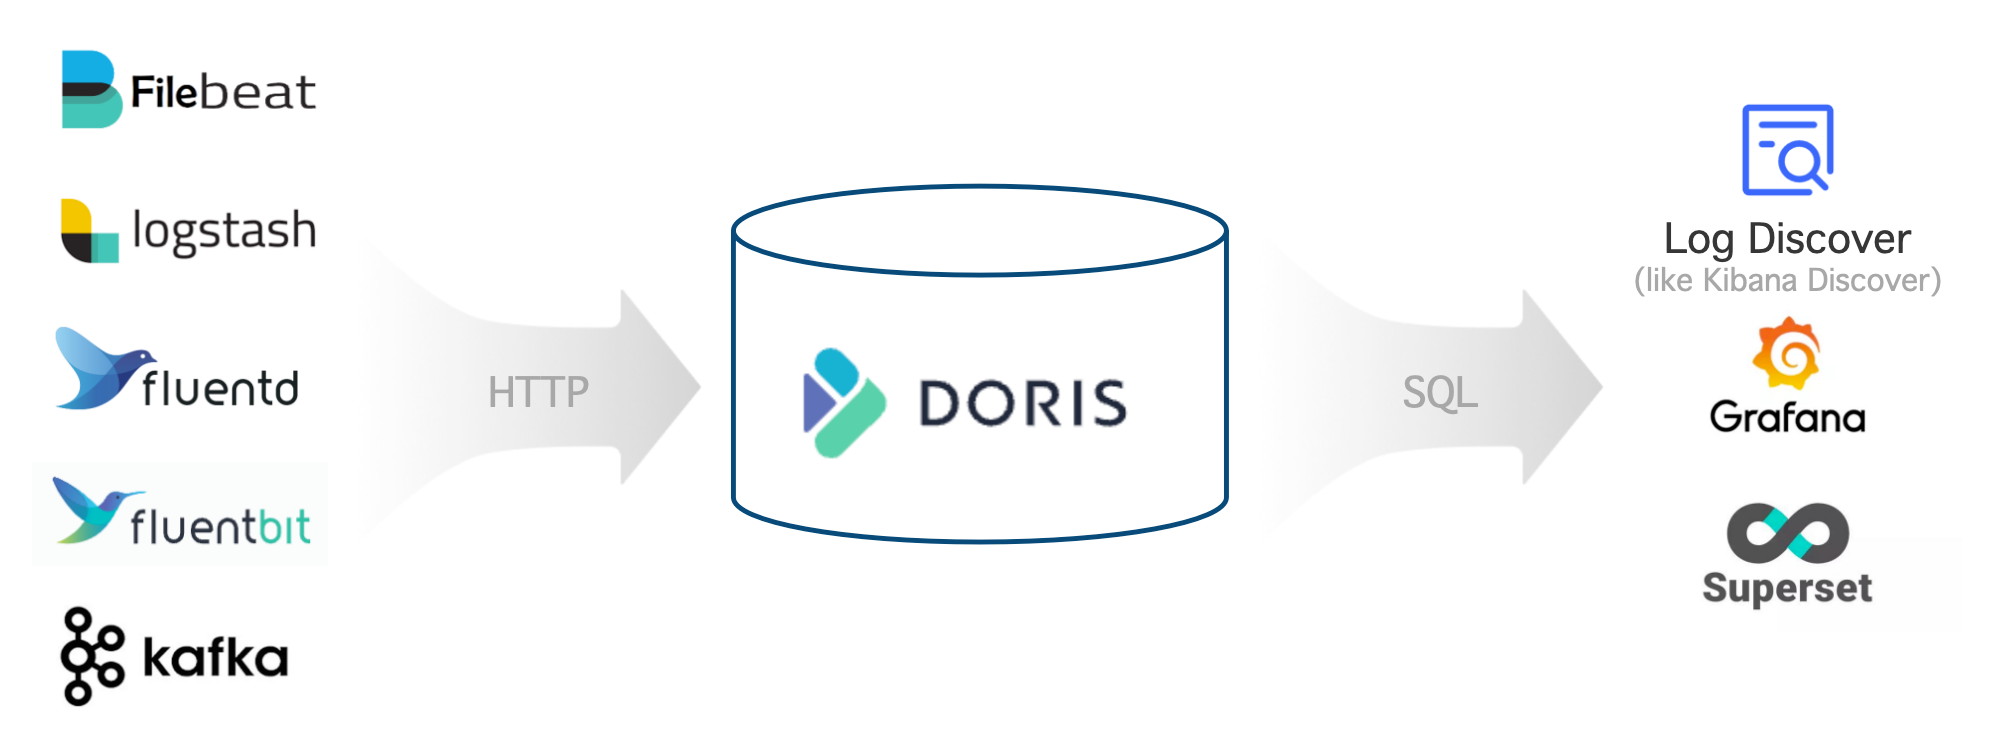
The overall architecture has three parts:
| Layer | Components | Description |
|---|---|---|
| Log collection and preprocessing | Logstash, Filebeat, Fluentbit, Kafka, etc. | Write log data into Apache Doris through HTTP APIs |
| Log storage and analysis | Apache Doris | Provides high-performance, low-cost unified storage and rich search and analysis through a SQL interface |
| Log analysis and alerting | Grafana, Superset, Doris WebUI, etc. | Query Doris through the standard MySQL protocol and provide easy-to-use visual interfaces |
2. Features and advantages
A log platform built on Apache Doris provides the following core capabilities:
| Capability | Description |
|---|---|
| High-throughput, low-latency ingestion | Supports stable, continuous ingestion of hundreds of TB per day at GB/s, with latency under 1 second |
| Low-cost storage for massive data | Supports PB-scale storage, saving 60%–80% of storage cost compared with Elasticsearch, and another 50% off after tiering cold data to S3/HDFS |
| High-performance full-text search and analysis | Supports inverted indexes and full-text search; queries such as keyword detail lookup and trend analysis respond in seconds |
| Open and easy-to-use ecosystem | Upstream connects to Logstash, Filebeat, Fluentbit, Kafka, etc.; downstream connects to Grafana, Superset, and Doris WebUI through the standard MySQL protocol |
2.1 High performance and low cost
Through benchmarks and production validation, the cost-performance ratio of a log platform built on Apache Doris is 5 to 10 times better than that of Elasticsearch. The advantages come mainly from a high-performance storage and query engine, and from optimizations specifically targeted at log scenarios:
- Higher write throughput: The write bottleneck in Elasticsearch is the CPU consumed by data parsing and inverted index building. Apache Doris uses CPU vectorization instructions such as SIMD to speed up JSON parsing and index building, and simplifies the inverted index structure by removing forward indexes and other data structures that are not needed in log scenarios. With the same resources, Doris write performance is 3 to 5 times that of Elasticsearch.
- Lower storage cost: Elasticsearch suffers from multiple copies of data (forward index, inverted index, doc values column store) and a relatively low general compression ratio. Doris removes the forward index, reducing index data by 30%; it adopts columnar storage with the Zstandard compression algorithm, achieving a compression ratio of 5 to 10, far higher than Elasticsearch's 1.5. The hot-cold tiering feature can automatically move historical logs to object storage, reducing cold-data storage cost by more than 70%. The overall storage cost is only about 20% of that of Elasticsearch.
- Higher query performance: Doris simplifies the full-text search pipeline and skips algorithms such as relevance scoring that are not needed in log scenarios. For typical queries such as "the latest 100 logs containing a given keyword," Doris applies dedicated optimizations such as TopN dynamic pruning at the planning and execution layers.
2.2 Powerful analytical capabilities
Apache Doris supports standard SQL and is compatible with the MySQL protocol and syntax, so a log system built on Doris has the following advantages:
- Easy to use: Engineers and data analysts are highly familiar with SQL and can get started quickly without learning a new technology stack.
- Rich ecosystem: Integrates seamlessly with the MySQL command line, various GUI / BI tools, and the big data ecosystem, meeting complex and varied data processing and analysis needs.
- Strong analytical power: SQL is the de facto standard for data analysis and supports search, aggregation, multi-table JOIN, subqueries, UDFs, logical views, materialized views, and more.
2.3 Flexible schema
Below is a typical sample of a semi-structured log in JSON format. The top-level fields are relatively fixed (timestamp, source, node, component, level, clientRequestId, message, properties), while the nested fields inside the extension attribute properties (such as properties.size and properties.format) are more dynamic, and the fields can vary from log to log.
{
  "timestamp": "2014-03-08T00:50:03.8432810Z",
  "source": "ADOPTIONCUSTOMERS81",
  "node": "Engine000000000405",
  "level": "Information",
  "component": "DOWNLOADER",
  "clientRequestId": "671db15d-abad-94f6-dd93-b3a2e6000672",
  "message": "Downloading file path: benchmark/2014/ADOPTIONCUSTOMERS81_94_0.parquet.gz",
  "properties": {
    "size": 1495636750,
    "format": "parquet",
    "rowCount": 855138,
    "downloadDuration": "00:01:58.3520561"
  }
}
Apache Doris supports flexible schemas through the following two mechanisms:
- Light Schema Change: When top-level fields change occasionally, schema changes such as
ADD/DROP COLUMNandADD/DROP INDEXcan be completed in seconds. At the planning stage you only need to consider which fields currently need indexes. - VARIANT semi-structured type: For extension fields such as
properties, you can write arbitrary JSON data; field names and types are detected automatically, and frequently appearing fields are split into columnar storage. You can also create inverted indexes onVARIANTto speed up queries and searches on internal fields.
Compared with Elasticsearch's dynamic mapping, Apache Doris's flexible schema has the following advantages:
- Allows multiple types for the same field.
VARIANTautomatically handles conflicts and promotes types, adapting better to the iterative changes of log data. VARIANTautomatically merges infrequent fields into a single column, avoiding performance issues caused by too many fields, metadata, or columns.- Supports dynamic column addition and removal, and dynamic index addition and removal, so you do not need to create indexes for all fields up front, which reduces unnecessary cost.
3. Operations guide
The following table lists the end-to-end six-step process for building a log platform on Apache Doris:
| Step | Purpose |
|---|---|
| Step 1: Estimate resources | Estimate the number of FE/BE nodes, disk capacity, and object storage size |
| Step 2: Deploy the cluster | Deploy Apache Doris on physical or virtual machines |
| Step 3: Tune FE and BE configurations | Adjust key parameters for log scenarios |
| Step 4: Create the table | Design partitioning and bucketing, compression, compaction, indexes, and tiering policies |
| Step 5: Collect logs | Integrate with Logstash, Filebeat, Kafka, or a custom program |
| Step 6: Query and analyze logs | Search and analyze logs through SQL and visualization tools |
3.1 Estimate resources
Before deploying the cluster, you need to estimate server hardware resources. The key steps are as follows:
-
Estimate write resources with the following formulas:
Average write throughput = Daily incremental data / 86400 sPeak write throughput = Average write throughput * Peak-to-average write ratioCPU cores required for peak writes = Peak write throughput / Per-core write throughput
-
Estimate storage resources with the following formula:
Required storage = Daily incremental data / Compression ratio * Replica count * Data retention period
-
Estimate query resources: Query resource consumption varies with query volume and complexity. As an initial budget, reserve 50% of CPU resources for queries, then adjust based on actual testing.
-
Aggregate resources: Estimate the required CPU cores from steps 1 and 3, then divide by the per-machine CPU cores to get the number of BE servers. Combine this with step 2 to estimate the required storage per BE server, and spread it across 4 to 12 data disks to compute the per-disk capacity.
Example: Resource estimation for 100 TB of new logs per day
Take the following conditions as an example: 100 TB of new data per day (before compression), a compression ratio of 5, 1 replica, hot data retained for 3 days, cold data retained for 30 days, a peak-to-average write ratio of 200%, a per-core write throughput of 10 MB/s, and 50% of CPU reserved for queries. The estimates are:
- FE: 3 servers, each with 16 CPU cores, 64 GB memory, and one 100 GB SSD
- BE: 15 servers, each with 32 CPU cores, 256 GB memory, and ten 600 GB SSDs
- S3 object storage: cold-data storage space, 600 TB
The values and computations of the key metrics are listed below:
| Key metric (unit) | Value | Description |
|---|---|---|
| Daily incremental data (TB) | 100 | Fill in based on actual needs |
| Compression ratio | 5 | Typically 3 to 10 (including indexes); fill in based on actual needs |
| Replica count | 1 | Fill in based on actual needs; default 1; possible values: 1, 2, 3 |
| Hot data retention (days) | 3 | Fill in based on actual needs |
| Cold data retention (days) | 30 | Fill in based on actual needs |
| Total retention (days) | 33 | Formula: Hot data retention + Cold data retention |
| Estimated hot-data storage (TB) | 60 | Formula: Daily incremental data / Compression ratio * Replica count * Hot data retention |
| Estimated cold-data storage (TB) | 600 | Formula: Daily incremental data / Compression ratio * Replica count * Cold data retention |
| Peak-to-average write ratio | 200% | Fill in based on actual needs; default 200% |
| CPU cores per machine | 32 | Fill in based on actual needs; default 32 cores |
| Average write throughput (MB/s) | 1214 | Formula: Daily incremental data / 86400 s |
| Peak write throughput (MB/s) | 2427 | Formula: Average write throughput * Peak-to-average write ratio |
| CPU cores required for peak writes | 242.7 | Formula: Peak write throughput / Per-core write throughput |
| CPU reserved for queries | 50% | Fill in based on actual needs; default 50% |
| Estimated number of BE servers | 15.2 | Formula: CPU cores required for peak writes / CPU cores per machine / (1 - CPU reserved for queries) |
| Estimated number of BE servers (rounded) | 15 | Formula: MAX(Replica count, rounded estimated number of BE servers) |
| Estimated storage per BE server (TB) | 5.7 | Formula: Estimated hot-data storage / Estimated number of BE servers / (1 - 30%), where 30% is the storage reserve. It is recommended to mount 4 to 12 data disks per BE to improve I/O capacity |
3.2 Deploy the cluster
After resource estimation, you can deploy the Apache Doris cluster. Deployment on physical or virtual machines is recommended; for manual deployment steps, refer to Manual deployment.
3.3 Tune FE and BE configurations
After cluster deployment, tune the FE and BE parameters separately to better fit log storage and analysis scenarios.
3.3.1 Tune FE configurations
In fe/conf/fe.conf, adjust the FE configurations according to the following table:
| Parameter to adjust | Description |
|---|---|
max_running_txn_num_per_db = 10000 | High-concurrency ingestion has many running transactions, so this parameter is raised |
streaming_label_keep_max_second = 3600label_keep_max_second = 7200 | Frequent ingestion transaction labels consume more memory, so the retention time is shortened |
enable_round_robin_create_tablet = true | Use round-robin when creating tablets to keep distribution as even as possible |
tablet_rebalancer_type = partition | Use a strategy that keeps tablets as even as possible within each partition during balancing |
autobucket_min_buckets = 10 | Raise the minimum auto-bucketing count from 1 to 10 to avoid running out of buckets when log volume grows |
max_backend_heartbeat_failure_tolerance_count = 10 | BE servers are under heavy pressure in log scenarios and may briefly miss heartbeats; raise the tolerance count from 1 to 10 |
For more parameter information, refer to FE configuration.
3.3.2 Tune BE configurations
In be/conf/be.conf, adjust the BE configurations according to the following table:
| Module | Parameter to adjust | Description |
|---|---|---|
| Storage | storage_root_path = /path/to/dir1;/path/to/dir2;...;/path/to/dir12 | Configure the storage paths for hot data on the disk directories |
| Storage | enable_file_cache = true | Enable file cache |
| Storage | file_cache_path = [{"path": "/mnt/datadisk0/file_cache", "total_size":53687091200, "query_limit": "10737418240"},{"path": "/mnt/datadisk1/file_cache", "total_size":53687091200,"query_limit": "10737418240"}] | Configure the cache paths and settings for cold data:path: cache pathtotal_size: total size of the cache path, in bytes; 53687091200 bytes = 50 GBquery_limit: maximum data a single query can read from the cache path, in bytes; 10737418240 bytes = 10 GB |
| Write | write_buffer_size = 1073741824 | Increase the write buffer file size to reduce small files and random I/O, improving performance |
| Compaction | max_cumu_compaction_threads = 8 | Set to CPU cores / 4, meaning 1/4 of CPU is for writes, 1/4 for background compaction, and 1/2 is reserved for queries and other operations |
| Compaction | inverted_index_compaction_enable = true | Enable index compaction to reduce CPU consumption during compaction |
| Compaction | enable_segcompaction = falseenable_ordered_data_compaction = false | Disable two compaction features that are not needed in log scenarios |
| Compaction | enable_compaction_priority_scheduling = false | Low-priority compaction is limited to 2 tasks per disk, which slows compaction speed |
| Compaction | total_permits_for_compaction_score = 200000 | Used to control memory; the time-series policy itself can control memory |
| Cache | disable_storage_page_cache = trueinverted_index_searcher_cache_limit = 30% | Log data volume is large, so the data cache offers limited benefit; disable the data cache and use the index cache instead |
| Cache | inverted_index_cache_stale_sweep_time_sec = 3600index_cache_entry_stay_time_after_lookup_s = 3600 | Keep the index cache in memory for as long as one hour |
| Cache | enable_inverted_index_cache_on_cooldown = trueenable_write_index_searcher_cache = false | Enable automatic caching of indexes when uploading them to cold storage |
| Cache | tablet_schema_cache_recycle_interval = 3600segment_cache_capacity = 20000 | Reduce the memory used by other caches |
| Cache | inverted_index_ram_dir_enable = true | Reduce I/O overhead caused by index temporary files during writes |
| Threads | pipeline_executor_size = 24doris_scanner_thread_pool_thread_num = 48 | Compute and I/O thread settings for a 32-core CPU; scale up or down proportionally based on core count |
| Threads | scan_thread_nice_value = 5 | Lower the priority of query I/O threads to ensure write performance and timeliness |
| Other | string_type_length_soft_limit_bytes = 10485760 | Raise the length limit for String data to 10 MB |
| Other | trash_file_expire_time_sec = 300path_gc_check_interval_second = 900path_scan_interval_second = 900 | Speed up the recycling of trash files |
For more parameter information, refer to BE configuration.
3.4 Create the table
Because both writes and queries on log data have distinct characteristics, follow the targeted configurations in the sections below when creating the table to improve performance.
3.4.1 Configure partitioning and bucketing parameters
Partitioning:
- Use Range partitioning on the time field (
PARTITION BY RANGE(ts)) and enable Dynamic partitioning ("dynamic_partition.enable" = "true") to manage daily partitions automatically. - Use a
Datetimetime field as the key (DUPLICATE KEY(ts)); this provides a multi-fold speedup when querying the latest N logs.
Bucketing:
- Set the number of buckets to roughly 3 times the total number of disks in the cluster, with about 5 GB of compressed data per bucket.
- Use the random strategy (
DISTRIBUTED BY RANDOM BUCKETS 60), combined with single-tablet ingestion at write time, to improve batch write efficiency.
For more partitioning and bucketing information, refer to Data partitioning.
3.4.2 Configure compression parameters
- Use the Zstd compression algorithm (
"compression" = "zstd") to improve the data compression ratio.
3.4.3 Configure compaction parameters
- Use the time-series policy (
"compaction_policy" = "time_series") to mitigate write amplification, which is critical for the resource consumption of high-throughput log writes.
3.4.4 Build and configure indexes
- Build indexes on frequently queried fields (
USING INVERTED). - For fields that need full-text search, set the tokenizer (
parser) parameter tounicode, which fits most needs. To support phrase queries, setsupport_phrasetotrue; set it tofalsewhen not needed to reduce storage footprint.
3.4.5 Configure storage policies
- Hot data storage: When using cloud disks, you can configure 1 replica; when using physical disks, configure at least 2 replicas (
"replication_num" = "2"). - Hot-cold tiering: Configure the
log_s3storage location (CREATE RESOURCE "log_s3") and set thelog_policy_3daytiering policy (CREATE STORAGE POLICY log_policy_3day) so that data older than 3 days is automatically cooled to the storage location specified bylog_s3.
3.4.6 Complete table creation example
CREATE DATABASE log_db;
USE log_db;

CREATE RESOURCE "log_s3"
PROPERTIES
(
    "type" = "s3",
    "s3.endpoint" = "your_endpoint_url",
    "s3.region" = "your_region",
    "s3.bucket" = "your_bucket",
    "s3.root.path" = "your_path",
    "s3.access_key" = "your_ak",
    "s3.secret_key" = "your_sk"
);

CREATE STORAGE POLICY log_policy_3day
PROPERTIES(
    "storage_resource" = "log_s3",
    "cooldown_ttl" = "259200"
);

CREATE TABLE log_table
(
  `ts` DATETIME,
  `host` TEXT,
  `path` TEXT,
  `message` TEXT,
  INDEX idx_host (`host`) USING INVERTED,
  INDEX idx_path (`path`) USING INVERTED,
  INDEX idx_message (`message`) USING INVERTED PROPERTIES("parser" = "unicode", "support_phrase" = "true")
)
ENGINE = OLAP
DUPLICATE KEY(`ts`)
PARTITION BY RANGE(`ts`) ()
DISTRIBUTED BY RANDOM BUCKETS 60
PROPERTIES (
  "compression" = "zstd",
  "compaction_policy" = "time_series",
  "dynamic_partition.enable" = "true",
  "dynamic_partition.create_history_partition" = "true",
  "dynamic_partition.time_unit" = "DAY",
  "dynamic_partition.start" = "-30",
  "dynamic_partition.end" = "1",
  "dynamic_partition.prefix" = "p",
  "dynamic_partition.buckets" = "60",
  "dynamic_partition.replication_num" = "2", -- Not needed in compute-storage separation
  "replication_num" = "2",                    -- Not needed in compute-storage separation
  "storage_policy" = "log_policy_3day"        -- Not needed in compute-storage separation
);
3.5 Collect logs
After creating the table, you can start collecting logs. Apache Doris provides an open, general-purpose Stream HTTP API that integrates with common log collectors (Logstash, Filebeat, Kafka, etc.). The following table summarizes the applicable scenarios for each collection method:
| Collection method | Applicable scenario |
|---|---|
| Logstash | Existing Logstash pipelines that need a rich filter and plugin ecosystem |
| Filebeat | Lightweight file collection in resource-sensitive scenarios |
| Kafka Routine Load | Logs already landed in Kafka, with Doris pulling them actively |
| Custom program (Stream Load) | In-house collection programs and integration with special data sources |
3.5.1 Integrate with Logstash
Follow these steps:
-
Download and install the Logstash Doris Output plugin. Choose one of the following methods:
-
Direct download: click here to download.
-
Build from source, then install with the following command:
./bin/logstash-plugin install logstash-output-doris-1.2.0.gem
-
-
Configure Logstash. The following two files are required:
-
logstash.yml: Configure the batch size and delay used by Logstash for log batching, to improve write performance.pipeline.batch.size: 1000000
pipeline.batch.delay: 10000 -
logstash_demo.conf: Configure the input path of the collected logs and the settings for output to Apache Doris.input {
file {
path => "/path/to/your/log"
}
}
output {
doris {
http_hosts => [ "<http://fehost1:http_port>", "<http://fehost2:http_port>", "<http://fehost3:http_port>" ]
user => "your_username"
password => "your_password"
db => "your_db"
table => "your_table"
# doris stream load http headers
headers => {
"format" => "json"
"read_json_by_line" => "true"
"load_to_single_tablet" => "true"
}
# field mapping: doris field name => logstash field name
# %{} to get a logstash field, [] for nested field such as [host][name] for host.name
mapping => {
"ts" => "%{@timestamp}"
"host" => "%{[host][name]}"
"path" => "%{[log][file][path]}"
"message" => "%{message}"
}
log_request => true
log_speed_interval => 10
}
}
-
-
Run Logstash to collect logs and output them to Apache Doris:
./bin/logstash -f logstash_demo.conf
For more configuration details, refer to Logstash Doris Output Plugin.
3.5.2 Integrate with Filebeat
Follow these steps:
-
Get a Filebeat binary that supports output to Apache Doris. You can click here to download it or build it from the Apache Doris source.
-
Configure Filebeat. The main file is
filebeat_demo.yml, which configures the input path of the collected logs and the settings for output to Apache Doris:# input
filebeat.inputs:
- type: log
enabled: true
paths:
- /path/to/your/log
# multiline can join lines that span multiple lines (such as Java stack traces) into a single log
multiline:
type: pattern
# Behavior: lines starting with yyyy-mm-dd HH:MM:SS are treated as a new log; others are appended to the previous log
pattern: '^[0-9]{4}-[0-9]{2}-[0-9]{2} [0-9]{2}:[0-9]{2}:[0-9]{2}'
negate: true
match: after
skip_newline: true
processors:
# Use the js script plugin to replace \t in the log with spaces, to avoid JSON parsing errors
- script:
lang: javascript
source: >
function process(event) {
var msg = event.Get("message");
msg = msg.replace(/\t/g, " ");
event.Put("message", msg);
}
# Use the dissect plugin for simple log parsing
- dissect:
# 2024-06-08 18:26:25,481 INFO (report-thread|199) [ReportHandler.cpuReport():617] begin to handle
tokenizer: "%{day} %{time} %{log_level} (%{thread}) [%{position}] %{content}"
target_prefix: ""
ignore_failure: true
overwrite_keys: true
# queue and batch
queue.mem:
events: 1000000
flush.min_events: 100000
flush.timeout: 10s
# output
output.doris:
fenodes: [ "http://fehost1:http_port", "http://fehost2:http_port", "http://fehost3:http_port" ]
user: "your_username"
password: "your_password"
database: "your_db"
table: "your_table"
# output string format
## %{[agent][hostname]} %{[log][file][path]} are metadata that come with filebeat
## Another commonly used filebeat metadata is the collection timestamp %{[@timestamp]}
## %{[day]} %{[time]} are the fields parsed by the dissect step above
codec_format_string: '{"ts": "%{[day]} %{[time]}", "host": "%{[agent][hostname]}", "path": "%{[log][file][path]}", "message": "%{[message]}"}'
headers:
format: "json"
read_json_by_line: "true"
load_to_single_tablet: "true" -
Run Filebeat to collect logs and output them to Apache Doris:
chmod +x filebeat-doris-2.1.1
./filebeat-doris-2.1.1 -c filebeat_demo.yml
For more configuration details, refer to Beats Doris Output Plugin.
3.5.3 Integrate with Kafka
Write JSON-formatted logs to a Kafka message queue, then create a Kafka Routine Load to have Apache Doris actively pull data from Kafka.
Refer to the example below, where property.* are settings for the Librdkafka client; adjust them according to your actual Kafka cluster:
-- Prepare the kafka cluster and topic log__topic_
-- Create a routine load that imports data from kafka log__topic_ into the log_table table
CREATE ROUTINE LOAD load_log_kafka ON log_db.log_table
COLUMNS(ts, host, path, message)
PROPERTIES (
"max_batch_interval" = "60",
"max_batch_rows" = "20000000",
"max_batch_size" = "1073741824",
"load_to_single_tablet" = "true",
"format" = "json"
)
FROM KAFKA (
"kafka_broker_list" = "host:port",
"kafka_topic" = "log__topic_",
"property.group.id" = "your_group_id",
"property.security.protocol"="SASL_PLAINTEXT",
"property.sasl.mechanism"="GSSAPI",
"property.sasl.kerberos.service.name"="kafka",
"property.sasl.kerberos.keytab"="/path/to/xxx.keytab",
"property.sasl.kerberos.principal"="<xxx@yyy.com>"
);
-- Check the status of the routine load
SHOW ROUTINE LOAD;
For more Kafka configuration details, refer to Routine Load.
3.5.4 Use a custom program to collect logs
In addition to integrating with common log collectors, you can also import logs through a custom program using the HTTP API Stream Load:
curl
--location-trusted
-u username:password
-H "format:json"
-H "read_json_by_line:true"
-H "load_to_single_tablet:true"
-H "timeout:600"
-T logfile.json
http://fe_host:fe_http_port/api/log_db/log_table/_stream_load
When using a custom program, note the following key points:
- Use Basic Auth for HTTP authentication. You can compute the value with the command
echo -n 'username:password' | base64. - Set the HTTP header
format:jsonto specify the data format as JSON. - Set the HTTP header
read_json_by_line:trueto specify one JSON per line. - Set the HTTP header
load_to_single_tablet:trueto write each ingestion into a single bucket, reducing small files. - It is recommended that the client send batches of 100 MB to 1 GB. With Apache Doris 2.1 or later, the server-side Group Commit feature lets you reduce the client-side batch size.
3.6 Query and analyze logs
3.6.1 Log queries
Apache Doris supports standard SQL. You can connect to the cluster through a MySQL client, JDBC, or other tools to run SQL queries:
mysql -h fe_host -P fe_mysql_port -u your_username -Dyour_db_name
The following lists 5 common SQL query commands for reference:
-
View the latest 10 records:
SELECT * FROM your_table_name ORDER BY ts DESC LIMIT 10; -
Query the latest 10 records where
hostis8.8.8.8:SELECT * FROM your_table_name WHERE host = '8.8.8.8' ORDER BY ts DESC LIMIT 10; -
Search for the latest 10 records where the
messagefield containserroror404.MATCH_ANYis the SQL syntax for full-text search in Apache Doris and matches any of the keywords in the argument:SELECT * FROM your_table_name WHERE message MATCH_ANY 'error 404'
ORDER BY ts DESC LIMIT 10; -
Search for the latest 10 records where the
messagefield contains bothimageandfaq.MATCH_ALLis the SQL syntax for full-text search in Apache Doris and matches all of the keywords in the argument:SELECT * FROM your_table_name WHERE message MATCH_ALL 'image faq'
ORDER BY ts DESC LIMIT 10; -
Search for the latest 10 records where the
messagefield contains bothimageandfaq.MATCH_PHRASEis the SQL syntax for full-text search in Apache Doris and matches all of the keywords in the argument with the same order. For example,a image faq bmatches, buta faq image bdoes not:SELECT * FROM your_table_name WHERE message MATCH_PHRASE 'image faq'
ORDER BY ts DESC LIMIT 10;
3.6.2 Visual log analysis
Some third-party vendors provide visual log analysis platforms based on Apache Doris, including a Kibana Discover-like log search and analysis interface that offers an intuitive, easy-to-use exploratory log analysis experience:
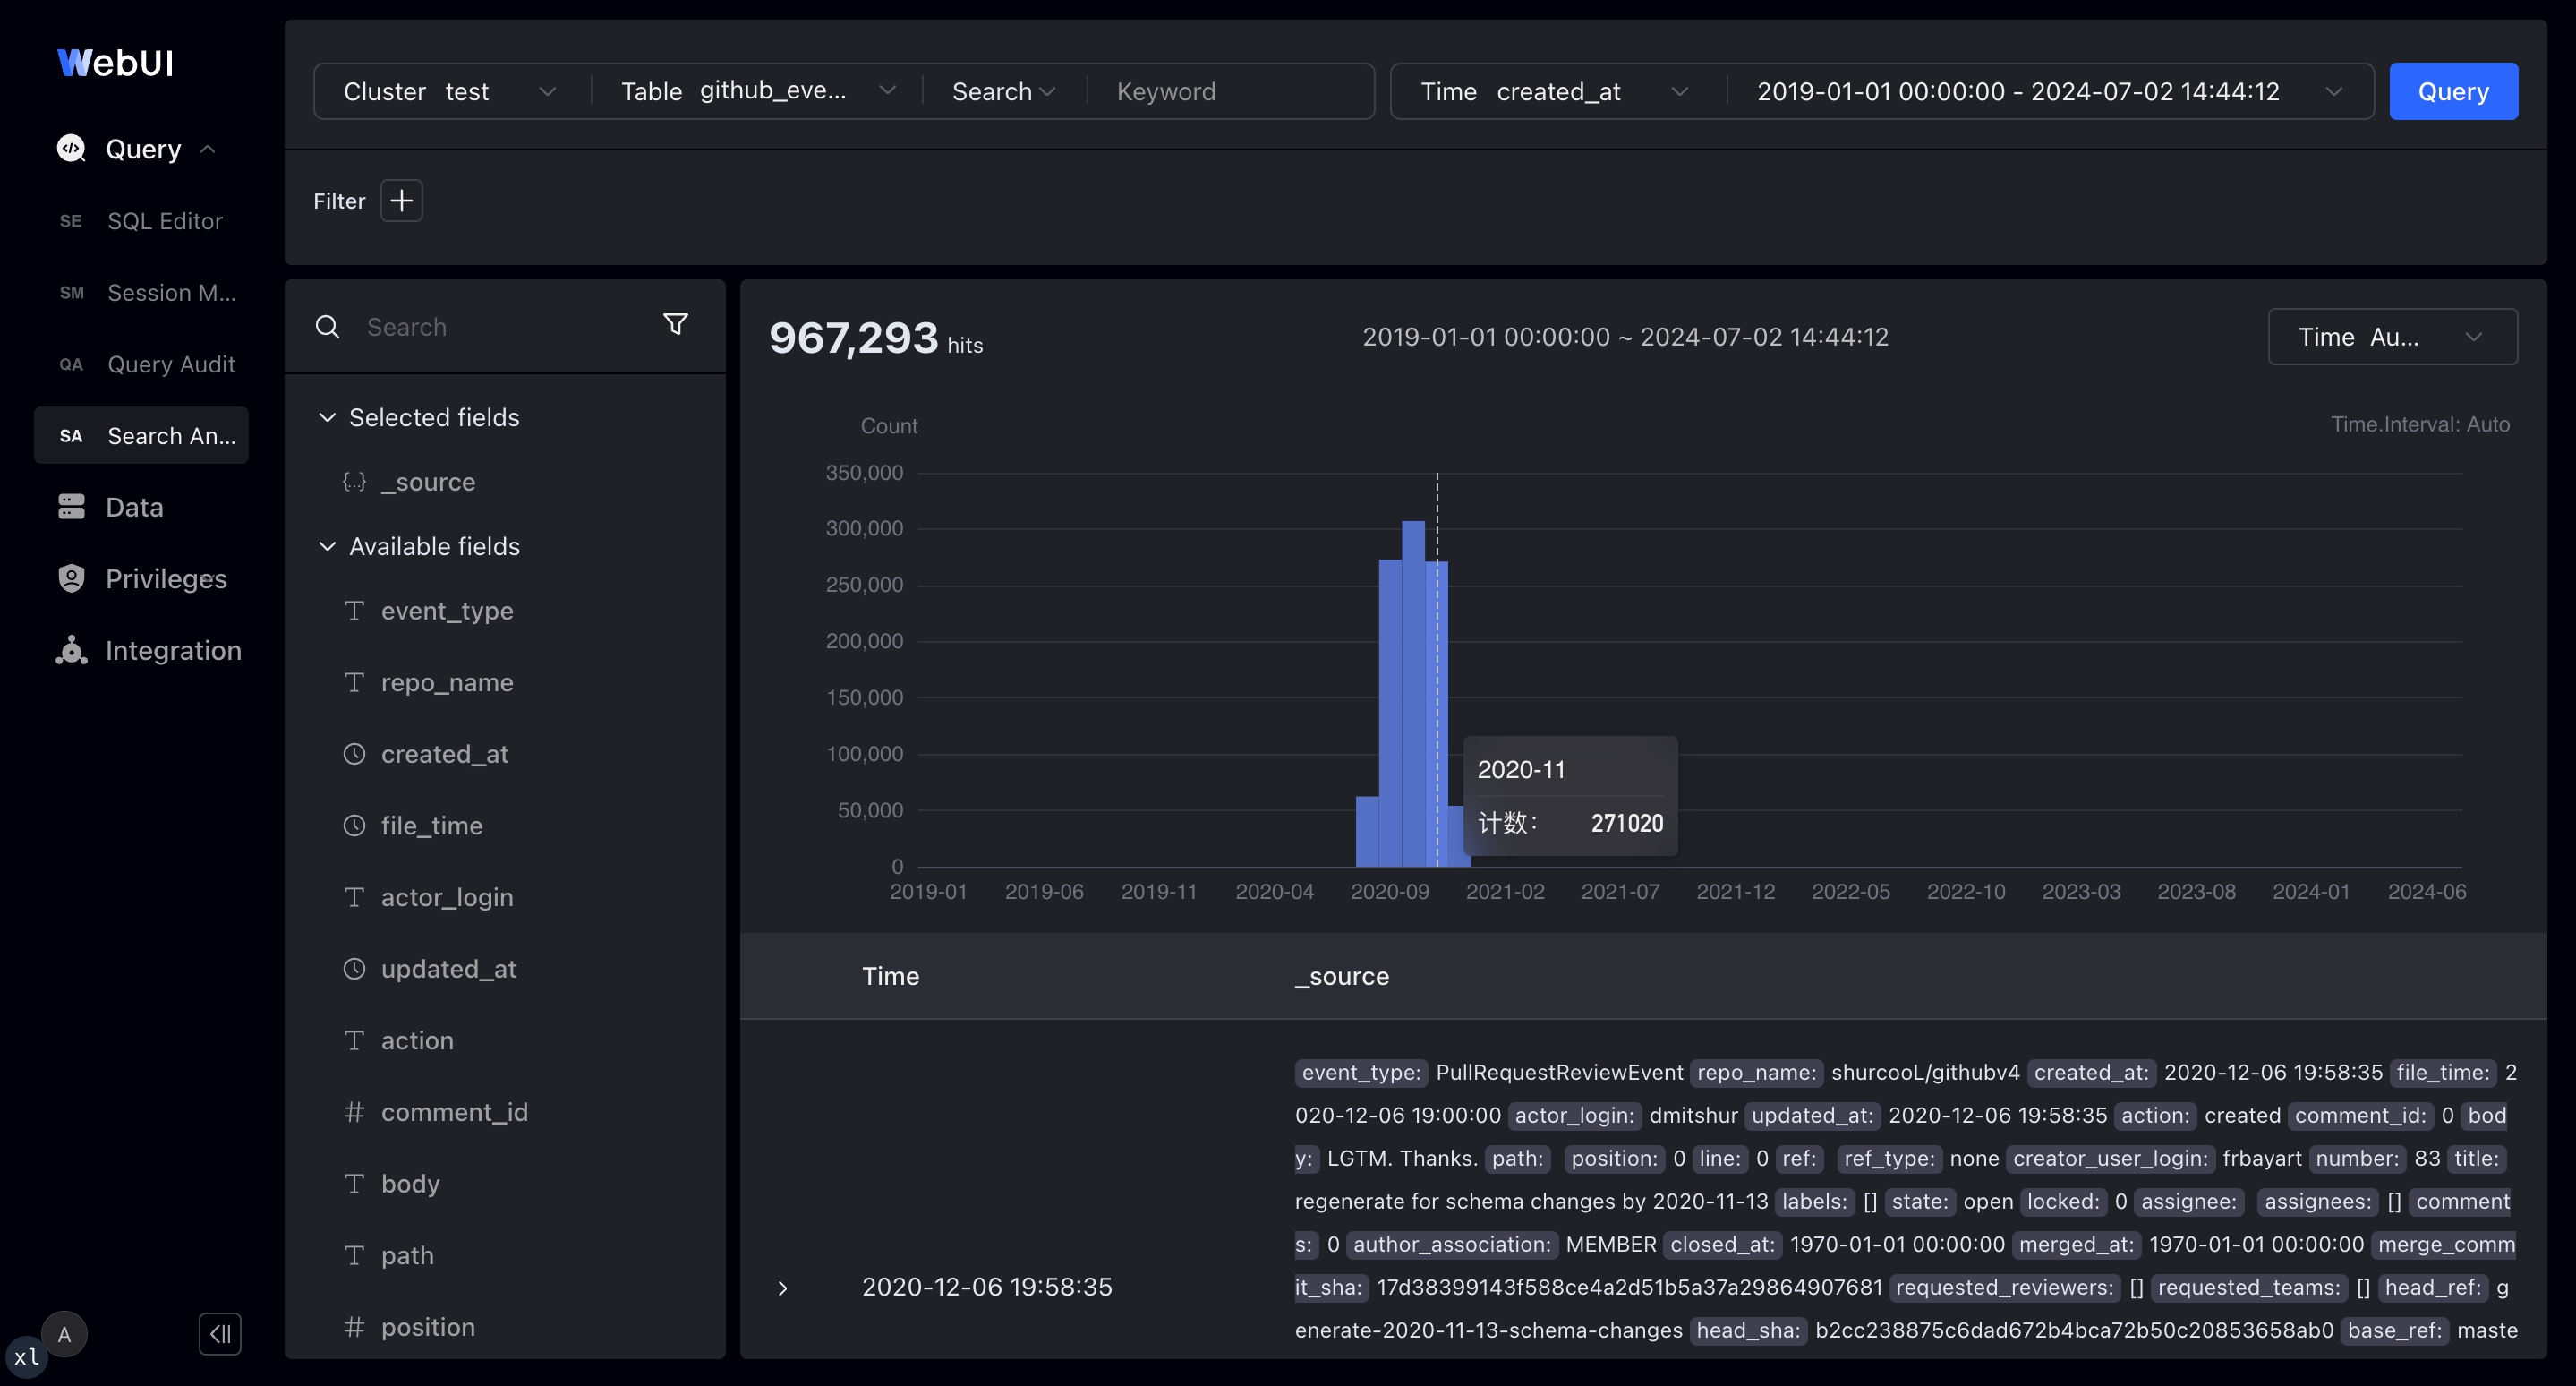
- Supports both full-text search and SQL modes
- Supports selecting the time range for log queries on a time picker and histogram
- Supports rich log detail views that can be expanded into JSON or tables
- Allows interactive click-to-add or click-to-remove filters in the context of log data
- Shows the top values of fields in the search results, helping you spot anomalies and drill down further
If you need more help, contact dev@doris.apache.org.
4. FAQ
Q1: What are the core differences between Apache Doris and Elasticsearch in log scenarios?
A: Doris write throughput is 3 to 5 times that of Elasticsearch, and the storage cost is only about 20% of Elasticsearch. Doris also supports standard SQL and the MySQL protocol, providing stronger analytical capabilities. Hot-cold tiering can move cold data to S3/HDFS, further reducing storage cost.
Q2: Log fields change frequently. How should you handle this?
A: Use Light Schema Change to perform ADD/DROP COLUMN and ADD/DROP INDEX on top-level fields in seconds. For dynamic nested fields, use the VARIANT type, which automatically detects field names and types and supports inverted indexes on VARIANT.
Q3: How should you choose the number of buckets?
A: Set the number of buckets to roughly 3 times the total number of disks in the cluster, with about 5 GB of compressed data per bucket. Combine this with DISTRIBUTED BY RANDOM and single-tablet writes to improve batch write efficiency.
Q4: What is the unit of cooldown_ttl in the hot-cold tiering policy?
A: The unit is seconds. For example, 259200 means 3 days, after which data is automatically cooled to the object storage location specified by the storage policy.
Q5: How should you choose the batch size at the write side?
A: A batch size of 100 MB to 1 GB per request is recommended. With Apache Doris 2.1 or later, you can enable the server-side Group Commit feature and use a smaller batch size on the client.
5. Troubleshooting
| Symptom | Possible cause | Recommended action |
|---|---|---|
| High-concurrency ingestion exceeds transaction limit | The default value of max_running_txn_num_per_db is too small | Raise max_running_txn_num_per_db = 10000 |
| BE heartbeat times out frequently | Heavy log write pressure causes BE to be unresponsive briefly | Raise max_backend_heartbeat_failure_tolerance_count = 10 |
| Writes generate many small files / random I/O | Write buffer is too small or single-tablet ingestion is not used | Raise write_buffer_size = 1073741824 and set load_to_single_tablet:true |
| Compaction is slow and impacts writes | Insufficient compaction threads or low-priority scheduling limit | Set max_cumu_compaction_threads to CPU cores / 4 and disable enable_compaction_priority_scheduling |
| Index memory usage is too high | Data cache and index cache compete for memory | Disable disable_storage_page_cache and limit inverted_index_searcher_cache_limit = 30% |
| Phrase queries in full-text search do not work | The index does not have support_phrase enabled | Set "support_phrase" = "true" when creating the index |
| Auto-bucketing produces too few buckets, causing hotspots | autobucket_min_buckets is too small | Raise autobucket_min_buckets = 10 |