Performance Tuning Process Guide
Performance tuning in Doris is a systematic effort that requires methodological guidance. Doris provides diagnostic tools and analysis tools to support systematic diagnosis, enabling efficient identification, analysis, and resolution of performance issues.
Pre-tuning self-check checklist:
- You have confirmed the presence of slow SQL or performance degradation.
- You have access to FE node logs or Doris Manager.
- You are familiar with the schema design and query patterns of the business tables.
- You understand basic analysis tools such as
EXPLAINandProfile.
The complete four-step tuning process is as follows:
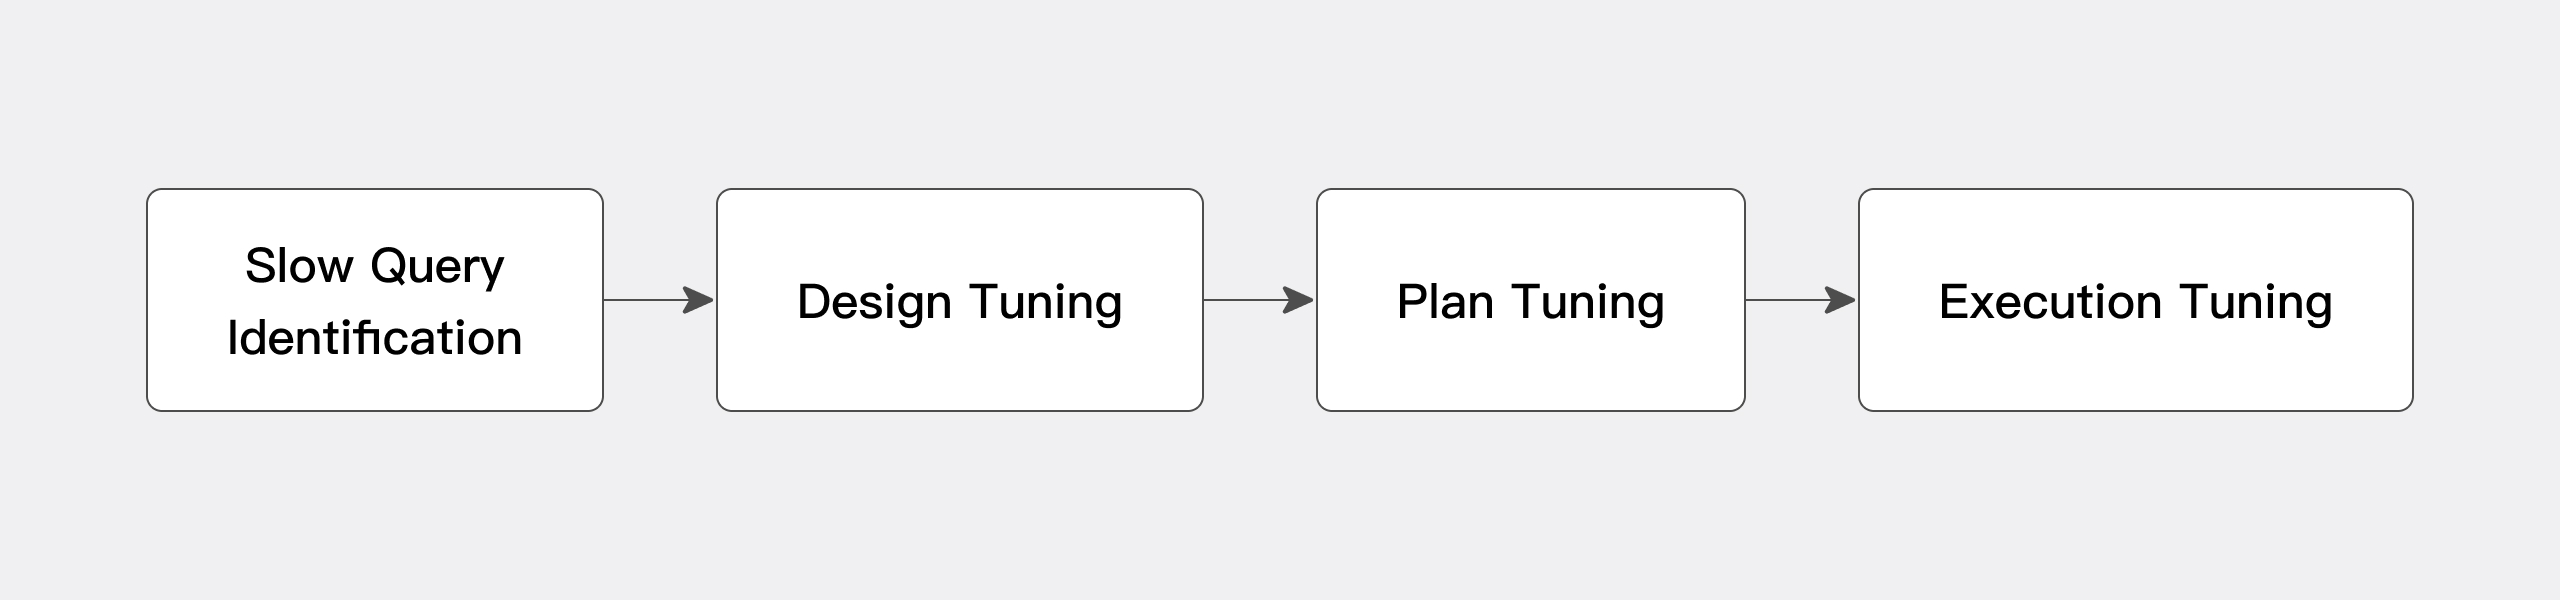
| Step | Phase | Core Goal | Main Tools |
|---|---|---|---|
| Step 1 | Slow query identification | Identify the SQL statements that need tuning | Doris Manager, fe.audit.log, audit_log table |
| Step 2 | Schema tuning | Eliminate design-level bottlenecks | Partitioning and bucketing, indexes, Colocate Group |
| Step 3 | Plan tuning | Optimize the execution plan | EXPLAIN, materialized views, Hint |
| Step 4 | Execution tuning | Optimize runtime performance | Profile, Runtime Filter, parallelism parameters |
Step 1: Slow query identification
Goal: Filter out the slow SQL statements in the business system that need tuning.
Approach:
| Scenario | Recommended Approach | Description |
|---|---|---|
| Doris Manager is deployed | Use the Manager log page | Visual interface that makes filtering and sorting easier |
| Doris Manager is not deployed | Query the fe.audit.log on the FE nodes or the audit_log system table | After obtaining the slow SQL list, prioritize and tune the statements in order |
For more information on tool usage, see Diagnostic tools.
Step 2: Schema design and tuning
After identifying the slow SQL, first check the business schema design to rule out performance issues caused at the design level. Schema tuning covers three areas:
| Tuning Direction | Main Content | Reference Documentation |
|---|---|---|
| Table-level schema tuning | Number of partitions and buckets, field types | Optimize table schema |
| Index design tuning | Prefix index, Bloom filter, inverted index, and so on | Optimize table index |
| Specific optimization techniques | Colocate Group, and so on | Use Colocate Group to optimize Join |
For detailed cases, see Plan tuning.
Step 3: Plan tuning
After completing the schema check, you enter the main tuning phase. This phase makes full use of the EXPLAIN tool at each level of Doris to systematically analyze the execution plan of the slow SQL and locate the key optimization points.
Tuning techniques by scenario:
-
Single-table query/analysis scenarios
- Analyze the execution plan and confirm whether partition pruning takes effect.
- Use single-table materialized views to accelerate queries.
-
Complex multi-table analysis scenarios
- Analyze whether the Join Order is reasonable and locate performance bottlenecks.
- Use multi-table materialized views for transparent rewriting to accelerate queries.
- Manually bind the execution plan via Hint:
-
Specific acceleration scenarios
For detailed cases, see Plan tuning.
Step 4: Execution tuning
In the execution tuning phase, you need to verify the effect of plan tuning based on the actual runtime behavior of the SQL, and continue to analyze execution-side bottlenecks, such as time distribution across execution stages or insufficient parallelism.
Taking a multi-table analytical query as an example, you can check the following with Profile:
- Whether the Join order chosen by the planner is reasonable.
- Whether Runtime Filter takes effect.
- Whether the parallelism meets expectations.
- Machine load (such as slow IO or network transmission performance not meeting expectations).
For machine-load issues, you need to use system-level tools to assist with diagnosis. For detailed cases, see Execution tuning.
When analyzing a specific performance issue, the recommended order is to check the plan first and tune the execution second. First use EXPLAIN to confirm the execution plan, and then use Profile to locate execution performance issues. Reversing the order may lead to inefficiency and make it harder to quickly identify the problem.
FAQ
Q1: Should you do schema tuning or plan tuning first?
Schema tuning should be done first. Unreasonable schema design (such as incorrect partitioning/bucketing fields or missing necessary indexes) prevents the execution plan itself from being optimized. Resolving schema issues first avoids repeatedly tuning on top of a flawed foundation.
Q2: What is the difference between EXPLAIN and Profile?
| Tool | Output | Phase of Use |
|---|---|---|
EXPLAIN | Static execution plan (does not actually run) | Plan tuning |
Profile | Runtime time and resource metrics from actual execution | Execution tuning |
Q3: What should you do when the Join Order is not reasonable?
Examine the EXPLAIN output and use Leading Hint to manually specify the Join order.
Q4: How do you handle issues such as slow IO or slow network?
Profile can reflect machine load, but root-cause identification requires combining operating-system-level tools (such as iostat, sar, and netstat) to investigate hardware or network bottlenecks.
Summary
Doris provides multi-dimensional tuning tools that support full-chain diagnosis from slow query identification, schema design, and execution plans to runtime performance. Business users and DBAs are encouraged to follow the four-step process of "identification -> schema -> plan -> execution" for systematic tuning, so as to fully unleash the performance advantages of Doris.