
Overview
Apache Doris provides Query Profile to expose query execution details. This article covers the overall architecture and practical guidance, including:
- Collection workflow: how Profile is collected from Backends and stored on Frontend.
- Collection-related parameters: how to configure to filter noise and focus on key query details.
- Reading methods: how to quickly locate operators that impact performance.
Query Profile Architecture
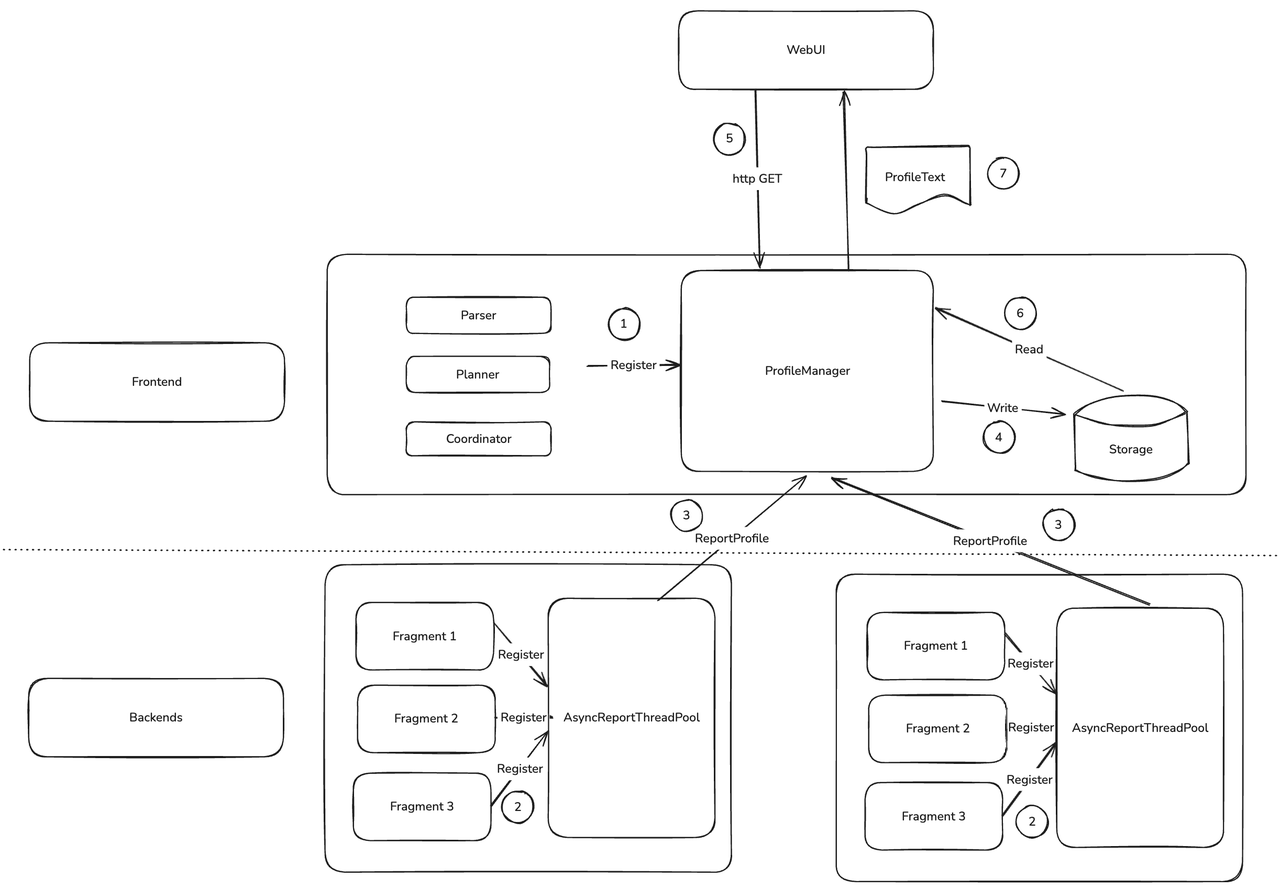
The core consists of FE ProfileManager and BE AsyncReportThreadPool.
- When a query starts, FE registers Profile-related data structures into
ProfileManager. - After a BE query finishes, it registers its Profile as a task into an async reporting thread pool to FE.
- BE
AsyncReportThreadPoolsends Profile data to FE via RPC, per-query. - FE background threads process and manage collected Profiles, decide retention and eviction, and compress and persist suitable Profiles.
- Users view Profiles via Web UI or curl.
ProfileManagerfetches Profiles from memory or external storage and returns them as text.
Async reporting and persistence have the greatest impact on Profile behavior.
Under heavy load, async reporting may time out. To avoid excessive memory usage on FE, ProfileManager abandons timed-out Profiles after waiting for a while. You can adjust profile_async_collect_expire_time_secs in fe.conf. If timeouts are frequent, check resource usage first; turning off global Profile may be safer.
Persisting Profiles to disk ensures:
- Profiles no longer occupy FE memory.
- Profiles remain queryable after FE restarts.
This allows FE to retain thousands of complete Profiles and makes it easier to compare before/after upgrades to validate performance improvements.
Configure Profile
Enable Profile
enable_profile
When false, Profile is not generated. Default: false.
mysql> select 1;
...
mysql> show query profile;
...
profile_level
Default: 1. Effective in 4.0 and master branches. Do not use this parameter in versions prior to 4.0; earlier versions have different semantics.
By default, BE reports a concise Profile (enough for FE to build MergedProfile). For more details with minimal impact, set profile_level=2. The maximum is 3; at level 3, collecting some counters may affect performance.
Example: default EXCHANGE_OPERATOR counters:
EXCHANGE_OPERATOR(id=1):
     - InstanceID: ef33b72e30b84b68-82ad027edbee5910
     - BlocksProduced: 1
     - CloseTime: 4.243us
     - ExecTime: 30.834us
     - InitTime: 20.902us
     - MemoryUsage: 0.00
     - MemoryUsagePeak: 36.00 KB
     - OpenTime: 1.93us
     - ProjectionTime: 0ns
     - RowsProduced: 10
     - WaitForDependencyTime: 0ns
       - WaitForData0: 635.324us
With profile_level=2, more counters appear:
EXCHANGE_OPERATOR(id=1):
     - InstanceID: 514023de1b7b41a3-9e59e43c591103a2
     - BlocksProduced: 1
     - CloseTime: 3.523us
     - CreateMergerTime: 0ns
     - DataArrivalWaitTime: 0ns
     - DecompressBytes: 0.00
     - DecompressTime: 0ns
     - DeserializeRowBatchTimer: 0ns
     - ExecTime: 28.439us
     - FilterTime: 287ns
     - FirstBatchArrivalWaitTime: 0ns
     - GetDataFromRecvrTime: 3.482us
     - InitTime: 18.258us
     - LocalBytesReceived: 36.00 KB
     - MaxFindRecvrTime(NS): 0
     - MaxWaitForWorkerTime: 0
     - MaxWaitToProcessTime: 0
     - MemoryUsage: 0.00
     - MemoryUsagePeak: 36.00 KB
     - OpenTime: 1.44us
     - ProjectionTime: 0ns
     - RemoteBytesReceived: 0.00
     - RowsProduced: 10
     - SendersBlockedTotalTimer(*): 0ns
     - WaitForDependencyTime: 0ns
       - WaitForData0: 596.708us
auto_profile_threshold_ms
Default: -1. Effective from 3.0.
Globally enabling Profile can generate大量 entries, consuming FE CPU/memory/disk and affecting latency-sensitive small queries, so FE periodically cleans Profiles. To avoid losing a slow query Profile, use this parameter to only generate and retain Profiles when query time exceeds the threshold. -1 means generate Profiles for all queries.
Example: with global Profile on, all queries generate Profiles. Set a threshold to skip trivial ones:
mysql> clean all profile;
mysql> set global auto_profile_threshold_ms=1000;
...
mysql> show query profile;

Empty set (0.00 sec)
Configure Profile Storage
Doris can persist Profiles on FE local disk to keep more records. Configure in fe.conf:
max_query_profile_num
Default: 500. Max Profiles kept in FE memory. Excess are evicted from oldest.
max_spilled_profile_num
Default: 500. Max Profiles stored on disk. Excess are deleted from oldest.
spilled_profile_storage_path
Local directory for Profiles. Default: log/profile.
spilled_profile_storage_limit_bytes
Default: 1 GB. Max total disk space occupied by Profiles.
Retrieve Profiles
Via FE Web UI
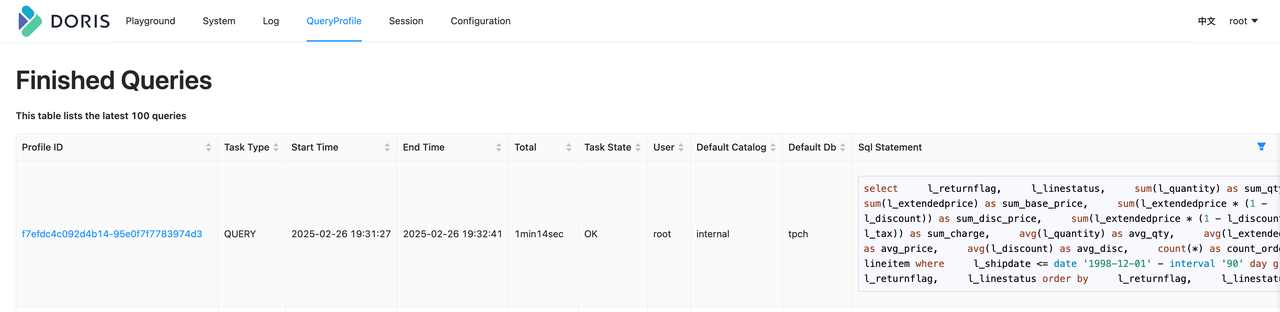
Visit FE ip:http_port and log in. Open QueryProfile to view all Profiles on the current FE, click Profile ID for details.
Notes:
- Profiles exist only on the FE that executed the SQL; they are not synchronized across FEs. Connect to the FE used by the query.
- Import jobs are forwarded to FE Master for execution, so their Profiles must be fetched from the Master FE.
Via command line
When FE Web UI is unavailable (e.g., security constraints), use CLI. First, show query profile to list the latest 20 profiles.
mysql> show query profile;
...
Fetch a specific Profile via HTTP API, e.g., ID f7efdc4c092d4b14-95e0f7f7783974d3:
curl -uroot: http://127.0.0.1:5937/api/profile/text?query_id=f7efdc4c092d4b14-95e0f7f7783974d3 > f7efdc4c092d4b14-95e0f7f7783974d3.profile
The result matches Web UI:
> head f7efdc4c092d4b14-95e0f7f7783974d3.profile -n 10
Summary:
   - Profile ID: f7efdc4c092d4b14-95e0f7f7783974d3
   - Task Type: QUERY
   - Start Time: 2025-02-26 19:31:27
   - End Time: 2025-02-26 19:32:41
   - Total: 1min14sec
   - Task State: OK
   - User: root
   - Default Catalog: internal
   - Default Db: tpch
From disk directly
From 3.0 on, Profiles can be persisted. Default directory: log/profile. For faster viewing, unzip the target file to get text output. Notes:
- Doris FE protects
log/profile; do not keep the unzipped output inside, or it will be deleted. - Text format differs slightly from Web UI:
Summaryis saved as JSON meta, the rest matches Web UI.
unzip profile/1740745121714_33bf38e988ea4945-b585d2f74d1da3fd.zip
head 33bf38e988ea4945-b585d2f74d1da3fd.profile -n 10
Profile Structure
Profile content comprises:
- Summary
SummaryProfileis the metadata, recording key fields for retrieval, such asProfile ID,Total.
-  Profile  ID:  d4d281168bf7490a-a133623295744f85
-  Task  Type:  QUERY
-  Start  Time:  2025-02-28  19:23:14
-  End  Time:  2025-02-28  19:23:16
-  Total:  2sec420ms
-  Task  State:  OK
- ExecutionSummary Summary of execution. Plan-related fields record Planner time.
- ChangedSessionVariables Session variables changed during execution.
ChangedSessionVariables:
VarName                       | CurrentValue | DefaultValue
------------------------------|--------------|-------------
insert_visible_timeout_ms     | 10000        | 60000
fetch_splits_max_wait_time_ms | 4000         | 1000
exec_mem_limit                | 2147483648   | 100147483648
profile_level                 | 2            | 1
auto_profile_threshold_ms     | 1            | -1
- MergedProfile
Aggregation of
DetailProfile. Main purposes:
- Clarify query plan and Pipeline structure.
Doris has a Query → Fragment → PlanNode hierarchy for planning; the executor schedules by Pipeline, each consisting of Operators. MergedProfile clearly shows the transformation from plan to Pipeline. Examples below show how to reconstruct plan and Pipeline.
- Quickly locate bottleneck operators.
Use DependencyWaitTime in MergedProfile to find the most time-consuming operator, then inspect its details in DetailProfile.
- Compare data skew.
By comparing InputRows and RowsProduced, you can judge whether data is uneven across Backends, which often causes slow or failed queries.
- DetailProfile
The detailed execution information. DetailProfile records, for each Fragment and Pipeline, the PipelineTask execution across Backends. After locating the bottleneck in MergedProfile, use DetailProfile for deep analysis.
Example: Reading a Profile
Consider a typical query with Aggregation, Join and Scan on the TPCH dataset: join customer and orders, then aggregate.
SELECT c.c_name,
       Count(o.o_orderkey) AS total_orders,
       Sum(o.o_totalprice) AS total_spent
FROM   customer c
       JOIN orders o
         ON c.c_custkey = o.o_custkey
GROUP  BY c.c_name
LIMIT  20
To keep the Profile concise, limit parallelism:
set parallel_pipeline_task_num=2;
After running and fetching the Profile via Web UI, focus on MergedProfile. For brevity, only key fields are shown:
MergedProfile:
     Fragments:
       Fragment 0:
         Pipeline 0(instance_num=1):
           RESULT_SINK_OPERATOR(id=0):
             CommonCounters:
                - ExecTime: avg 176.545us, max 176.545us, min 176.545us
                - InputRows: sum 20, avg 20, max 20, min 20
                - WaitForDependency[RESULT_SINK_OPERATOR_DEPENDENCY]Time: avg 0ns, max 0ns, min 0ns
             CustomCounters:
           EXCHANGE_OPERATOR(id=8):
             CommonCounters:
                - ExecTime: avg 84.559us, max 84.559us, min 84.559us
                - RowsProduced: sum 20, avg 20, max 20, min 20
             CustomCounters:
                - WaitForDependencyTime: avg 0ns, max 0ns, min 0ns
                  - WaitForData0: avg 11sec450ms, max 11sec450ms, min 11sec450ms
       Fragment 1:
         Pipeline 0(instance_num=2):
           DATA_STREAM_SINK_OPERATOR(dest_id=8):
            CommonCounters:
              - ExecTime: avg 31.515us, max 33.405us, min 29.626us
              - InputRows: sum 20, avg 10, max 11, min 9
              - WaitForDependencyTime: avg 0ns, max 0ns, min 0ns
               - WaitForRpcBufferQueue: avg 0ns, max 0ns, min 0ns
            CustomCounters:
             - BlocksProduced: sum 2, avg 1, max 1, min 1
          SORT_OPERATOR(nereids_id=443)(id=7):
           CommonCounters:
             - ExecTime: avg 980ns, max 1.199us, min 762ns
             - RowsProduced: sum 20, avg 10, max 11, min 9
             - WaitForDependency[SORT_OPERATOR_DEPENDENCY]Time: avg 11sec450ms, max 11sec450ms, min 11sec450ms
           CustomCounters:
        Pipeline 1(instance_num=2):
          SORT_SINK_OPERATOR(nereids_id=443)(id=7):
           CommonCounters:
             - ExecTime: avg 49.414us, max 54.802us, min 44.27us
             - InputRows: sum 20, avg 10, max 11, min 9
             - WaitForDependency[SORT_SINK_OPERATOR_DEPENDENCY]Time: avg 0ns, max 0ns, min 0ns
           CustomCounters:
          AGGREGATION_OPERATOR(nereids_id=438)(id=6):
           CommonCounters:
             - ExecTime: avg 34.521us, max 36.402us, min 32.640us
             - RowsProduced: sum 20, avg 10, max 11, min 9
             - WaitForDependency[AGGREGATION_OPERATOR_DEPENDENCY]Time: avg 11sec450ms, max 11sec450ms, min 11sec450ms
           CustomCounters:
        Pipeline 2(instance_num=2):
          AGGREGATION_SINK_OPERATOR(nereids_id=438)(id=6):
           CommonCounters:
             - ExecTime: avg 109.89us, max 118.582us, min 99.596us
             - InputRows: sum 40, avg 20, max 22, min 18
             - WaitForDependency[AGGREGATION_SINK_OPERATOR_DEPENDENCY]Time: avg 0ns, max 0ns, min 0ns
           CustomCounters:
          EXCHANGE_OPERATOR(id=5):
           CommonCounters:
             - ExecTime: avg 29.741us, max 34.521us, min 24.962us
             - RowsProduced: sum 40, avg 20, max 22, min 18
           CustomCounters:
             - WaitForDependencyTime: avg 0ns, max 0ns, min 0ns
              - WaitForData0: avg 11sec450ms, max 11sec450ms, min 11sec450ms
       Fragment 2:
        Pipeline 0(instance_num=2):
          DATA_STREAM_SINK_OPERATOR(dest_id=5):
           CommonCounters:
             - ExecTime: avg 71.148us, max 73.242us, min 69.54us
             - InputRows: sum 40, avg 20, max 20, min 20
             - WaitForDependencyTime: avg 0ns, max 0ns, min 0ns
              - WaitForRpcBufferQueue: avg 0ns, max 0ns, min 0ns
           CustomCounters:
          AGGREGATION_OPERATOR(nereids_id=428)(id=4):
           CommonCounters:
             - ExecTime: avg 350.431us, max 393.100us, min 307.762us
             - RowsProduced: sum 40, avg 20, max 20, min 20
             - WaitForDependency[AGGREGATION_OPERATOR_DEPENDENCY]Time: avg 11sec30ms, max 11sec450ms, min 10sec610ms
           CustomCounters:
        Pipeline 1(instance_num=2):
          AGGREGATION_SINK_OPERATOR(nereids_id=428)(id=4):
           CommonCounters:
             - ExecTime: avg 442.308ms, max 449.109ms, min 435.506ms
             - InputRows: sum 150.0M (150000000), avg 75.0M (75000000), max 75.000001M (75000001), min 74.999999M (74999999)
             - MemoryUsage: sum 2.05 MB, avg 1.03 MB, max 1.03 MB, min 1.03 MB
             - MemoryUsagePeak: sum 2.05 MB, avg 1.03 MB, max 1.03 MB, min 1.03 MB
             - WaitForDependency[AGGREGATION_SINK_OPERATOR_DEPENDENCY]Time: avg 0ns, max 0ns, min 0ns
           CustomCounters:
             - MemoryUsageHashTable: sum 1.03 MB, avg 526.28 KB, max 526.28 KB, min 526.28 KB
             - MemoryUsageSerializeKeyArena: sum 1.02 MB, avg 524.00 KB, max 524.00 KB, min 524.00 KB
          HASH_JOIN_OPERATOR(nereids_id=418)(id=3):
           CommonCounters:
             - ExecTime: avg 9sec169ms, max 9sec582ms, min 8sec756ms
             - RowsProduced: sum 150.0M (150000000), avg 75.0M (75000000), max 75.000001M (75000001), min 74.999999M (74999999)
             - WaitForDependency[HASH_JOIN_OPERATOR_DEPENDENCY]Time: avg 949.860ms, max 962.978ms, min 936.743ms
           CustomCounters:
             - ProbeRows: sum 150.0M (150000000), avg 75.0M (75000000), max 75.000001M (75000001), min 74.999999M (74999999)
          OLAP_SCAN_OPERATOR(nereids_id=397. table_name=orders(orders))(id=2):
           CommonCounters:
             - ExecTime: avg 396.233ms, max 410.306ms, min 382.160ms
             - RowsProduced: sum 150.0M (150000000), avg 75.0M (75000000), max 75.000001M (75000001), min 74.999999M (74999999)
           CustomCounters:
             - WaitForDependency[OLAP_SCAN_OPERATOR_DEPENDENCY]Time: avg 0ns, max 0ns, min 0ns
        Pipeline 2(instance_num=2):
          HASH_JOIN_SINK_OPERATOR(nereids_id=418)(id=3):
           CommonCounters:
             - ExecTime: avg 445.146ms, max 890.258ms, min 34.635us
             - InputRows: sum 15.0M (15000000), avg 7.5M (7500000), max 15.0M (15000000), min 0
             - WaitForDependency[HASH_JOIN_SINK_OPERATOR_DEPENDENCY]Time: avg 482.355ms, max 964.711ms, min 0ns
           CustomCounters:
             - MemoryUsageHashTable: sum 185.22 MB, avg 92.61 MB, max 185.22 MB, min 0.00
          EXCHANGE_OPERATOR(id=1):
           CommonCounters:
             - ExecTime: avg 10.131ms, max 20.243ms, min 19.26us
             - RowsProduced: sum 15.0M (15000000), avg 7.5M (7500000), max 15.0M (15000000), min 0
           CustomCounters:
             - WaitForDependencyTime: avg 0ns, max 0ns, min 0ns
              - WaitForData0: avg 47.582ms, max 47.582ms, min 47.582ms
       Fragment 3:
        Pipeline 0(instance_num=2):
          DATA_STREAM_SINK_OPERATOR(dest_id=1):
           CommonCounters:
             - ExecTime: avg 3.269ms, max 3.281ms, min 3.258ms
             - InputRows: sum 15.0M (15000000), avg 7.5M (7500000), max 7.500001M (7500001), min 7.499999M (7499999)
             - WaitForDependencyTime: avg 0ns, max 0ns, min 0ns
              - WaitForLocalExchangeBuffer0: avg 142.859ms, max 285.713ms, min 6.733us
              - WaitForRpcBufferQueue: avg 0ns, max 0ns, min 0ns
           CustomCounters:
          OLAP_SCAN_OPERATOR(nereids_id=403. table_name=customer(customer))(id=0):
           CommonCounters:
             - ExecTime: avg 77.435ms, max 78.752ms, min 76.118ms
             - RowsProduced: sum 15.0M (15000000), avg 7.5M (7500000), max 7.500001M (7500001), min 7.499999M (7499999)
           CustomCounters:
             - WaitForDependency[OLAP_SCAN_OPERATOR_DEPENDENCY]Time: avg 49.690ms, max 50.522ms, min 48.858ms
The above is a trimmed MergedProfile. Doris query planning has a three-level structure: Query → Fragment → PlanNode, while the BE execution engine further introduces Pipeline → Operator.
Query & Fragment & PlanNode
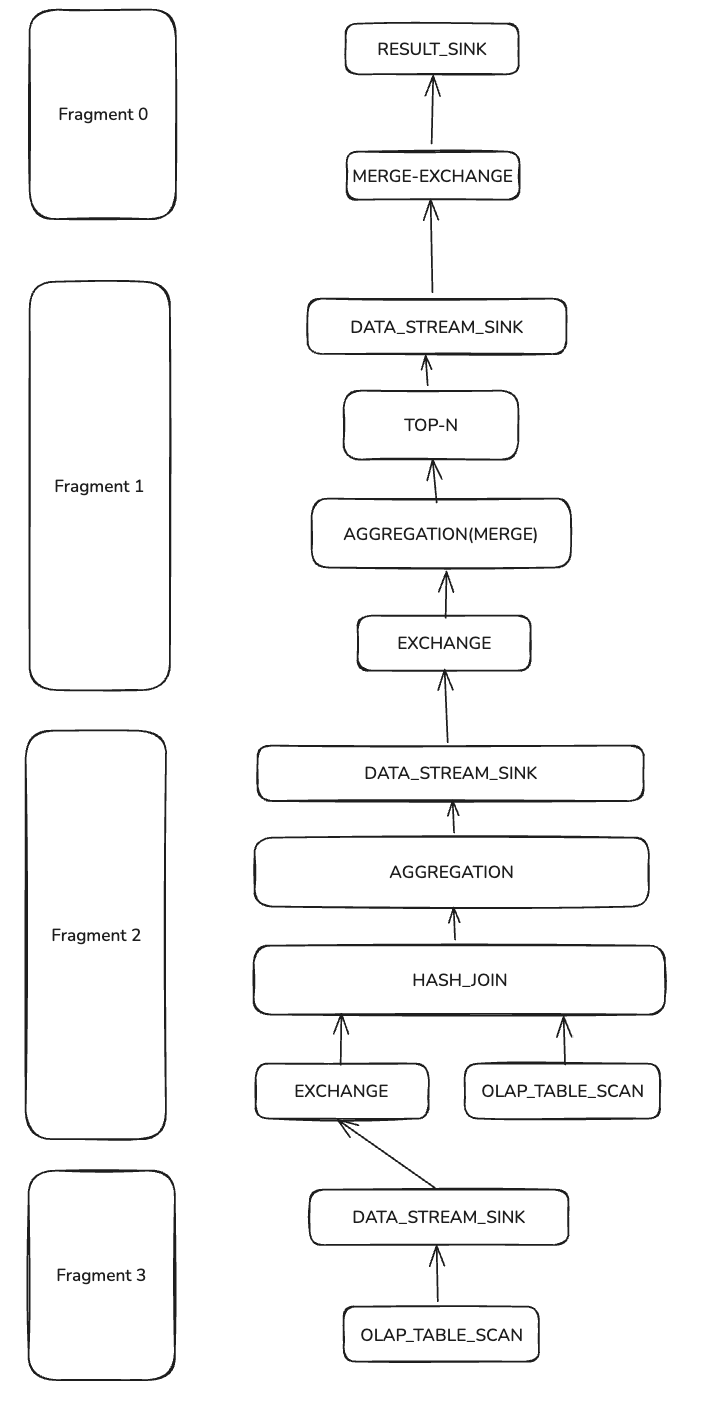
Arrows indicate data flow. The entire query plan is split into 4 Fragments (left blocks) and multiple PlanNodes (Fragment and its PlanNodes on the same horizontal line). PlanNodes include two SCAN_NODEs reading customer and orders, multiple DATA_STREAM_SINK and EXCHANGE nodes for inter-Fragment data transfer, HASH_JOIN to join scanned data, and two-phase aggregation (AGGREGATION and AGGREGATION(MERGE)). RESULT_SINK returns results to FE, preceded by TOP-N to limit rows.
Pipeline & Operator
How does the QueryPlan translate to Pipelines and Operators? Take Fragments 1 and 2 (with AGGREGATION and HASH_JOIN) as examples.
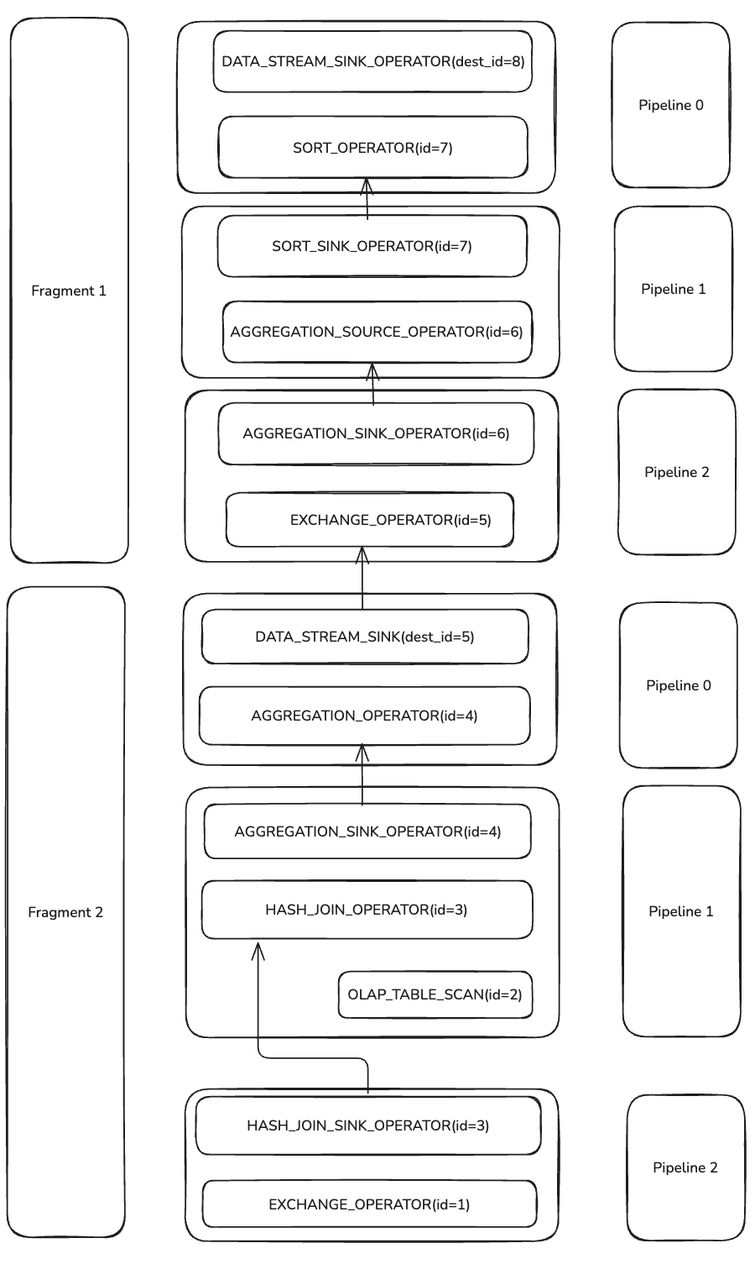
During execution, Doris splits certain PlanNodes into one or more Operators.
- DATA_STREAM_SINK becomes DATA_STREAM_SINK_OPERATOR, which outputs data from a Fragment. It has no OperatorId, only a destination OperatorId;
dest_id=5means it sends data toEXCHANGE_OPERATOR(id=5). - HASH_JOIN with
PlanNodeId=3becomes HASH_JOIN_SINK_OPERATOR and HASH_JOIN_OPERATOR, both with Operator Id 3 (same as PlanNodeId). - Phase-1 AGGREGATION and Phase-2 AGGREGATION(MERGE) are each split into a pair of SINK and SOURCE operators.
Operators are linked into Pipelines. Each of Fragments 1 and 2 has 3 Pipelines. Operators inside a Pipeline stream data without blocking; operators that connect Pipelines do block due to logical dependencies (e.g., Probe waits for Build to finish hash-table construction) or system constraints (e.g., EXCHANGE_OPERATOR waiting for network data from DATA_STREAM_SINK_OPERATOR).
Scheduling non-blocking operators together in Pipelines improves resource utilization and cache locality.
CommonCounters & CustomCounters
CommonCounters are mandatory for all Operators in Doris:
- ExecTime: time spent in the current operator (excluding upstream time).
- RowsProduced (non-Sink): rows output by the operator.
- InputRows (Sink): rows consumed by the sink.
- MemoryUsage & MemoryUsagePeak: current and peak memory usage.
- WaitForDependency: time spent waiting on dependencies.
CustomCounters are operator-specific. See the operator profile documentation for details on each counter.
HashJoin
With the basics established, reconstruct the Join execution via MergedProfile.
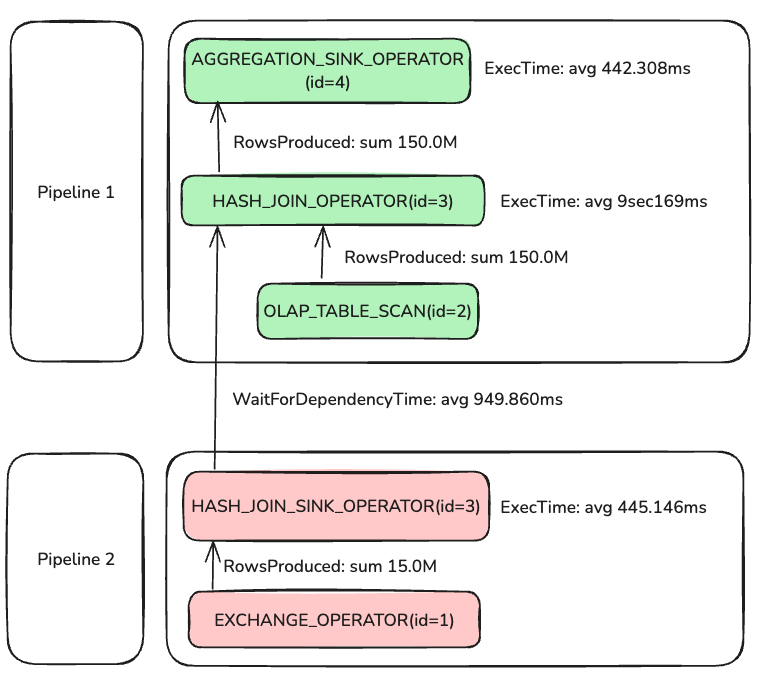
Parallelism was set to 2, so although the diagram shows one connected pair of Pipeline 1 and Pipeline 2, 4 PipelineTasks actually run (2 per pipeline).
Pipeline 0(instance_num=2)
instance_num equals the total PipelineTask count across all BEs. With 1 BE and parallel_pipeline_task_num=2, instance_num=2.
In Pipeline 2, two PipelineTasks processed 15M rows to build the hash table; average build time was 445.146 ms. Pipeline 1 depends on Pipeline 2 completing hash build; the wait shows as WaitForDependency, averaging 949.860 ms. Why is the wait longer than the build? In this case FE planned a BROADCAST_JOIN, and only one of the two PipelineTasks actually performs the build:
HASH_JOIN_SINK_OPERATOR(nereids_id=418)(id=3):
 CommonCounters:
    - ExecTime: avg 445.146ms, max 890.258ms, min 34.635us
    - InputRows: sum 15.0M (15000000), avg 7.5M (7500000), max 15.0M (15000000), min 0
    - WaitForDependency[HASH_JOIN_SINK_OPERATOR_DEPENDENCY]Time: avg 482.355ms, max 964.711ms, min 0ns
 CustomCounters:
    - MemoryUsageHashTable: sum 185.22 MB, avg 92.61 MB, max 185.22 MB, min 0.00
From the MergedProfile, despite parallelism=2, one PipelineTask took 890.258 ms while the other took 34.635 us and processed zero rows—indicating only one task built the hash, explaining:
WaitForDependency[HASH_JOIN_OPERATOR_DEPENDENCY]Time: avg 949.860ms, max 962.978ms, min 936.743ms
Continuing with HASH_JOIN_OPERATOR: after ~949.860 ms of waiting, Probe begins. Two OLAP_SCAN_OPERATOR(id=2) read 150M rows, and all rows feed into AGGREGATION_SINK_OPERATOR, which builds the hash table and continues aggregation.
Aggregation
The query aggregates: Count(o.o_orderkey) AS total_orders, Sum(o.o_totalprice) AS total_spent, and GROUP BY c.c_name.
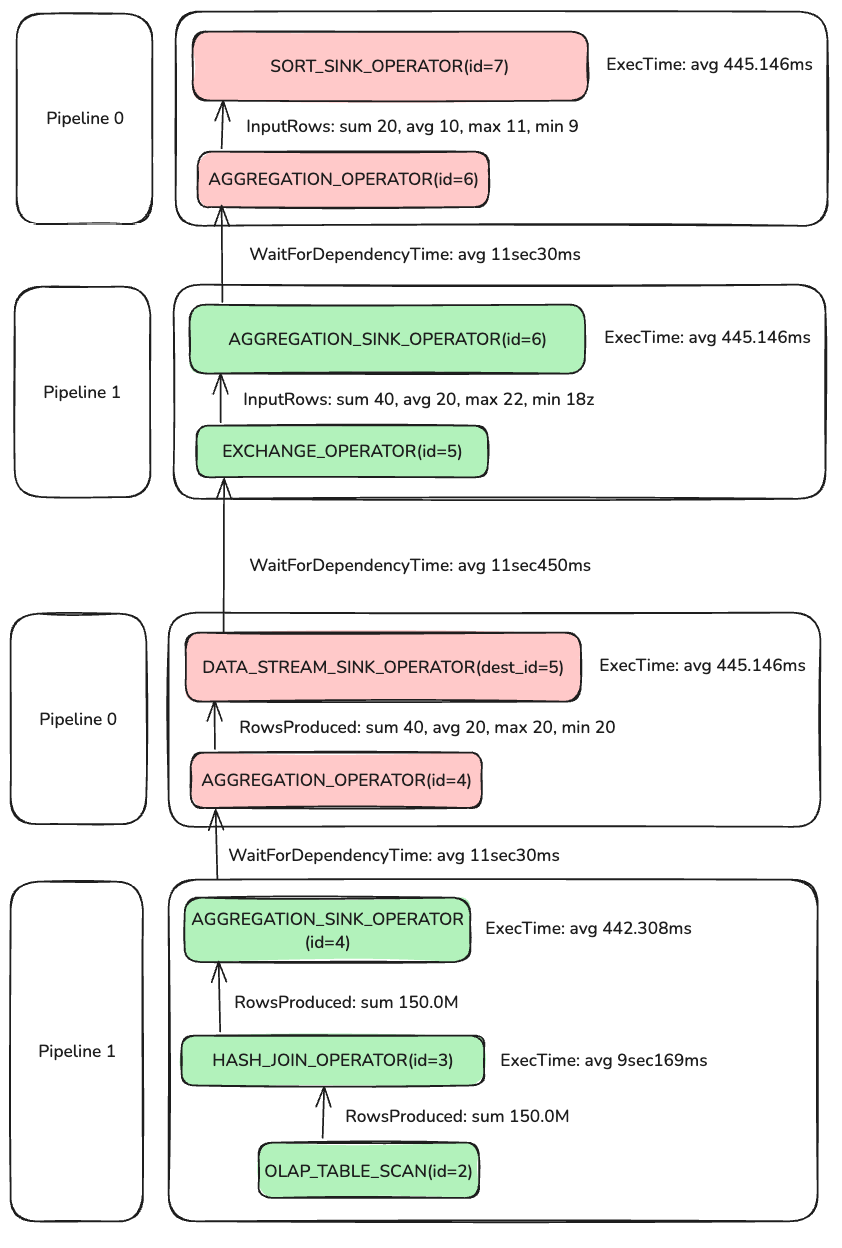
Doris uses two-phase aggregation here.
Phase 1: the AGGREGATION pair with id=4. AGGREGATION_SINK_OPERATOR(id=4) consumes 150M rows, builds a hash table on GROUP BY keys, and updates AggregationData.
After Phase 1, AggregationData is sent via EXCHANGE to Phase 2. Since different PipelineTasks may handle the same GROUP BY key, EXCHANGE partitions by name so identical keys reach the same Phase-2 operator.
AGGREGATION_OPERATOR(id=4) outputs 40 rows, meaning the Phase-1 hash table has 40 entries. Phase 2 AGGREGATION_SINK_OPERATOR(id=6) deserializes Phase-1 results to AggregationData and merges; AGGREGATION_OPERATOR(id=6) then feeds TOP-N. With LIMIT 20, TOP-N stops early after collecting 20 rows.
Overall, the slowest operator is HASH_JOIN_OPERATOR(id=3). After identifying this via MergedProfile, check DetailProfile for fine-grained counters. Refer to operator docs for definitions.