
Aggregate Key Table
Doris's Aggregate Key Table is designed to efficiently handle aggregation operations in large-scale data queries. By performing pre-aggregation on the data, it reduces redundancy in computations and improves query performance. The table stores only aggregated data, omitting raw data, which saves storage space and enhances query performance.
Use Cases
-
Summarizing Detailed Data: The Aggregate Key Table is used in scenarios like e-commerce platforms evaluating monthly sales, financial risk control calculating customer transaction totals, or advertising campaigns analyzing total ad clicks, for multidimensional summarization of detailed data.
-
No Need to Query Raw Detailed Data: For use cases such as dashboard reports or user transaction behavior analysis, where the raw data is stored in a data lake and does not need to be retained in the database, only the aggregated data is stored.
Principle
Each data import creates a version in the Aggregate Key Table, and during the Compaction stage, versions are merged. When querying, data is aggregated by the primary key:
-
Data Import Stage
-
Data is imported into the aggregate key table in batches, with each batch creating a new version.
-
Within each version, data with the same aggregation keys is pre-aggregated (e.g., sum, count, etc.).
-
-
Background File Merging Stage (Compaction)
-
Multiple batches generate multiple version files, which are periodically merged into a larger version file.
-
During the merge process, data with the same aggregation key is re-aggregated to reduce redundancy and optimize storage.
-
-
Query Stage
-
During queries, the system aggregates data with the same aggregation key from all versions to ensure accurate results.
-
This process ensures that aggregation operations are performed efficiently, even with large data volumes. The aggregated results are optimized for fast querying, providing a significant performance improvement over raw data queries
-
Table Creation Instructions
When creating a table, the AGGREGATE KEY keyword can be used to specify the Aggregate Key Table. The Aggregate Key Table must specify Key columns, which are used to aggregate Value columns during storage.
CREATE TABLE IF NOT EXISTS example_tbl_agg
(
    user_id             LARGEINT    NOT NULL,
    load_date           DATE        NOT NULL,
    city                VARCHAR(20),
    last_visit_dt       DATETIME    REPLACE DEFAULT "1970-01-01 00:00:00",
    cost                BIGINT      SUM DEFAULT "0",
    max_dwell           INT         MAX DEFAULT "0",
)
AGGREGATE KEY(user_id, load_date, city)
DISTRIBUTED BY HASH(user_id) BUCKETS 10;
In the example above, a fact table for user information and access behavior is defined, where user_id, load_date, and city are used as Key columns for aggregation. During data import, the Key columns are aggregated into one row, and the Value columns are aggregated according to the specified aggregation types.
The following types of dimension aggregation are supported in the Aggregate Key Table:
| Aggregation Method | Description |
|---|---|
| SUM | Sum, accumulates multiple Value rows. |
| REPLACE | Replacement, the Value in the next batch replaces the previously inserted Value. |
| MAX | Retain the maximum value. |
| MIN | Retain the minimum value. |
| REPLACE_IF_NOT_NULL | Replace non-null values. Unlike REPLACE, null values are not replaced. |
| HLL_UNION | Aggregation method for HLL type columns, using the HyperLogLog algorithm. |
| BITMAP_UNION | Aggregation method for BITMAP type columns, performing bitmap union aggregation. |
If the aggregation methods above do not meet your business requirements, consider using the agg_state type.
Data Insertion and Storage
In the Aggregate Key table, data is aggregated based on the primary key. After data insertion, aggregation operations are completed.
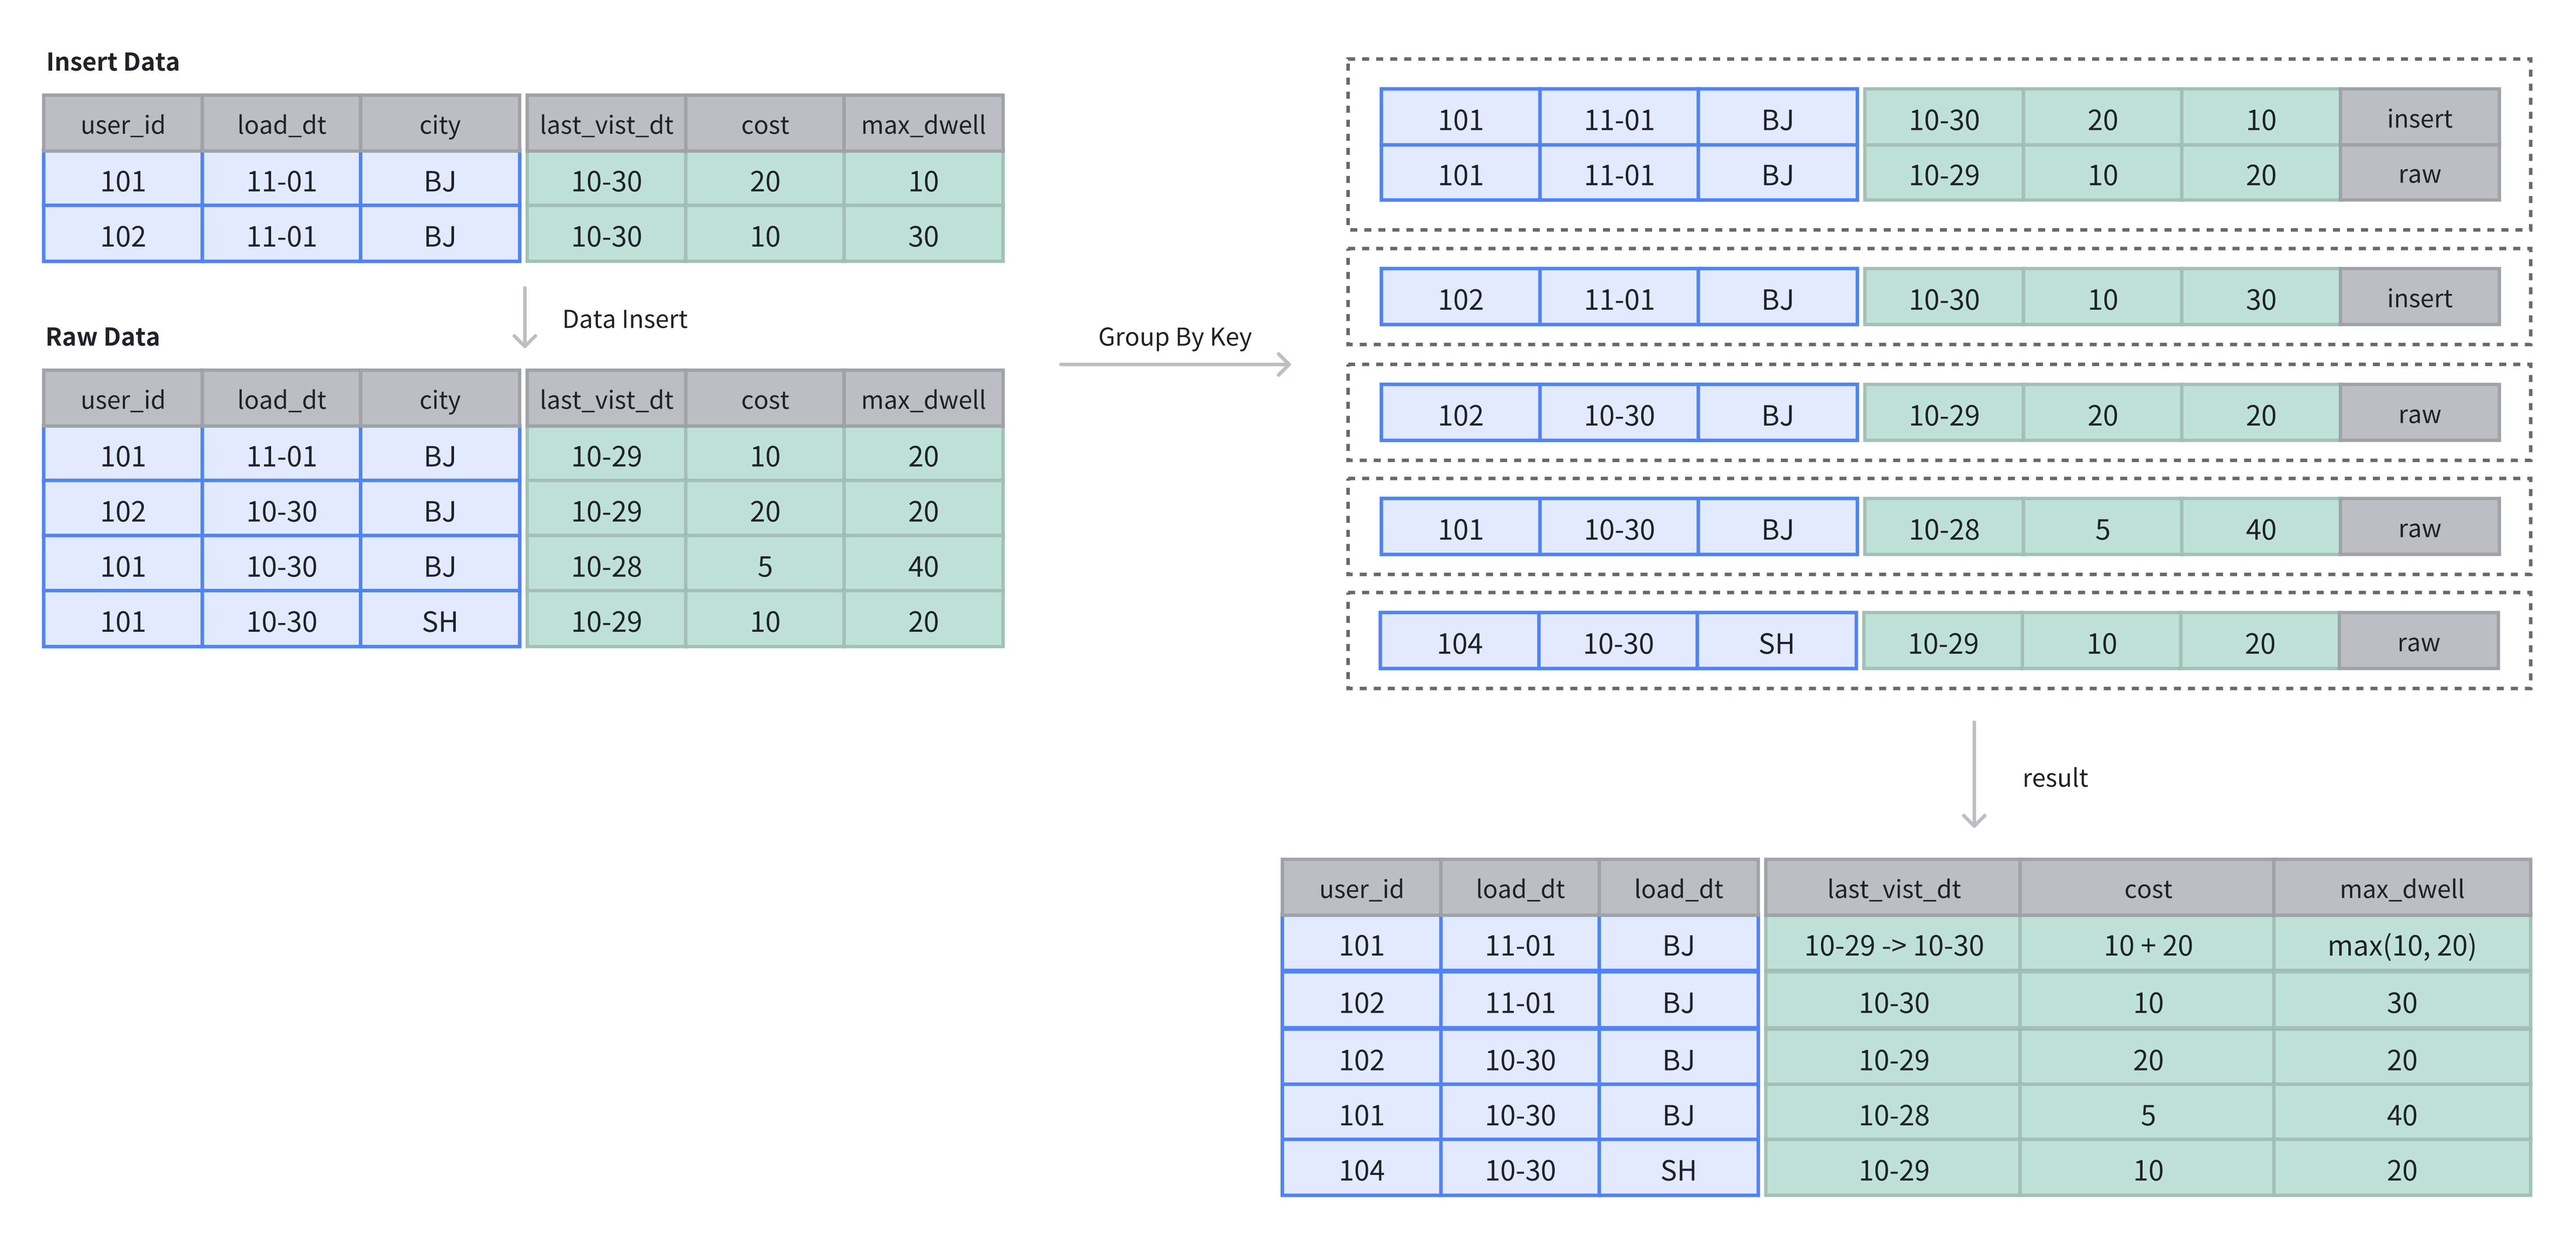
In the example above, there were originally 4 rows of data in the table. After inserting 2 rows, aggregation operations on the dimension columns are performed based on the Key columns:
-- 4 rows raw data
INSERT INTO example_tbl_agg VALUES
(101, '2024-11-01', 'BJ', '2024-10-29', 10, 20),
(102, '2024-10-30', 'BJ', '2024-10-29', 20, 20),
(101, '2024-10-30', 'BJ', '2024-10-28', 5, 40),
(101, '2024-10-30', 'SH', '2024-10-29', 10, 20);

-- insert into 2 rows
INSERT INTO example_tbl_agg VALUES
(101, '2024-11-01', 'BJ', '2024-10-30', 20, 10),
(102, '2024-11-01', 'BJ', '2024-10-30', 10, 30);

-- check the rows of table
SELECT * FROM example_tbl_agg;
+---------+------------+------+---------------------+------+----------------+
| user_id | load_date  | city | last_visit_date     | cost | max_dwell_time |
+---------+------------+------+---------------------+------+----------------+
| 102     | 2024-10-30 | BJ   | 2024-10-29 00:00:00 |   20 |             20 |
| 102     | 2024-11-01 | BJ   | 2024-10-30 00:00:00 |   10 |             30 |
| 101     | 2024-10-30 | BJ   | 2024-10-28 00:00:00 |    5 |             40 |
| 101     | 2024-10-30 | SH   | 2024-10-29 00:00:00 |   10 |             20 |
| 101     | 2024-11-01 | BJ   | 2024-10-30 00:00:00 |   30 |             20 |
+---------+------------+------+---------------------+------+----------------+
AGG_STATE
::: Info Tips: AGG_STATE is an experimental feature and is recommended for use in development and testing environments. :::
AGG_STATE cannot be used as a Key column. The aggregation function's signature must be declared when creating the table. Users don’t need to specify length or default values. The data storage size depends on the function implementation.
set enable_agg_state = true;
CREATE TABLE aggstate(
    k1   int  NULL,
    v1   int  SUM,
    v2   agg_state<group_concat(string)> generic
)
AGGREGATE KEY(k1)
DISTRIBUTED BY HASH(k1) BUCKETS 3;
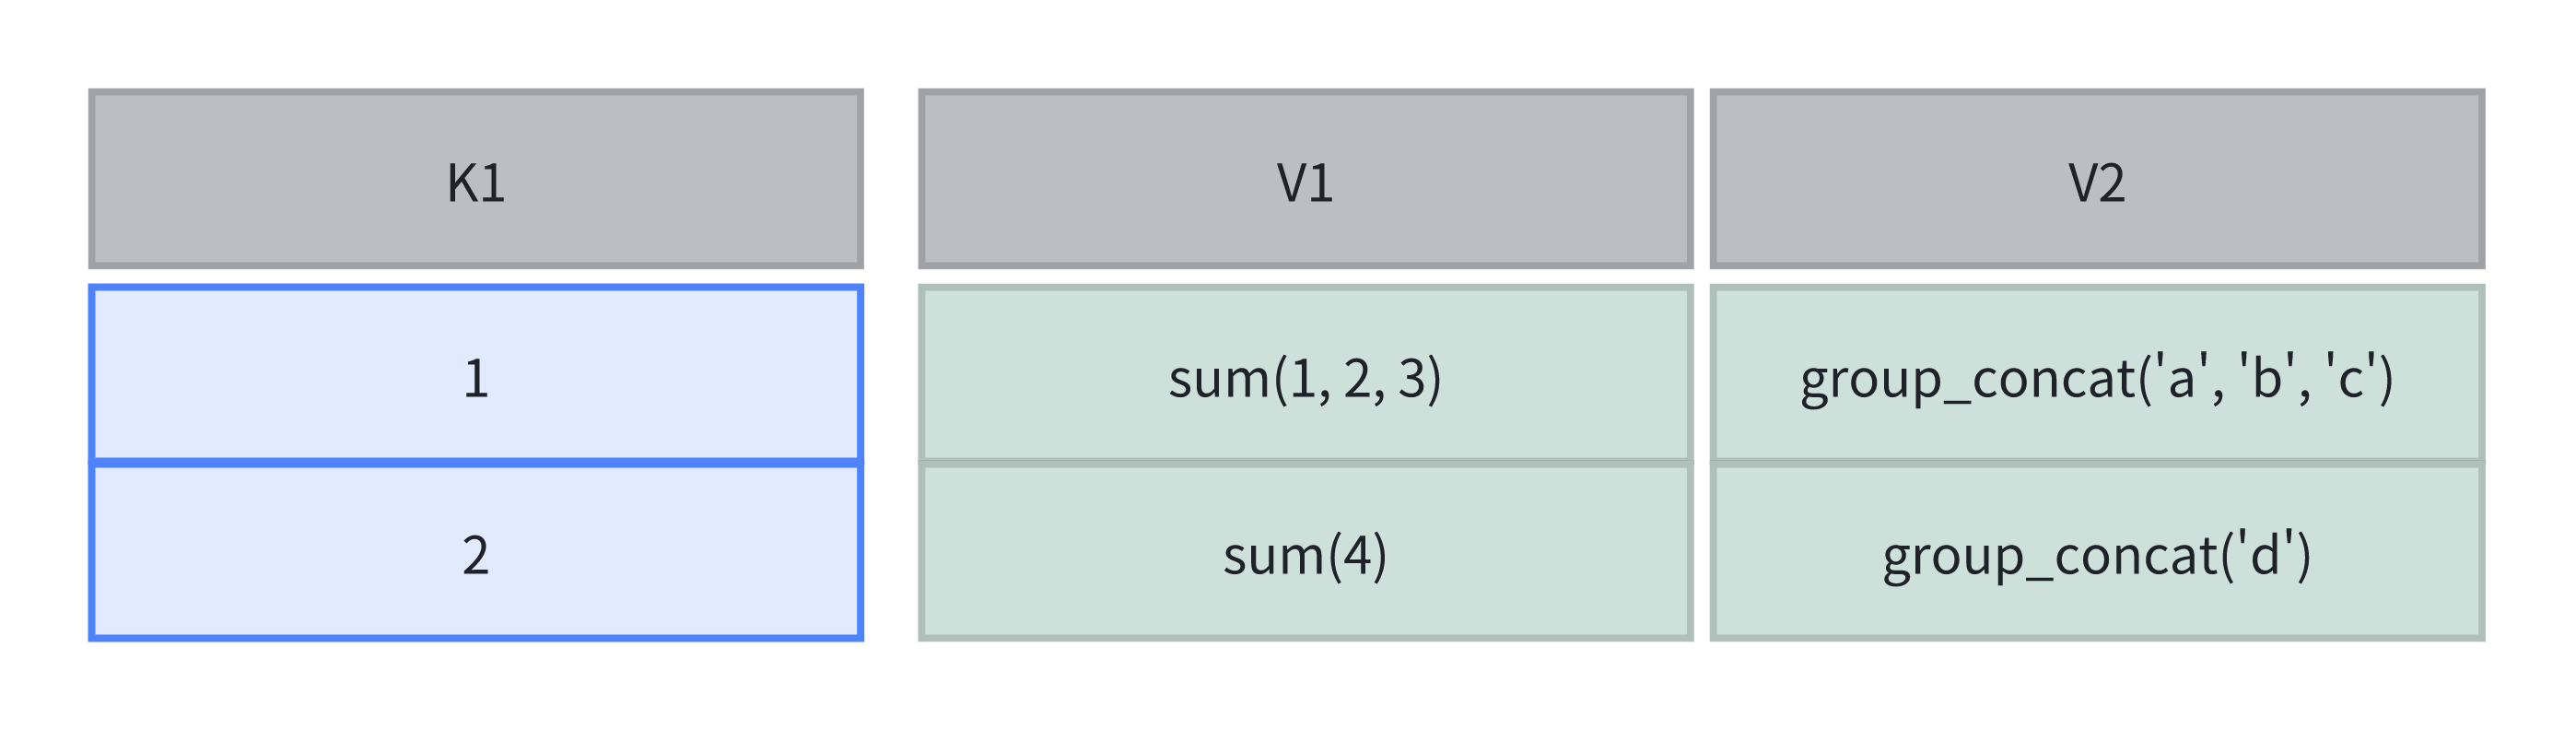
In this case, agg_state is used to declare the data type as agg_state, and sum/group_concat is the signature of the aggregation function. Note that agg_state is a data type, just like int, array, or string. agg_state can only be used with combinators such as state, merge, or union. agg_state represents the intermediate result of an aggregation function. For example, for the aggregation function group_concat, agg_state can represent the intermediate state of group_concat('a', 'b', 'c'), rather than the final result.
The agg_state type needs to be generated using the state function. For this table, you need to use group_concat_state:
insert into aggstate values(1, 1, group_concat_state('a'));
insert into aggstate values(1, 2, group_concat_state('b'));
insert into aggstate values(1, 3, group_concat_state('c'));
insert into aggstate values(2, 4, group_concat_state('d'));
The calculation method in the table is shown in the diagram below:
When querying the table, the merge operation can be used to merge multiple state values and return the final aggregation result. Since group_concat requires ordering, the result may be unstable.
select group_concat_merge(v2) from aggstate;
+------------------------+
| group_concat_merge(v2) |
+------------------------+
| d,c,b,a                |
+------------------------+
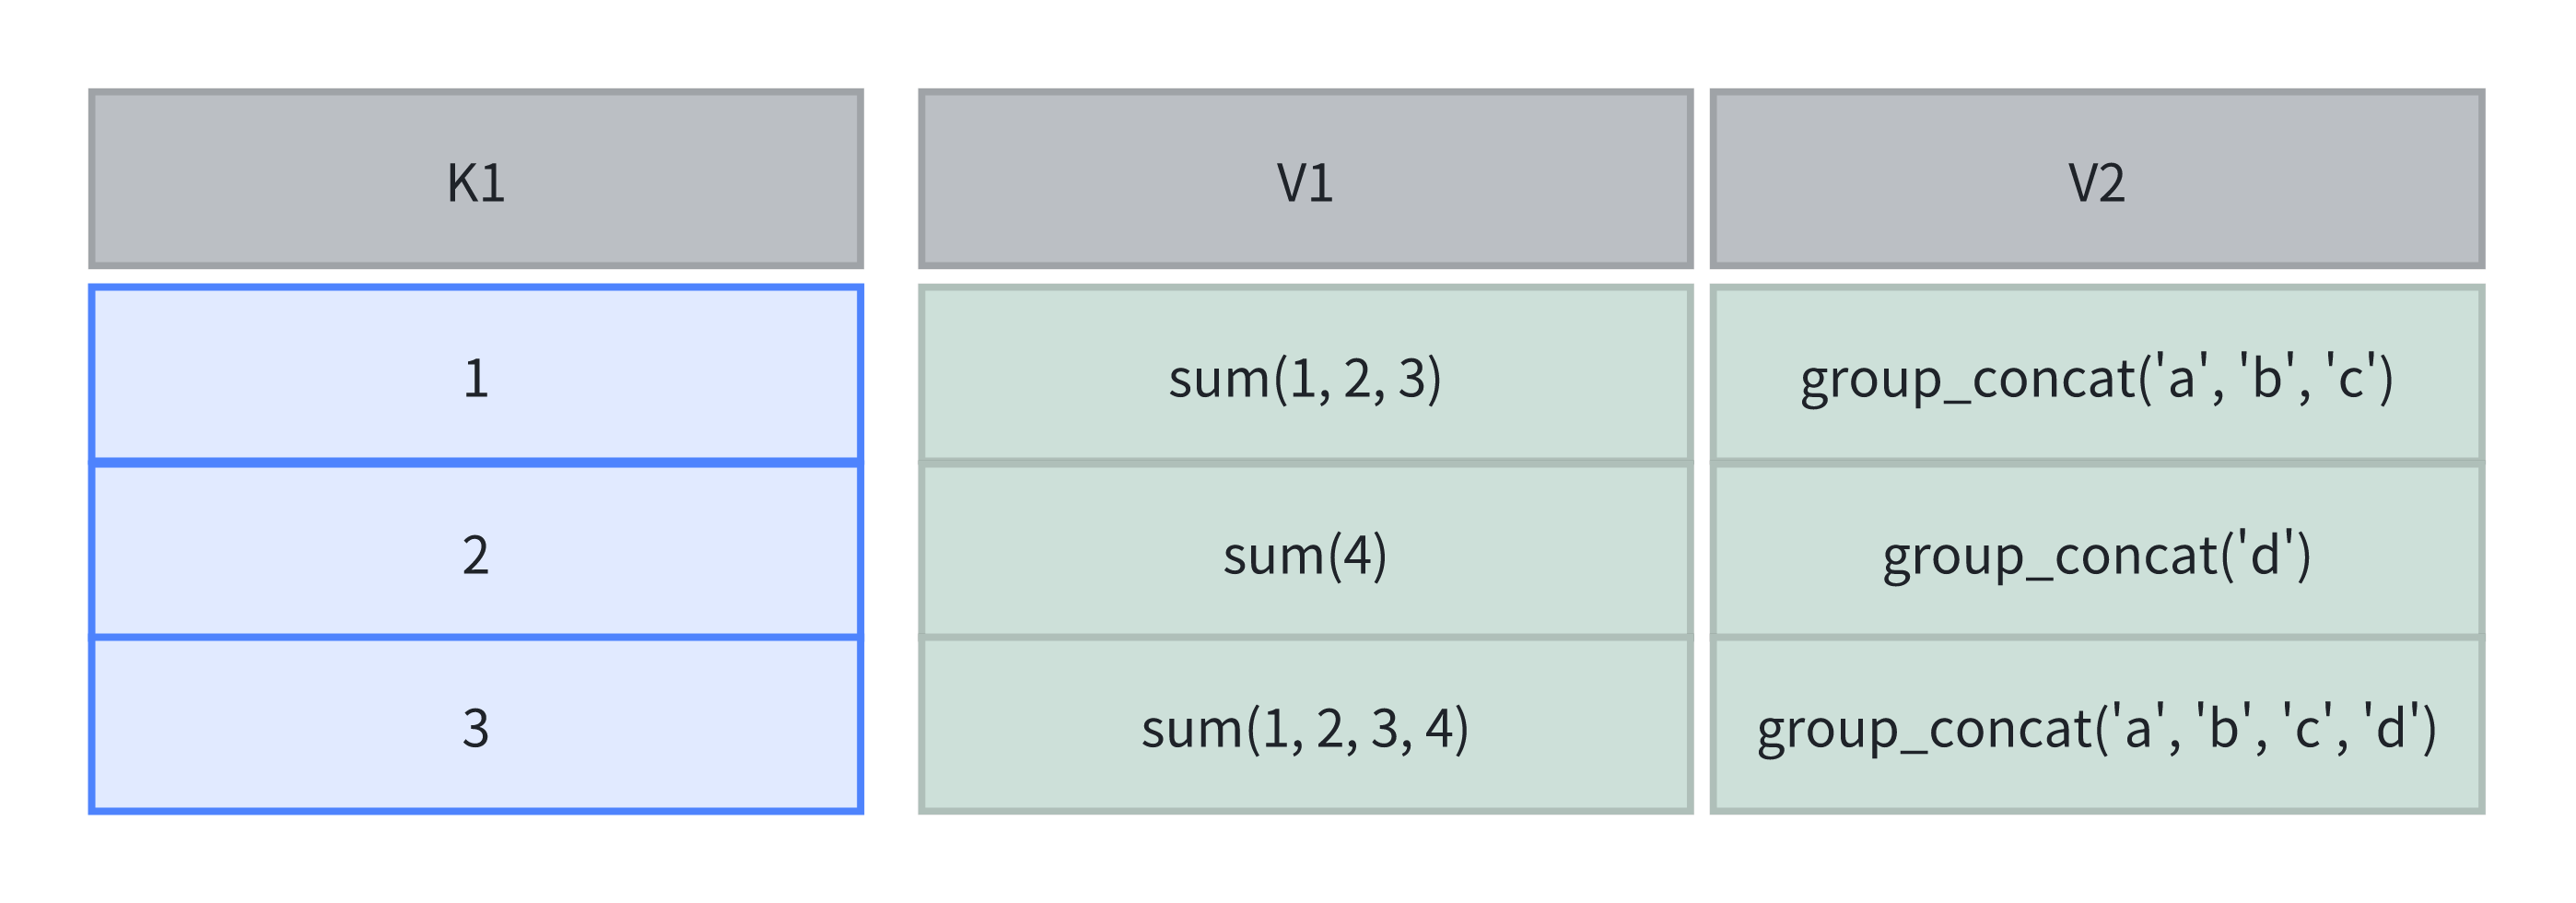
If you do not want the final aggregation result, you can use union to combine multiple intermediate aggregation results and generate a new intermediate result.
insert into aggstate select 3,sum_union(k2),group_concat_union(k3) from aggstate;
The calculations in the table are as follows:
The query result is as follows:
mysql> select sum_merge(k2) , group_concat_merge(k3)from aggstate;
+---------------+------------------------+
| sum_merge(k2) | group_concat_merge(k3) |
+---------------+------------------------+
|            20 | c,b,a,d,c,b,a,d        |
+---------------+------------------------+

mysql> select sum_merge(k2) , group_concat_merge(k3)from aggstate where k1 != 2;
+---------------+------------------------+
| sum_merge(k2) | group_concat_merge(k3) |
+---------------+------------------------+
|            16 | c,b,a,d,c,b,a          |
+---------------+------------------------+