スローSQLの診断ツール:監査ログと監査テーブル
パフォーマンス診断ツールは、問題のある業務SQLをすばやく特定するために使用します。データベースのSLAを維持するうえで重要です。デフォルトでは、Dorisは実行時間が5秒を超えるSQLをスローSQLとして扱います。このしきい値はconfig.qe_slow_log_msで設定できます。
作業前の確認事項:
- スローSQLのしきい値を把握しているか(デフォルトは5000 ms)。
- FEノード上の
fe/log/fe.audit.logファイルにアクセスできるか。 - Doris 2.1以降を使用しているか(システムテーブルを使用する場合に必要)。
- Doris Managerが導入されているか(任意。UIでの絞り込みに使用)。
三つの診断手段の比較:
| ツール | 適した場面 | アクセス方法 | Doris Managerが必要か | 対応バージョン |
|---|---|---|---|---|
| Doris Managerのログ | UIでスローSQLを絞り込む | Doris Managerのコンソール | はい | すべてのバージョン |
監査ログ(fe.audit.log) | 生ログの直接確認、テキストによる絞り込み | FEノード上のファイル | いいえ | すべてのバージョン |
audit_logシステムテーブル | SQLによる統計と集計分析 | MySQLクライアントからクエリを実行 | いいえ | 2.1以降 |
Doris Managerのログ
Doris Managerのログモジュールには、スローSQLを絞り込む機能があります。
手順:
- 目的:過去のスローSQLを確認します。
- 操作:ログページで、対象のFEノードの
fe.audit.logを選択します。 - 確認:検索ボックスに
slow_queryを入力すると、ページにスローSQLの一覧が表示されます。
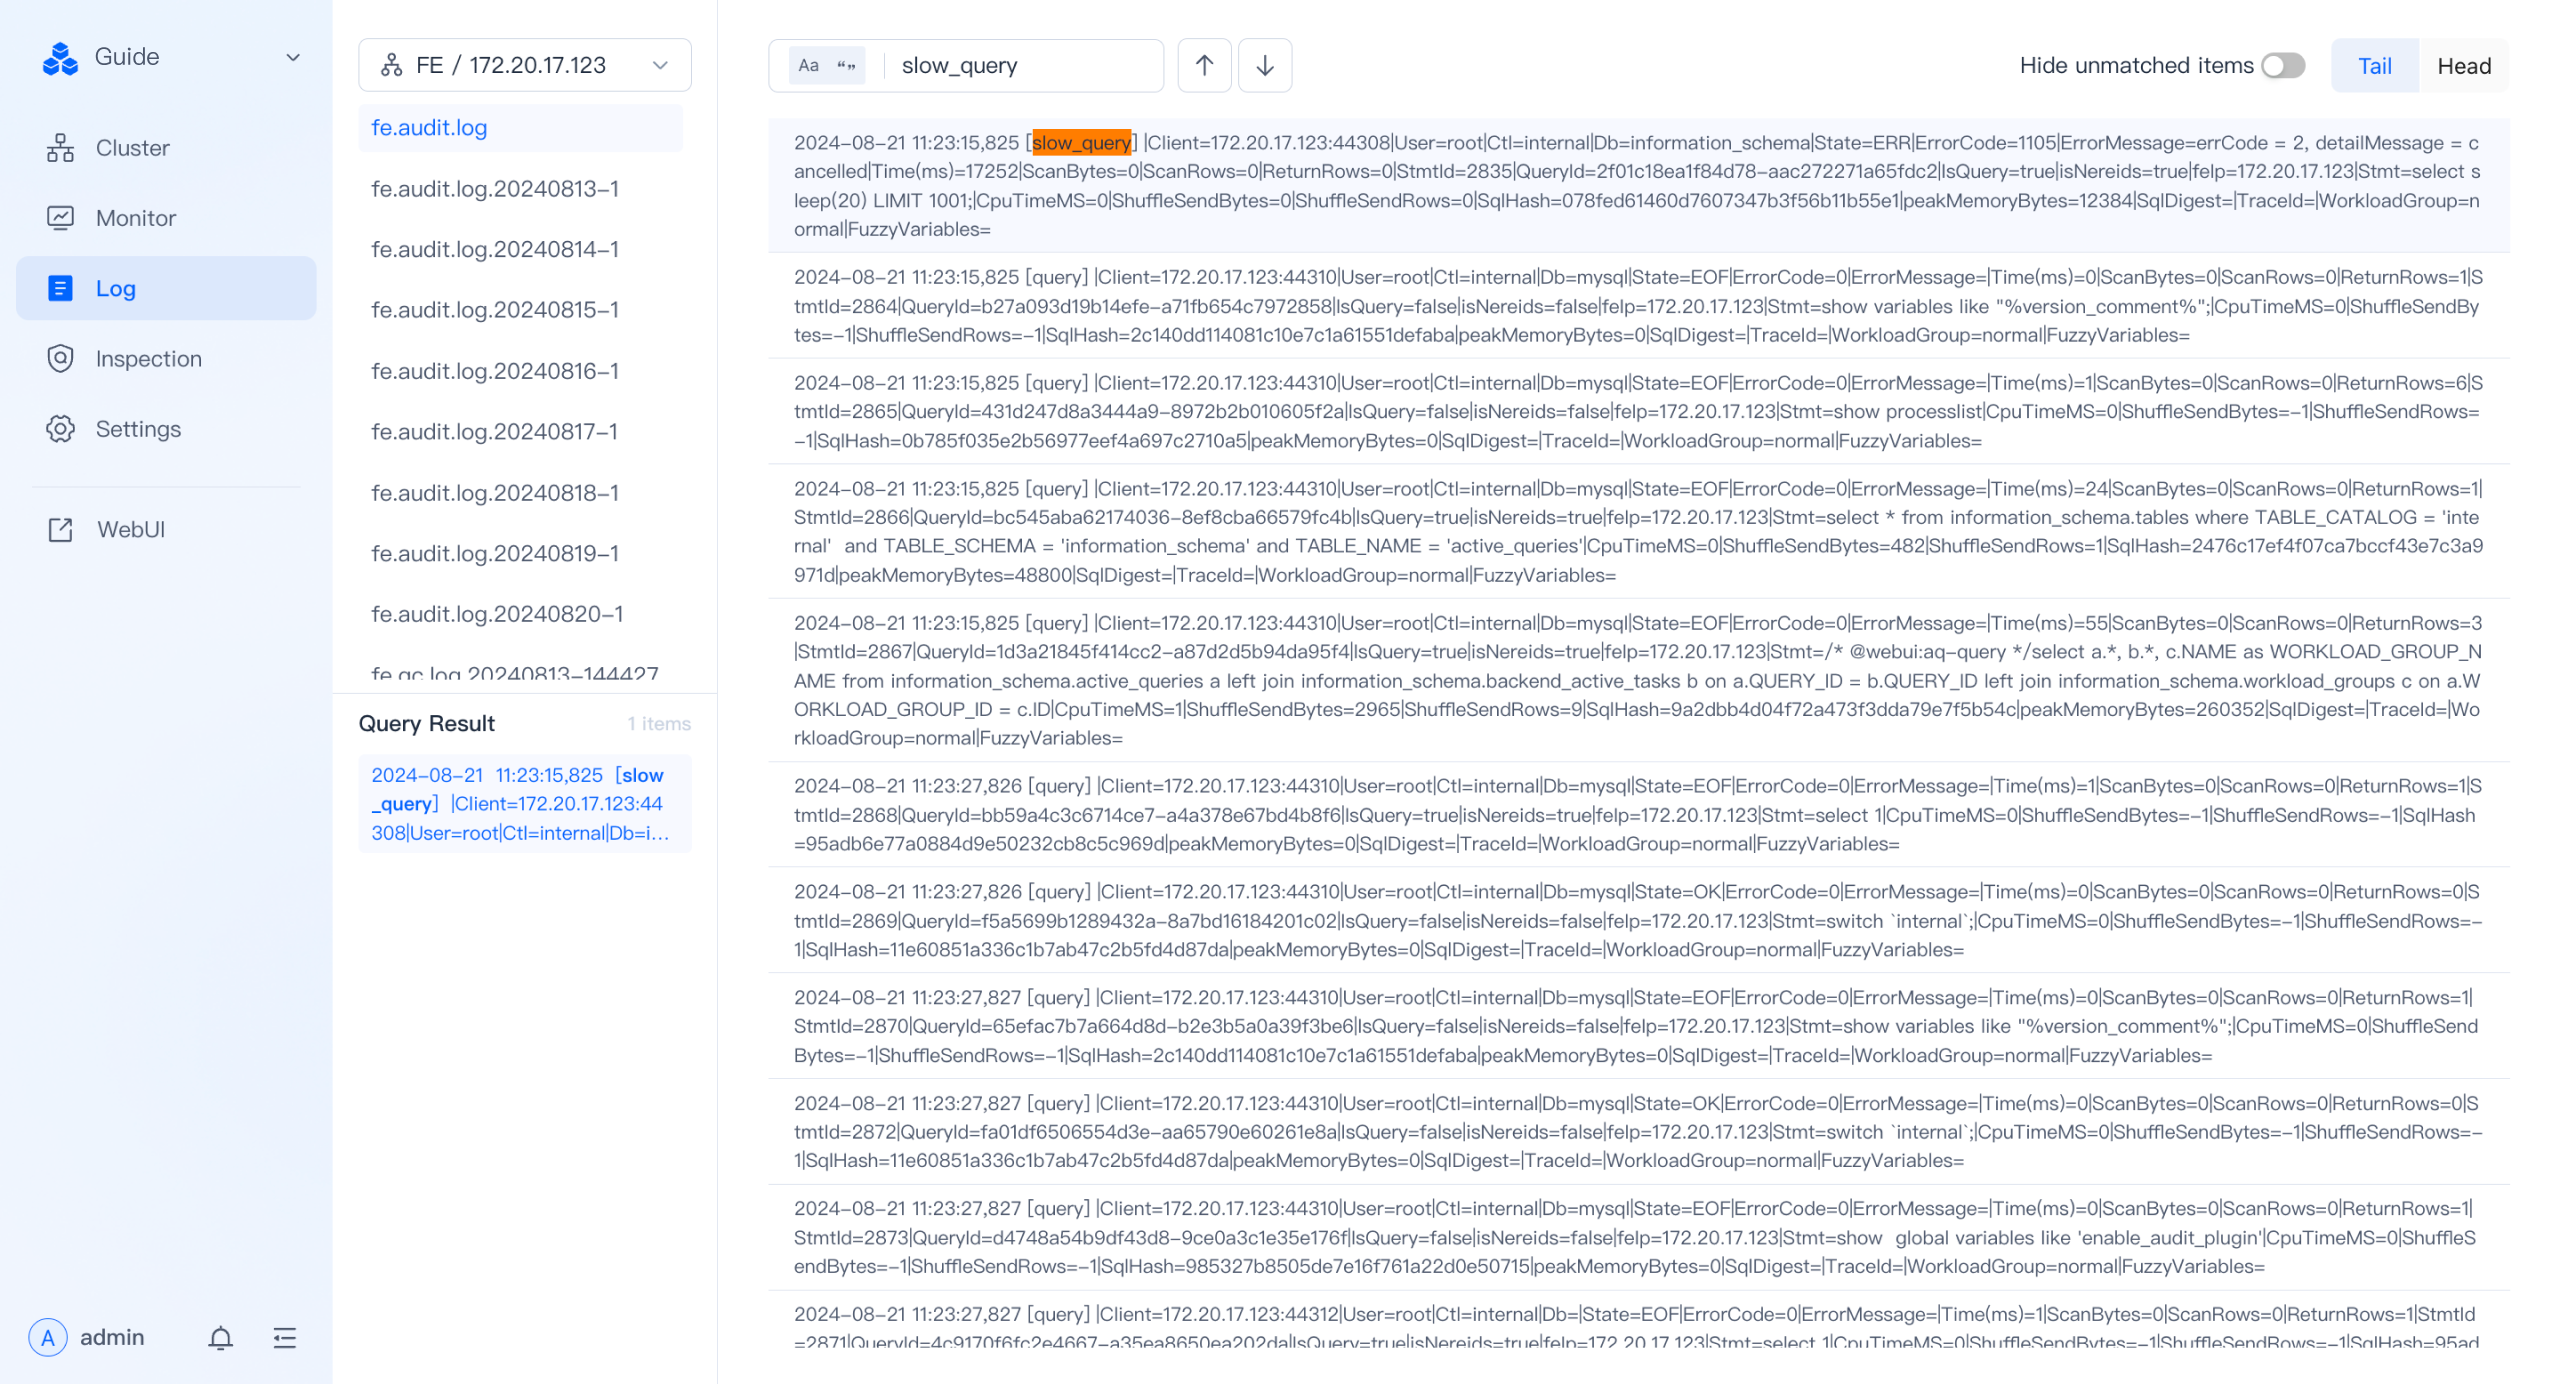
監査ログ
監査ログはDoris FEが出力するログです。Doris Managerのログページで確認するほか、FEノード上のfe/log/fe.audit.logファイルに直接アクセスすることもできます。
監査ログの種類:
| 種類 | 説明 |
|---|---|
slow_query | 実行時間がしきい値を超えたスロークエリ |
query | 通常のクエリ |
load | ロードタスク |
stream_load | Stream Loadによるインポート |
fe.audit.logからスロークエリを直接絞り込む
slow_queryタグを使うと、fe.audit.logからスロークエリをすばやく絞り込めます。ログの例を次に示します。
2024-07-18 11:23:13,042 [slow_query] |Client=127.0.0.1:63510|User=root|Ctl=internal|Db=tpch_sf1000|State=EOF|ErrorCode=0|ErrorMessage=|Time(ms)=11603|ScanBytes=236667379712|ScanRows=13649979418|ReturnRows=100|StmtId=1689|QueryId=91ff336304f14182-9ca537eee75b3856|IsQuery=true|isNereids=true|feIp=172.21.0.10|Stmt=select     c_name,     c_custkey,     o_orderkey,     o_orderdate,     o_totalprice,     sum(l_quantity) from     customer,     orders,     lineitem where     o_orderkey  in  (         select             l_orderkey         from             lineitem         group  by             l_orderkey  having                 sum(l_quantity)  >  300     )     and  c_custkey  =  o_custkey     and  o_orderkey  =  l_orderkey group  by     c_name,     c_custkey,     o_orderkey,     o_orderdate,     o_totalprice order  by     o_totalprice  desc,     o_orderdate limit  100|CpuTimeMS=918556|ShuffleSendBytes=3267419|ShuffleSendRows=89668|SqlHash=b4e1de9f251214a30188180f37907f7d|peakMemoryBytes=38720935552|SqlDigest=f23c7a7ecff61da33f537b2699e9b053|cloudClusterName=UNKNOWN|TraceId=|WorkloadGroup=normal|FuzzyVariables=|scanBytesFromLocalStorage=0|scanBytesFromRemoteStorage=0
2024-07-18 11:23:33,043 [slow_query] |Client=127.0.0.1:26672|User=root|Ctl=internal|Db=tpch_sf1000|State=EOF|ErrorCode=0|ErrorMessage=|Time(ms)=8978|ScanBytes=334985555968|ScanRows=10717654374|ReturnRows=100|StmtId=1815|QueryId=6e1fae453cb04d9a-b1e5f94d9cea1885|IsQuery=true|isNereids=true|feIp=172.21.0.10|Stmt=select     s_name,     count(*) as numwait from     supplier,     lineitem l1,     orders,     nation where     s_suppkey = l1.l_suppkey     and o_orderkey = l1.l_orderkey     and o_orderstatus = 'F'     and l1.l_receiptdate > l1.l_commitdate     and exists (         select             *         from             lineitem l2         where                 l2.l_orderkey = l1.l_orderkey           and l2.l_suppkey <> l1.l_suppkey     )     and not exists (         select             *         from             lineitem l3         where                 l3.l_orderkey = l1.l_orderkey           and l3.l_suppkey <> l1.l_suppkey           and l3.l_receiptdate > l3.l_commitdate     )     and s_nationkey = n_nationkey     and n_name = 'SAUDI ARABIA' group by     s_name order by     numwait desc,     s_name limit 100|CpuTimeMS=990127|ShuffleSendBytes=59208164|ShuffleSendRows=3651504|SqlHash=f8a30e4182d72cce3eff6cb385005b1f|peakMemoryBytes=10495660672|SqlDigest=fec5a7136f9375aa968a4de971b994da|cloudClusterName=UNKNOWN|TraceId=|WorkloadGroup=normal|FuzzyVariables=|scanBytesFromLocalStorage=0|scanBytesFromRemoteStorage=0
2024-07-18 11:23:41,044 [slow_query] |Client=127.0.0.1:26684|User=root|Ctl=internal|Db=tpch_sf1000|State=EOF|ErrorCode=0|ErrorMessage=|Time(ms)=8514|ScanBytes=334986551296|ScanRows=10717654374|ReturnRows=100|StmtId=1833|QueryId=4f91483464ce4aa8-beeed7dcb8675bc8|IsQuery=true|isNereids=true|feIp=172.21.0.10|Stmt=select     s_name,     count(*) as numwait from     supplier,     lineitem l1,     orders,     nation where     s_suppkey = l1.l_suppkey     and o_orderkey = l1.l_orderkey     and o_orderstatus = 'F'     and l1.l_receiptdate > l1.l_commitdate     and exists (         select             *         from             lineitem l2         where                 l2.l_orderkey = l1.l_orderkey           and l2.l_suppkey <> l1.l_suppkey     )     and not exists (         select             *         from             lineitem l3         where                 l3.l_orderkey = l1.l_orderkey           and l3.l_suppkey <> l1.l_suppkey           and l3.l_receiptdate > l3.l_commitdate     )     and s_nationkey = n_nationkey     and n_name = 'SAUDI ARABIA' group by     s_name order by     numwait desc,     s_name limit 100|CpuTimeMS=925841|ShuffleSendBytes=59223190|ShuffleSendRows=3651602|SqlHash=f8a30e4182d72cce3eff6cb385005b1f|peakMemoryBytes=10505123104|SqlDigest=fec5a7136f9375aa968a4de971b994da|cloudClusterName=UNKNOWN|TraceId=|WorkloadGroup=normal|FuzzyVariables=|scanBytesFromLocalStorage=0|scanBytesFromRemoteStorage=0
2024-07-18 11:23:49,044 [slow_query] |Client=127.0.0.1:10748|User=root|Ctl=internal|Db=tpch_sf1000|State=EOF|ErrorCode=0|ErrorMessage=|Time(ms)=8660|ScanBytes=334987673600|ScanRows=10717654374|ReturnRows=100|StmtId=1851|QueryId=4599cb1bab204f80-ac430dd78b45e3da|IsQuery=true|isNereids=true|feIp=172.21.0.10|Stmt=select     s_name,     count(*) as numwait from     supplier,     lineitem l1,     orders,     nation where     s_suppkey = l1.l_suppkey     and o_orderkey = l1.l_orderkey     and o_orderstatus = 'F'     and l1.l_receiptdate > l1.l_commitdate     and exists (         select             *         from             lineitem l2         where                 l2.l_orderkey = l1.l_orderkey           and l2.l_suppkey <> l1.l_suppkey     )     and not exists (         select             *         from             lineitem l3         where                 l3.l_orderkey = l1.l_orderkey           and l3.l_suppkey <> l1.l_suppkey           and l3.l_receiptdate > l3.l_commitdate     )     and s_nationkey = n_nationkey     and n_name = 'SAUDI ARABIA' group by     s_name order by     numwait desc,     s_name limit 100|CpuTimeMS=932664|ShuffleSendBytes=59223178|ShuffleSendRows=3651991|SqlHash=f8a30e4182d72cce3eff6cb385005b1f|peakMemoryBytes=10505123104|SqlDigest=fec5a7136f9375aa968a4de971b994da|cloudClusterName=UNKNOWN|TraceId=|WorkloadGroup=normal|FuzzyVariables=|scanBytesFromLocalStorage=0|scanBytesFromRemoteStorage=0
fe.audit.logには、実行時間、スキャンした行数、返却した行数、SQL文など、スローSQLに関する主要な情報が記録されます。これらは後でクエリを再現し、最適化する際の手がかりになります。
主要フィールドの説明
| フィールド | 意味 |
|---|---|
Time(ms) | クエリの実行時間(ミリ秒) |
ScanBytes / ScanRows | スキャンしたデータ量と行数 |
ReturnRows | クライアントに返した行数 |
QueryId | クエリ固有のID。Profileとの関連付けに使用 |
Stmt | SQL文の全文 |
SqlDigest | SQLの構造を表すハッシュ。同じパターンのSQLの集計に使用 |
CpuTimeMS | CPU時間の合計(ミリ秒) |
peakMemoryBytes | 最大メモリ使用量 |
WorkloadGroup | 所属するWorkload Group |
SqlDigestを使ったパターン別の集計
SqlDigestは、具体的なパラメータを除いたSQLの構造から生成されるハッシュ値です。構造が同じSQL文は同じSqlDigestを共有するため、スローSQLをパターンごとに集計・分析できます。
SqlDigestを基に、発生頻度が最も高いSQLパターンや、実行時間の合計が最も長いパターンを特定し、優先して最適化できます。文を一件ずつ分析する手間を省き、最適化を効率よく進められます。
注意:SqlDigestはハッシュ値なので、そのまま読んで内容を理解することはできません。最適化するパターンを決めたら、Stmtフィールドで実際のSQLを取得し、QueryIdを使ってProfileと関連付け、詳しく分析します(Profileについては後の章で説明します)。
スロークエリの分析例
上記の四件のスロークエリログを例に説明します。
- 最初のレコードの
SqlDigest(Time(ms)=11603)はf23c7a7ecff61da33f537b2699e9b053です。 - 続く三件のレコードの
SqlDigest(Time(ms)=8978/8514/8660)はfec5a7136f9375aa968a4de971b994daです。
後の三件は実行の詳細が異なりますが、構造が同じSQLパターンに属します。
実際の最適化では、特定のSqlDigest(例:fec5a7136f9375aa968a4de971b994da)が繰り返し現れる場合や、実行時間の累計で大きな割合を占める場合に、そのパターンを優先して調べます。
最適化の手順:
-
業務ロジックを特定する:このパターンに属するログのいずれかの
Stmtフィールドを使い、業務SQLを特定します。select s_name, count(*) as numwait from supplier, lineitem l1, orders, nation where ... -
詳しく分析する:
QueryId(例:6e1fae453cb04d9a-b1e5f94d9cea1885)を使って、対応するQuery Profileを探します。Profileでボトルネック(スキャンデータ量が多い、Joinに時間がかかるなど)を特定し、最適化方針(インデックスの追加、SQLの書き換え、テーブル構造の調整など)を検討します。
このパターンの問題を解消すると、同じパターンのスロークエリすべてに改善効果が及びます。
audit_logシステムテーブル
Doris 2.1以降では、audit_logシステムテーブルが__internal_schemaデータベースに用意されており、SQLで監査情報を照会できます。
有効化の手順
| 手順 | コマンド | 説明 |
|---|---|---|
| 1. プラグインを有効にする | set global enable_audit_plugin=true; | 監査プラグインをグローバルに有効化します。デフォルトでは無効です |
| 2. データベースを切り替える | use __internal_schema; | 内部スキーマに切り替えます |
| 3. テーブルを表示する | show tables; | audit_logテーブルが存在することを確認します |
確認例
mysql> use __internal_schema;
Reading table information for completion of table and column names
You can turn off this feature to get a quicker startup with -A

Database changed
mysql> show tables;
+-----------------------------+
| Tables_in___internal_schema |
+-----------------------------+
| audit_log                   |
| column_statistics           |
| histogram_statistics        |
| partition_statistics        |
+-----------------------------+
4 rows in set (0.00 sec)

mysql> desc audit_log;
+-------------------+--------------+------+-------+---------+-------+
| Field             | Type         | Null | Key   | Default | Extra |
+-------------------+--------------+------+-------+---------+-------+
| query_id          | varchar(48)  | Yes  | true  | NULL    |       |
| time              | datetime     | Yes  | true  | NULL    |       |
| client_ip         | varchar(128) | Yes  | true  | NULL    |       |
| user              | varchar(128) | Yes  | false | NULL    | NONE  |
| catalog           | varchar(128) | Yes  | false | NULL    | NONE  |
| db                | varchar(128) | Yes  | false | NULL    | NONE  |
| state             | varchar(128) | Yes  | false | NULL    | NONE  |
| error_code        | int          | Yes  | false | NULL    | NONE  |
| error_message     | text         | Yes  | false | NULL    | NONE  |
| query_time        | bigint       | Yes  | false | NULL    | NONE  |
| scan_bytes        | bigint       | Yes  | false | NULL    | NONE  |
| scan_rows         | bigint       | Yes  | false | NULL    | NONE  |
| return_rows       | bigint       | Yes  | false | NULL    | NONE  |
| stmt_id           | bigint       | Yes  | false | NULL    | NONE  |
| is_query          | tinyint      | Yes  | false | NULL    | NONE  |
| frontend_ip       | varchar(128) | Yes  | false | NULL    | NONE  |
| cpu_time_ms       | bigint       | Yes  | false | NULL    | NONE  |
| sql_hash          | varchar(128) | Yes  | false | NULL    | NONE  |
| sql_digest        | varchar(128) | Yes  | false | NULL    | NONE  |
| peak_memory_bytes | bigint       | Yes  | false | NULL    | NONE  |
| stmt              | text         | Yes  | false | NULL    | NONE  |
+-------------------+--------------+------+-------+---------+-------+
内部テーブルaudit_logを使用すると、詳細な実行情報をSQLで照会し、スロークエリの絞り込みや統計分析を行えます。
よくある質問
Q1:slow_queryのレコードがfe.audit.logに見つからないのはなぜですか?
- 原因:SQLの実行時間がしきい値(デフォルトは5000 ms)に達していません。
- 対処:
config.qe_slow_log_msでしきい値を調整します。
Q2:audit_logテーブルを照会してもデータが返らないのはなぜですか?
- 原因:
enable_audit_pluginはデフォルトで無効です。 - 対処:
set global enable_audit_plugin=true;を実行します。
Q3:SQL文のリテラル値が異なるのに、SqlDigestが同じなのは正常ですか?
- はい。
SqlDigestはパラメータ値を除いた構造を基に生成されるため、パターンが同じでパラメータが異なるSQL文は同じハッシュを共有します。
Q4:audit_logテーブルはどこにありますか?
__internal_schemaデータベースにあります。Doris 2.1以降が必要です。
Q5:詳しく分析するためにProfileと関連付けるにはどうすればよいですか?
- 監査ログの
QueryIdフィールドを使い、Profileシステムで対応する実行プランを照会します。
まとめ
Dorisには、Doris Managerのログ、fe.audit.log、audit_logシステムテーブルという三つのスローSQL診断手段があります。それぞれ、UIでの絞り込み、テキストの直接確認、SQLによる統計分析に対応します。SqlDigestによるパターン別の集計と、QueryIdを使ったProfileとの関連付けを組み合わせることで、パフォーマンスのボトルネックを体系的に特定して最適化できます。