개요
메모리 관리는 Doris의 가장 중요한 구성 요소 중 하나입니다. Doris가 실행되는 동안 데이터 적재와 쿼리 모두 많은 메모리 연산에 의존합니다. 메모리 관리의 품질은 Doris의 안정성과 성능에 직접적인 영향을 줍니다.
MPP 아키텍처 기반의 OLAP 데이터베이스인 Apache Doris는 디스크에서 메모리로 데이터를 적재한 후 연산자 간에 데이터를 스트리밍하며 계산하고, 중간 계산 결과를 메모리에 저장합니다. 이 방식은 잦은 디스크 I/O 작업을 줄이고 여러 머신과 여러 코어의 병렬 컴퓨팅 능력을 최대한 활용하여 뛰어난 성능을 발휘합니다.
메모리 리소스를 많이 소비하는 복잡한 계산과 대규모 작업에서는 효과적인 메모리 할당, 통계 수집, 제어가 시스템 안정성에 매우 중요한 역할을 합니다. 메모리 할당 속도가 빨라지면 쿼리 성능이 효과적으로 개선됩니다. 또한 메모리 할당, 추적, 제한을 통해 특정 지점에 메모리 사용이 집중되는 현상을 방지하고, 메모리 부족에 신속하고 정확하게 대응하여 OOM과 쿼리 실패를 최대한 피할 수 있습니다. 이러한 일련의 메커니즘은 시스템 안정성을 크게 높입니다. 더 정확한 메모리 통계는 대규모 쿼리의 중간 결과를 디스크로 내보내는 기반이 되기도 합니다.
Doris BE 메모리 구조
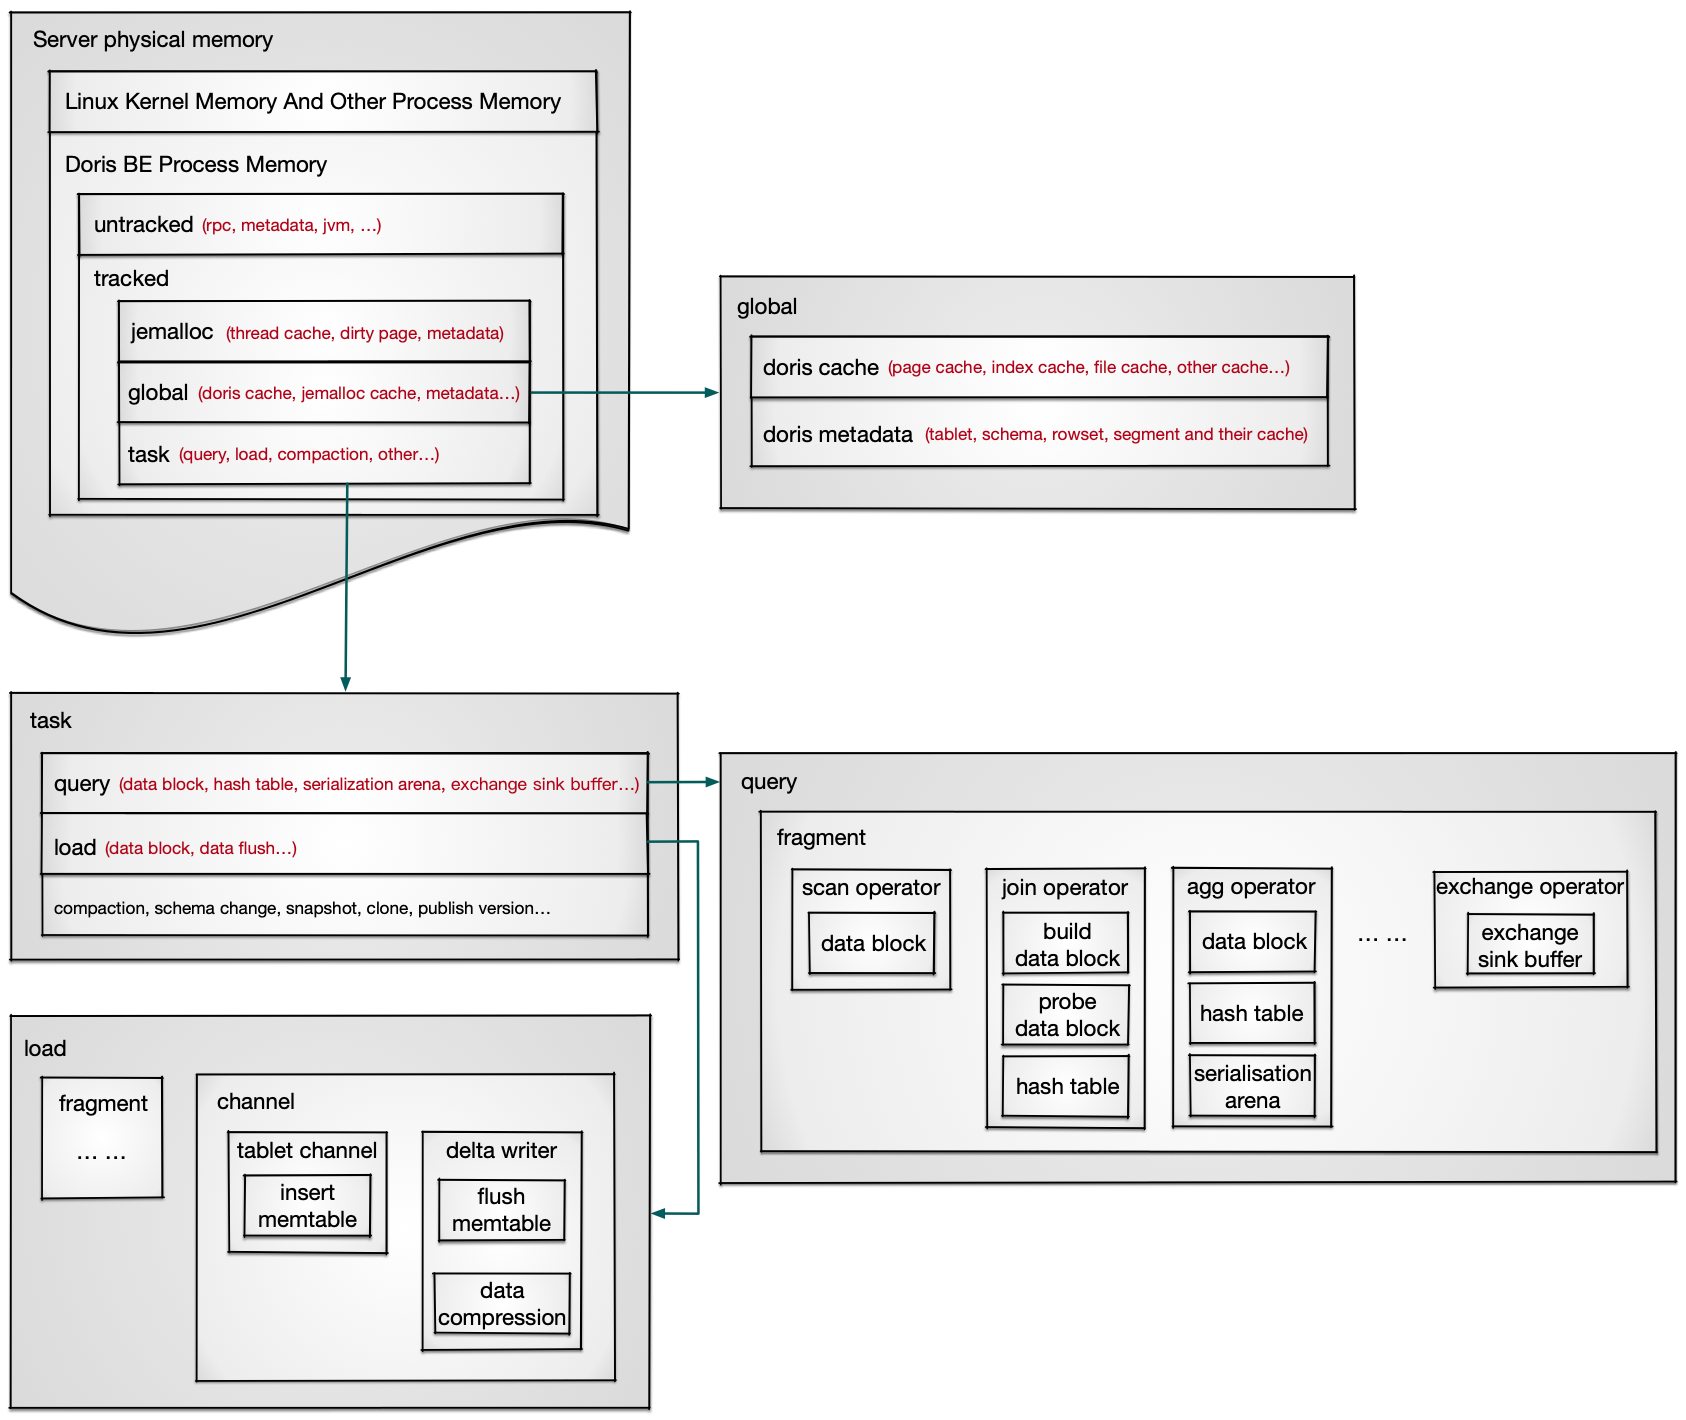
Server physical memory: The physical memory used by all processes on the server, MemTotal seen by `cat /proc/meminfo` or `free -h`.
    |
    |---> Linux Kernel Memory And Other Process Memory: Memory used by the Linux kernel and other processes.
    |
    |---> Doris BE Process Memory: The memory used by the Doris BE process. The upper limit is the server physical memory minus the memory used by the Linux kernel and other processes, or the memory size configured by the Cgroup.
            |
            |---> Untracked: Memory that is not tracked and managed, including RPC, JVM, some metadata, etc. JVM is used when accessing external tables or using Java UDF.
            |
            |---> tracked: Memory that is tracked and managed, allowing real-time viewing, automatic memory recycling, and size control through parameters.
                    |
                    |---> jemalloc: The cache and metadata managed by jemalloc support parameter control and are automatically recycled when memory is insufficient.
                    |
                    |---> global: Doris globally shared memory, mainly including cache and metadata.
                    |       |
                    |       |---> doris cache: Doris manages its own cache, which supports controlling capacity and elimination time through parameters separately, and automatically reclaims when memory is insufficient.
                    |       |
                    |       |---> doris metadata: metadata of data stored on BE, including a series of memory data structures such as data schema and their caches.
                    |
                    |---> Task: The memory used by the tasks executed on Doris, which is expected to be released after the task is completed, including query, load, compaction, etc.
                    |       |
                    |       |---> query: Memory used during the query. A query is split into multiple fragments and executed separately, connected by data shuffle.
                    |       |       |
                    |       |       |---> Fragment: A fragment is split into multiple operators and executed in the form of a pipeline.
                    |       |       |       |
                    |       |       |       |---> operator: includes memory data structures such as data block, hash table, arena, exchange sink buffer, etc.
                    |       |
                    |       |---> load: Memory used during data load. Data load includes two stages: fragment reading and channel writing data.
                    |       |       |
                    |       |       |---> fragment: Same as query fragment execution, stream load usually only has scan operator.
                    |       |       |
                    |       |       |---> channel: The tablet channel writes data to a temporary data structure called memtable, and then the delta writer compresses the data and writes it to the file.
메모리 사용 현황
Doris BE는 Memory Tracker를 사용해 프로세스의 메모리 사용량을 기록합니다. 웹 페이지에서 확인할 수 있으며, 메모리 관련 오류가 보고되면 BE 로그에도 출력하여 메모리 분석과 문제 해결을 지원합니다.
실시간 메모리 통계
실시간 메모리 통계는 Doris BE의 웹 페이지 http://{be_host}:{be_web_server_port}/mem_tracker에서 확인할 수 있습니다. 이 페이지에는 Query/Load/Compaction/Global 등을 포함하여 type=overview인 Memory Tracker가 추적하는 현재 메모리 크기와 최대 메모리 크기가 표시됩니다. be_web_server_port의 기본값은 8040입니다.
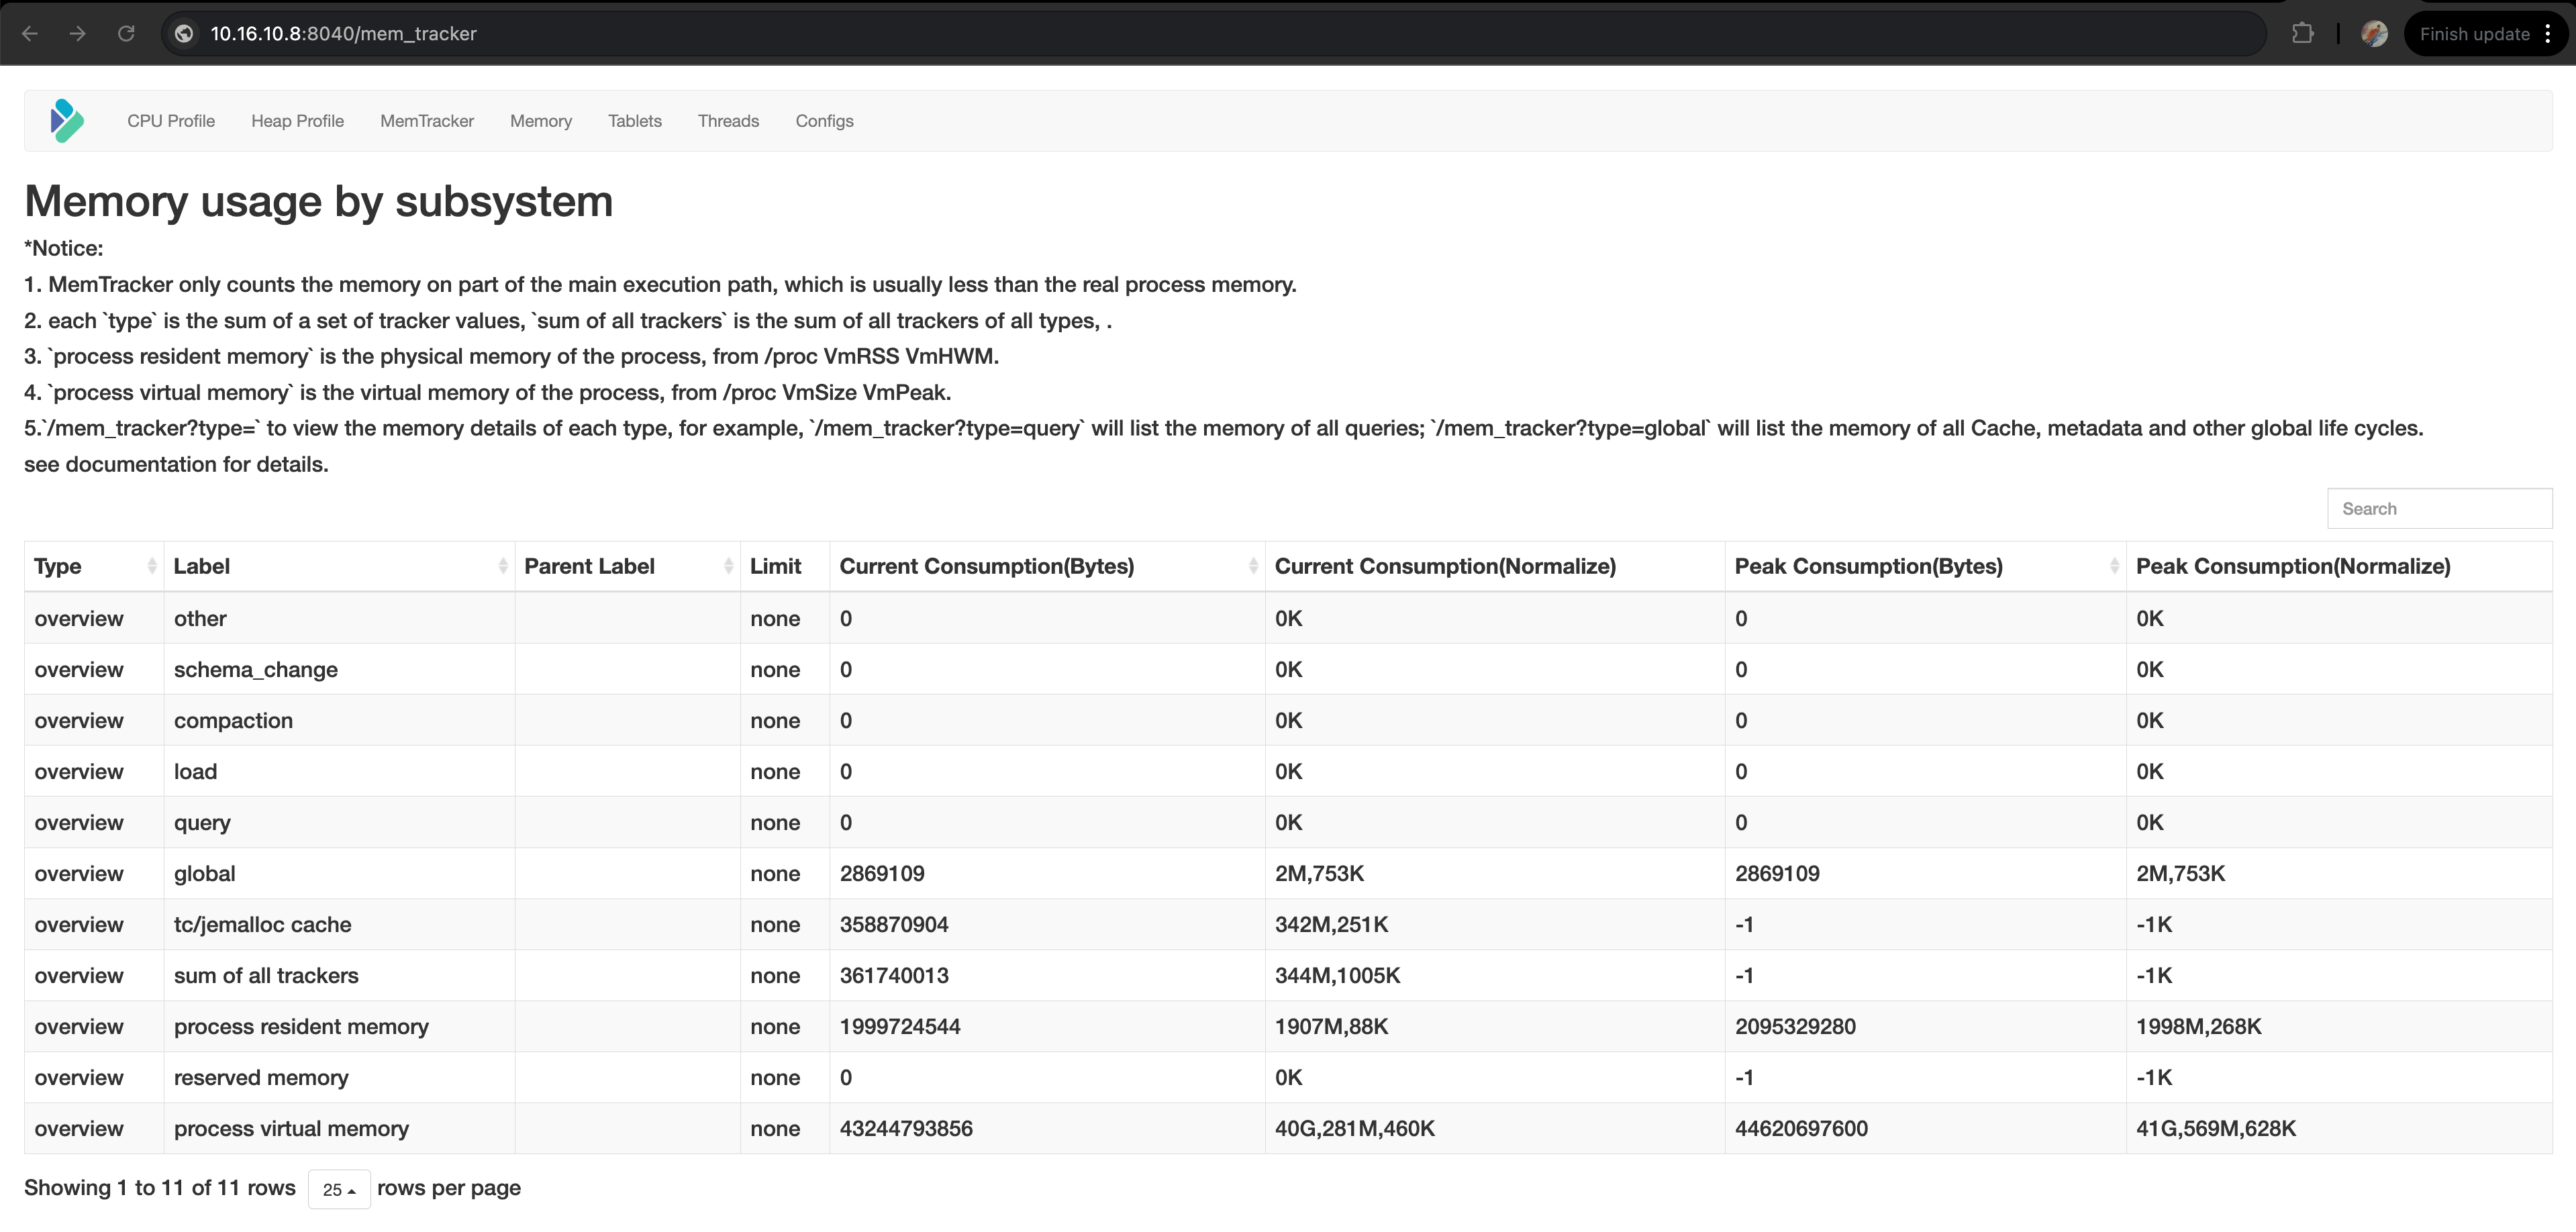
Memory Tracker는 여러 유형으로 나뉩니다. type=overview인 Memory Tracker 중 process resident memory, process virtual memory, sum of all trackers를 제외한 나머지 type=overview Memory Tracker의 세부 정보는 http://{be_host}:{be_web_server_port}/mem_tracker?type=Lable에서 확인할 수 있습니다.
Memory Tracker에는 다음 속성이 있습니다:
- 레이블: Memory Tracker의 이름입니다.
- 현재 사용량(바이트): 현재 메모리 사용량이며, 단위는 B입니다.
- 현재 사용량(정규화): 현재 메모리 사용량을 .G.M.K 형식으로 표시합니다.
- 최대 사용량(바이트): BE 프로세스가 시작된 이후의 최대 메모리 사용량이며, 단위는 B입니다. BE가 다시 시작되면 초기화됩니다.
- 최대 사용량(정규화): BE 프로세스가 시작된 이후의 최대 메모리 사용량을 .G.M.K 형식으로 표시합니다. BE가 다시 시작되면 초기화됩니다.
- 상위 레이블: 두 Memory Tracker 간의 부모-자식 관계를 나타냅니다. 하위 Tracker가 기록하는 메모리는 상위 Tracker가 기록하는 메모리의 부분집합입니다. 같은 상위 Tracker에 속한 서로 다른 Tracker가 기록하는 메모리는 서로 겹칠 수 있습니다.
Memory Tracker에 대한 자세한 내용은 Memory Tracker를 참조하세요.
과거 메모리 통계
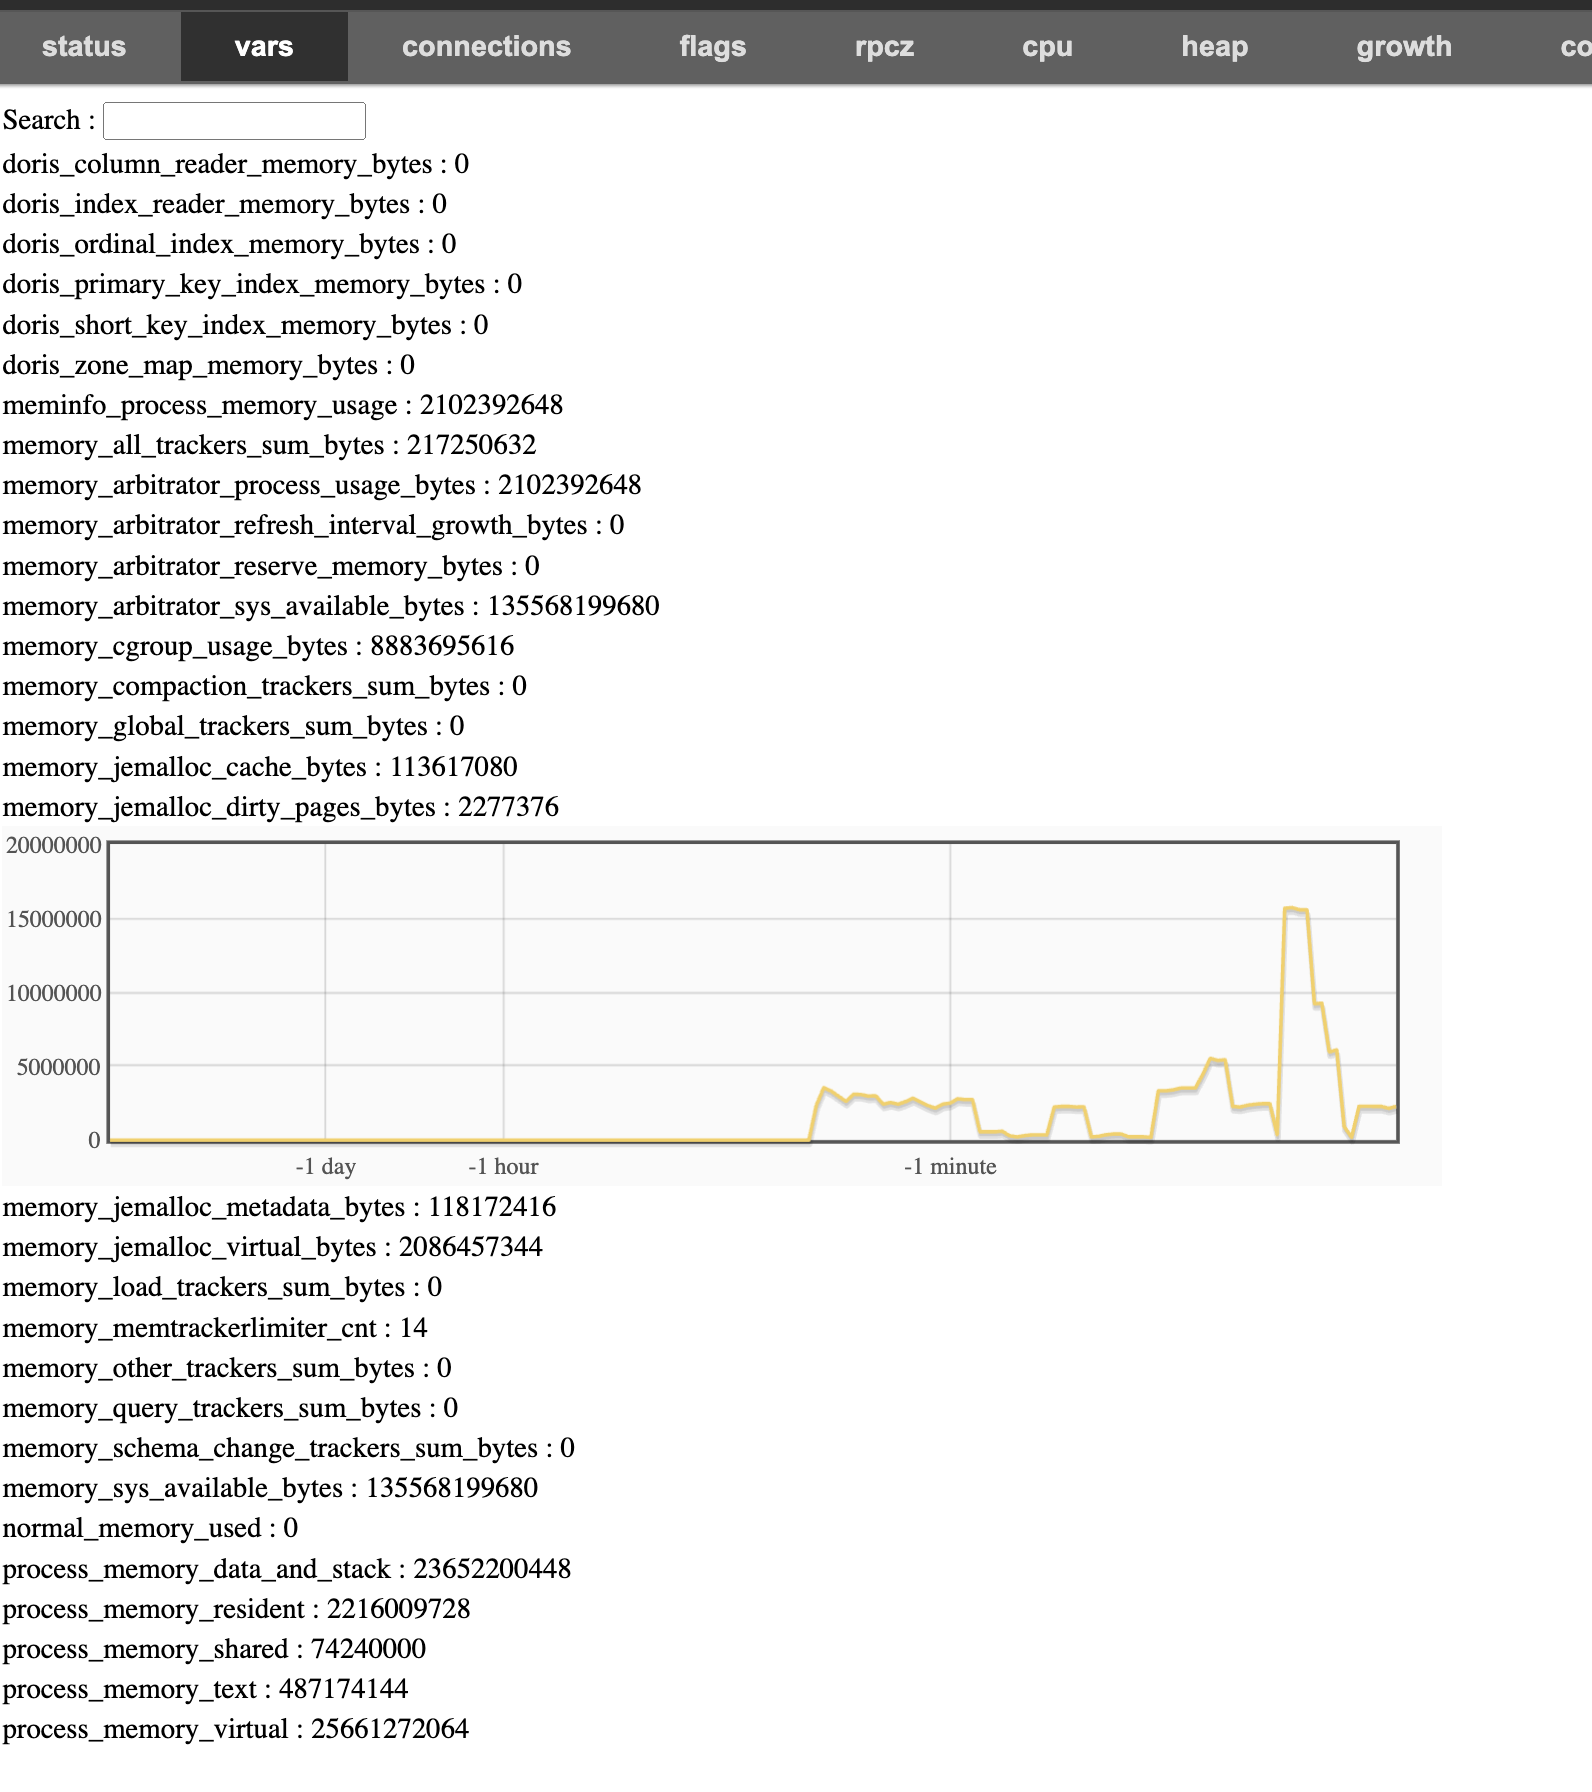
과거 메모리 통계는 Doris BE의 Bvar 페이지 http://{be_host}:{brpc_port}/vars/*memory_*에서 확인할 수 있습니다. 실시간 메모리 통계 페이지 http://{be_host}:{be_web_server_port}/mem_tracker의 Memory Tracker 레이블로 Bvar 페이지를 검색하면 해당 Memory Tracker가 추적하는 메모리 크기의 변화 추이를 확인할 수 있습니다. brpc_port의 기본값은 8060입니다.
프로세스 메모리가 제한을 초과하거나 가용 메모리가 부족하다는 오류가 발생하면 Memory Tracker Summary를 be/log/be.INFO 로그에서 확인할 수 있습니다. 여기에는 Type=overview 및 Type=global인 모든 Memory Tracker가 포함되어 있어 당시의 메모리 상태를 분석하는 데 도움이 됩니다. 자세한 내용은 메모리 로그 분석을 참조하세요.
메모리 분석
type=overview인 Memory Tracker와 위 메모리 구조의 tracked 아래 각 메모리 영역은 다음과 같이 대응합니다:
Doris BE Process Memory
    |
    |---> tracked: corresponds to `MemTrackerLimiter Label=sum of all trackers, Type=overview`, which is all the memory counted by the Memory Tracker, that is, the sum of the Current Consumption of other Memory Trackers with `type=overview` except `Label=process resident memory` and `Label=process virtual memory`.
            |
            |---> jemalloc
            |       |
            |       |---> jemalloc cache: corresponds to `MemTrackerLimiter Label=tc/jemalloc_cache, Type=overview`. The Jemalloc cache includes two parts: Dirty Page and Thread Cache.
            |       |
            |       |---> jemalloc metadata: Corresponding to `MemTrackerLimiter Label=tc/jemalloc_metadata, Type=overview`, Metadata of Jemalloc.
            |
            |---> global: corresponds to `MemTrackerLimiter Label=global, Type=overview`, including global Memory Trackers with the same life cycle and process such as Cache, metadata, and decompression. The web page `http://{be_host}:{be_web_server_port}/mem_tracker?type=global` displays all Memory Trackers of `type=global`.
            |
            |---> task
            |       |
            |       |---> query: corresponds to `MemTrackerLimiter Label=query, Type=overview`, which is the sum of Current Consumption of all Query Memory Trackers. The web page `http://{be_host}:{be_web_server_port}/mem_tracker?type=query` displays all Memory Trackers of `type=query`.
            |       |
            |       |---> load: corresponds to `MemTrackerLimiter Label=load, Type=overview`, the sum of Current Consumption of all Load Memory Trackers. The web page `http://{be_host}:{be_web_server_port}/mem_tracker?type=load` displays all Memory Trackers of `type=load`.
            |       |
            |       |---> reserved: corresponds to `MemTrackerLimiter Label=reserved_memory, Type=overview`. The reserved memory is used when query the Hash Table and other memory-intensive behaviors. Before query the Hash Table, the memory of the Hash Table to be constructed will be reserved from the Memory Tracker to ensure that subsequent memory requests can be met.
            |       |
            |       |---> compaction: corresponds to `MemTrackerLimiter Label=compaction, Type=overview`, the sum of Current Consumption of all Compaction Memory Trackers. The web page `http://{be_host}:{be_web_server_port}/mem_tracker?type=compaction` displays all Memory Trackers of `type=compaction`.
            |       |
            |       |---> schema_change: corresponds to `MemTrackerLimiter Label=schema_change, Type=overview`, the sum of Current Consumption of all Schema Change Memory Trackers. The web page `http://{be_host}:{be_web_server_port}/mem_tracker?type=schema_change` displays all Memory Trackers of `type=schema_change`.

            |       |
            |       |---> other: corresponds to `MemTrackerLimiter Label=other, Type=overview`, the total memory of other tasks except the above, such as EngineAlterTabletTask, EngineCloneTask, CloudEngineCalcDeleteBitmapTask, SnapshotManager, etc. The web page `http://{be_host}:{be_web_server_port}/mem_tracker?type=other` displays all Memory Trackers of `type=other`.
    |
    |---> Doris BE process physical memory, corresponding to `MemTrackerLimiter Label=process resident memory, Type=overview`, Current Consumption is taken from VmRSS in `/proc/self/status`, Peak Consumption is taken from VmHWM in `/proc/self/status`.
    |
    |---> Doris BE process virtual memory, corresponding to `MemTrackerLimiter Label=process virtual memory, Type=overview`, Current Consumption is taken from VmSize in `/proc/self/status`, and Peak Consumption is taken from VmPeak in `/proc/self/status`.
위 메모리 구조에서 각 메모리 영역을 분석하는 방법은 다음을 참조하세요:
메모리 문제 FAQ
일반적인 메모리 문제를 분석하려면 메모리 문제 FAQ를 참조하세요.
메모리 제어 전략
Doris BE 프로세스의 메모리를 효율적으로 사용하고 제어할 수 있도록 하는 메모리 할당, 모니터링, 회수에 대한 소개는 메모리 제어 전략을 참조하세요.