Best practice of Apache Doris in JD
Apache Doris is an open source MPP analytical database product that not only can get query results in sub-second response time, effectively supporting real-time data analysis, but also supports huge data sets of more than 10PB. Compared with other industry-hot OLAP database systems, the distributed architecture of Apache is very simple. Itsupports elastic scaling and is easy to operate and maintain, saving a lot of labor and time costs. At present, the domestic community is very popular , and there are also many companies which have large scale uses, such as Meituan and Xiaomi,etc.
This paper mainly discusses how to use Doris for business exploration and practice in the multi-dimensional analysis of real-time and offline data in the large real-time screen of JD customer service in the scenarios of manual consultation, customer event list, after-sales service list, etc.
In recent years, with the explosive growth of data volume and the emergence of the demand for online analysis of massive data, traditional relational databases such as MySQL and Oracle have encountered bottlenecks under large data volume, while databases such as Hive and Kylin lack timeliness. So Apache Doris, Apache Druid, ClickHouse and other real-time analytic databases begun to appear, not only to cope with the second-level queries of massive data, but also to meet the real-time and quasi-real-time analysis needs. Offline and real-time computing engines are in full bloom. But for different scenarios and facing different problems, no single engine is a panacea. We hope that this article can give you some inspiration on the application and practice of offline and real-time analytics in JD's customer service business, and we hope you will communicate more and give us valuable suggestions.
JD Customer Service Business Form
As the entrance to the group's services, JD Customer Service provides efficient and reliable protection for users and merchants. JD customer service is responsible for solving users' problems in a timely manner and providing them with detailed and easy-to-understand instructions and explanations; in order to better understand users' feedback and the status of products, it is necessary to monitor a series of indicators such as the number of inquiries, pick-up rates, complaints, etc. in real time, and discover problems in a timely manner through ring comparison and year-on-year comparison, in order to better adapt to users' shopping styles, improve service quality and efficiency, and thus enhance the brand of JD influence.
Easy OLAP Design
01 EasyOLAP Doris Data Import Links
EasyOLAP Doris data sources are mainly real-time Kafka and offline HDFS files. The import of real-time data relies on Routine Load; offline data is mainly imported using Broker Load and Stream Load.
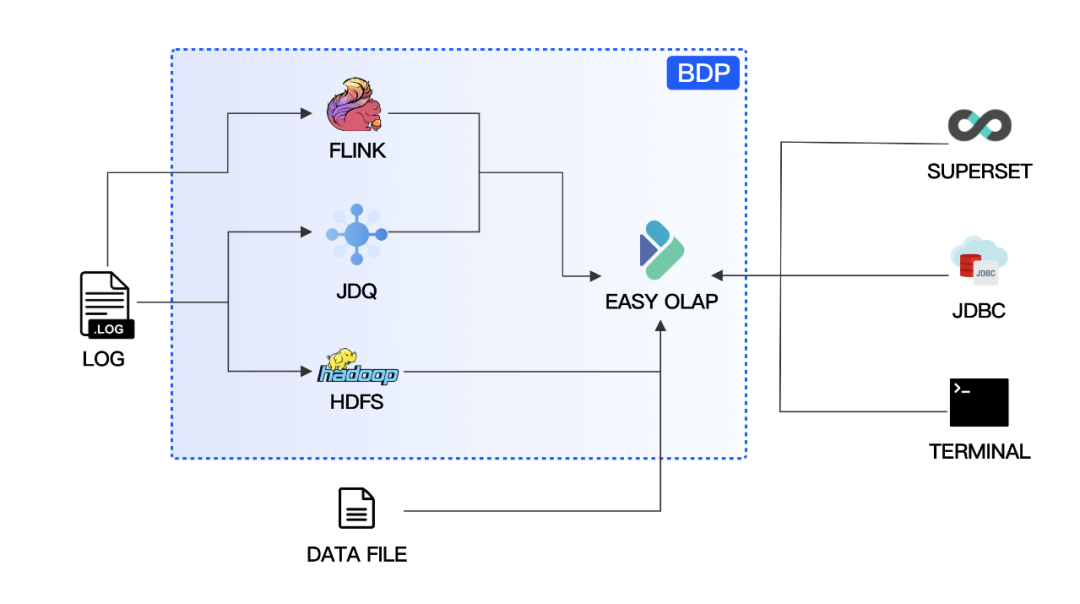
EasyOLAP Doris Data Import Links
02 EasyOLAP Doris Full Link Monitor
The EasyOLAP Doris project currently uses the Prometheus + Grafana framework for monitoring. The node_exporter is responsible for collecting machine-level metrics, and Doris automatically spits out FE and BE service-level metrics in Prometheus format. In addition, OLAP Exporter service is deployed to collect Routine Load related metrics, aiming to discover real-time data stream import at the first time and ensure real-time data timeliness.
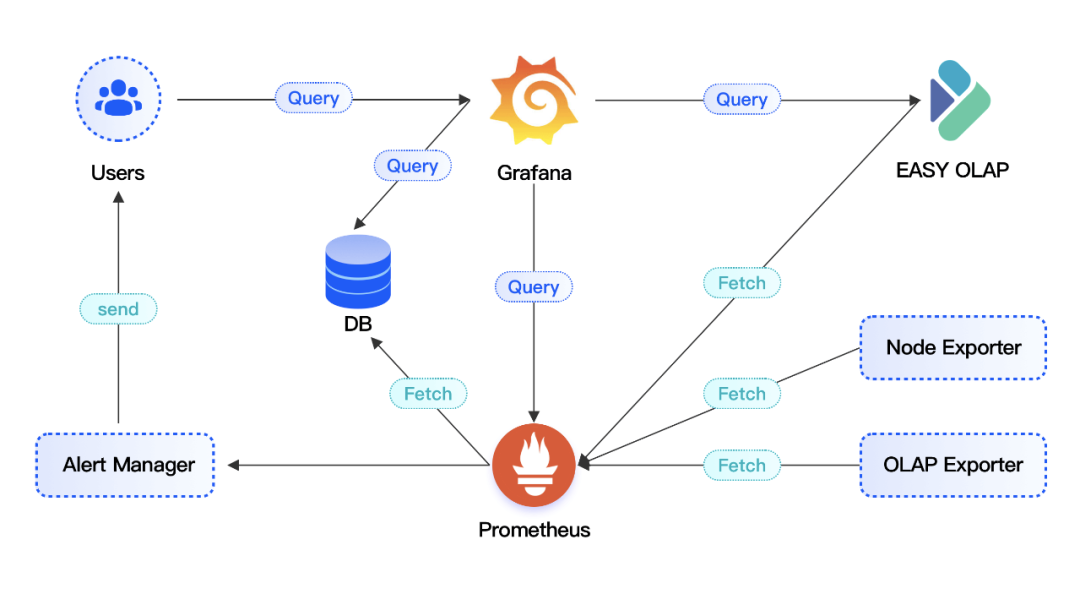
EasyOLAP Doris monitoring link
03 EasyOLAP Doris Primary-Secondary Dual Stream Design
EasyOLAP Doris adopts a dual-write approach for the primary and secondary clusters in order to guarantee the service stability of Level 0 services during the promotion time.
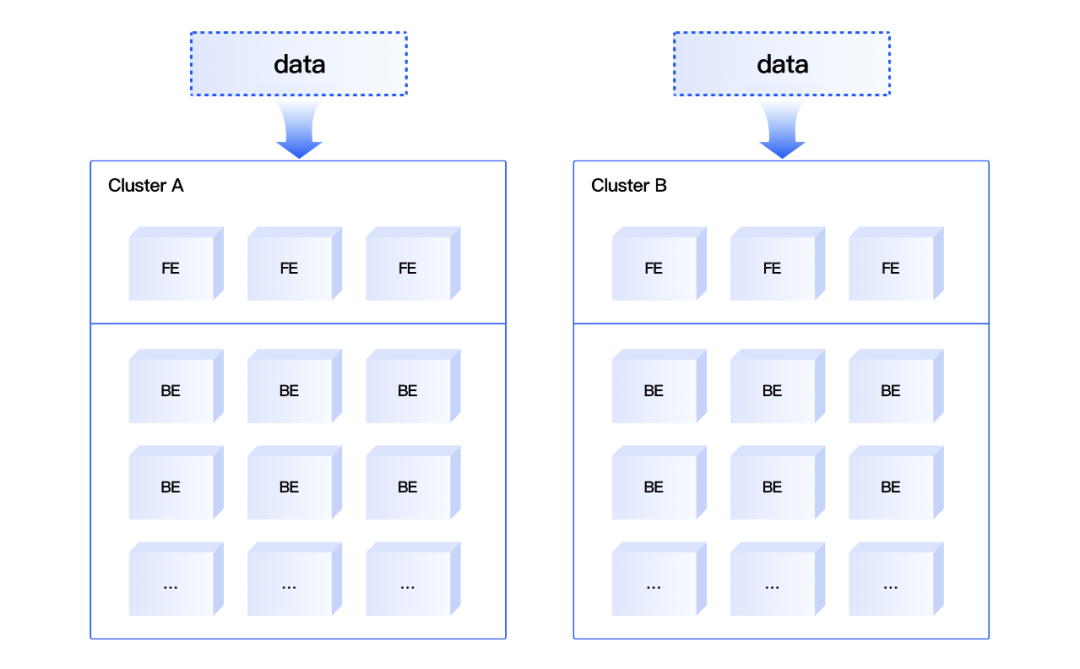
EasyOLAP Doris Primary-Secondary Dual Stream Design
04 EasyOLAP Doris Dynamic Partition Management
After analyzing the requirements, the JD OLAP team did some customization of Doris, which involved dynamic partition management. Although the community version already had the function of dynamic partitioning, the function could not retain partitions of a specified time. For the characteristics of JD Group, we have retained historical data of specified time, such as data during 618 and 11.11, which will not be deleted due to dynamic partitioning. The dynamic partition management feature can control the amount of data stored in the cluster, and it is easy to use by the business side without the need to manage partition information manually or with additional code.
Doris Caching Mechanism
01 Demand Scenarios
Committed to continuously improving user experience, JD Customer Service's data analysis pursues the ultimate timeliness. Offline data analysis scenario is write less read more, data is written once and read frequently many times; real-time data analysis scenario, part of the data is not updated historical partition, part of the data is in the updated partition. In most analysis applications, there are the following scenarios:
-
High concurrency scenario: Doris better support high concurrency, but too high QPS will cause cluster jitter, and a single node can not carry too high QPS;.
-
Complex queries: JD customer service real-time operation platform monitoring needs to display multi-dimensional complex indicators according to business scenarios, rich indicators display corresponding to a variety of different queries, and data sources from multiple tables . Although the response time of individual queries at milliseconds level , the overall response time may be at the second level.
-
Repeated queries: if there is no anti-refresh mechanism, repeatedly refreshing the page will lead to the submission of a large number of repeated queries due to delays or hand errors.
For the above scenario, there are solutions at the application layer —— the query results are put into Redis and the cache is refreshed periodically or manually by the user, but there are some problems:
-
Data inconsistency: can not respond immediately to data updates, and the user may receive results with old data.
-
Low hit rate: if the data is highly real-time and the cache is frequently invalidated, the hit rate of the cache is low and the load on the system cannot be relieved.
Additional cost: introduction of external components increases system complexity and adds additional cost.
02 Introduction to Caching Mechanism
There are three different types of Cache in EasyOLAP Doris, respectively Result Cache, SQL Cache and Partition Cache, depending on the applicable scenario. All three types of caches can be switched on and off by MySQL client commands.
These three caching mechanisms can coexist: which can be turned on at the same time. When querying, the query parser first determines whether the Result Cache is enabled or not, and if the Result Cache is enabled, it first finds out whether the cache exists for the query from the Result Cache, and if the cache fails or does not exist, it directly takes the cached value and returns it to the client. The cache is placed in the memory of each FE node for fast reading.
SQL Cache stores and gets the cache according to the signature of SQL, the ID of the partition of the queried table, and the latest version number of the partition. These three together serve as cache conditions. If one of these three conditions is changed, such as SQL statement change or partition version number change after data update, the cache will not be hit. In the case of multiple table joins, the partition update of one of the tables will also result in failure to hit the cache. SQL Cache is more suitable for T+1 update scenarios.
Partition Cache is a more fine-grained caching mechanism. Partition cache mainly splits a query into read-only partition and updatable partition in parallel based on partition, read-only partition is cached, updatable partition is not cached, and the corresponding result set is generated n, and then the results of each split subquery are merged. Therefore, if the query N days of data, data update the most recent D days, each day is only a different date range but similar queries, you can use Partition Cache, only need to query D partitions can be, the other parts are from the cache, can effectively reduce the cluster load, shorten the query response time.
When a query enters Doris, the system will first process the query statement and take it as the key, before executing the query statement, the query analyzer can automatically select the most suitable caching mechanism to ensure that the caching mechanism is used to shorten the query response time in the best case. Then, it checks whether the query result exists in the Cache, and if it does, it gets the data in the cache and returns it to the client; if it does not, it queries normally and stores the query result as Value and the query statement Key in the cache. SQL Cache is more suitable for T+1 scenarios and works well when partition updates are infrequent and SQL statements are repetitive Partition Cache is the least granular cache. When a query statement queries data for a time period, the query statement is split into multiple subqueries. It can shorten the query time and save cluster resources when the data is written to only one partition or partial partition.
To better observe the effectiveness of caching, metrics have been added to Doris' service metrics, which are monitored visually through Prometheus and Grafana monitoring systems. The metrics include the number of hits for different types of Cache, the hit rate for different types of Cache, the memory size of the Cache, and other metrics.
03 Caching Mechanism Effect
For the JD Customer Service Doris main cluster, some services reached 100% CPU usage during 11.11 period without caching on; with Result Cache on, CPU usage was between 30% and 40%. The caching mechanism ensures that the business can get the query results quickly and protects the cluster resources well under high concurrency scenarios.
Doris' optimization during the 11.11 sale, 2020
01 Import Task Optimization
The import of real-time data has always been a challenge. Among them, ensuring real-time data and importing stability is the most important. In order to observe the real-time data import situation more intuitively, JD OLAP team developed OLAP Exporter independently to collect real-time data import-related metrics, such as import speed, import backlog and suspended tasks. The import speed and import backlog can be used to determine the status of a real-time import task, and if find a trend of backlog, the sampling tool developed independently can be used to sample and analyze the real-time task. Real-time tasks have three main thresholds to control the submission of tasks, which are the maximum processing interval per batch, the maximum number of processing entries per batch and the maximum amount of data processed per batch, and a task will be submitted as soon as one of these thresholds is reached. By increasing the logs, we found that the task queue in FE was relatively busy, so the parameters were mainly adjusted to make the maximum number of processing entries per batch and the maximum amount of data processed per batch larger, and then the maximum processing interval per batch was adjusted to ensure that the data latency was within twice the maximum processing interval per batch according to the business requirements. Through the sampling tool, the analysis task ensures not only the real-time data, but also the stability of the import. In addition, we also set up alarms to detect abnormalities such as backlog of real-time import tasks and suspension of import tasks in a timely manner.
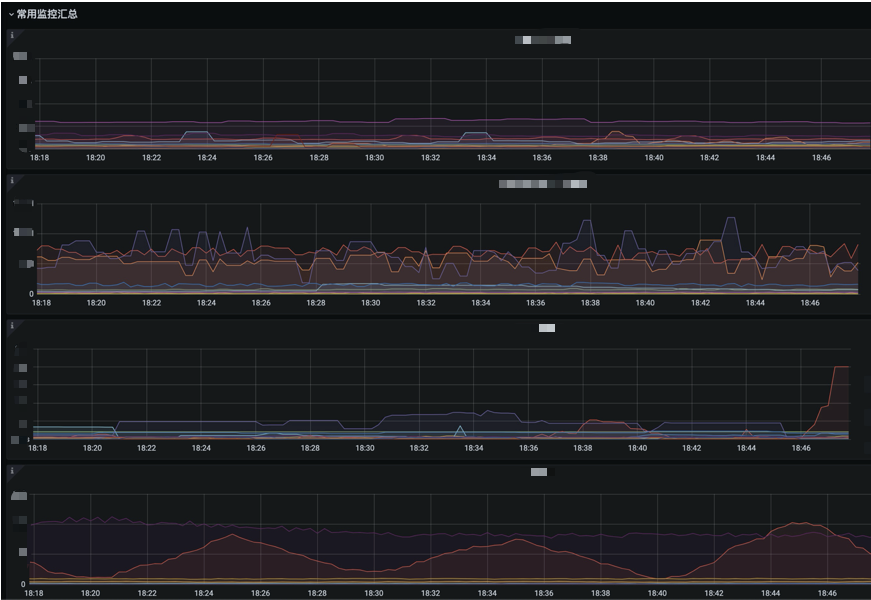
02 Monitoring Metrics Optimization
The monitoring metrics are divided into two main sections, a machine level metrics section and a business level metrics section. In the whole monitoring panel, detailed metrics bring comprehensive data and at the same time make it more difficult to get important metrics. So, to get a better view of important metrics for all clusters, a separate panel is created - 11.11 Important Metrics Summary Panel. The board contains metrics such as BE CPU usage, real-time task consumption backlog rows, TP99, QPS, and so on. The number of metrics is small, but the situation of all clusters can be observed, which can eliminate the trouble of frequent switching in monitoring.
03 Peripheral Tools Support
In addition to the sampling tools and OLAP Exporter mentioned above, the JD OLAP team has also developed a series maintenance tools for Doris.
-
Import sampling tool: The import sampling tool not only collects the data imported in real time, but also supports adjusting the parameters of the real time import task, or generating creation statements (including the latest loci and other information) for task migration and other operations when the real time import task is paused.
-
Big query tool: Big queries not only cause jitter in cluster BE CPU usage, but also lead to longer response time for other queries. Before the Big Query tool, if you found jitter in cluster CPU, you needed to check the audit logs on all FEs and then do the statistics, which is not only time-consuming but also not intuitive. The Big Query tool is designed to solve the above problem. When the monitoring side finds that the cluster has jitter, you can use the Big Query tool and enter the cluster name and time point to get the total number of queries for different services at that time point, the number of queries with more than 5 seconds, 10 seconds, 20 seconds, the number of queries with huge scanning volume, etc. It is convenient for us to analyze the big queries from different dimensions. The details of the big queries will also be saved in the intermediate file, which can directly get the big queries of different businesses. The whole process only takes a few tens of seconds to a minute to locate the big query that is happening and get the corresponding query statements, which greatly saves time and operation and maintenance costs.
-
Downgrade and recovery tools: In order to ensure the stability of the Level 0 business during the 11.11 promotion, when the cluster pressure exceeds the safety level, it is necessary to downgrade other non-Level 0 businesses, and then restore them to the pre-downgrade settings with one click after the peak period. The degradation mainly involves reducing the maximum number of connections to the service, suspending non-level 0 real-time import tasks, and so on. This greatly increases the ease of operation and improves efficiency.
-
Cluster inspection tool: During 11.11 period, the health inspection of clusters is extremely important. Routine inspections include primary and secondary cluster consistency checks for dual-stream services. In order to ensure that the business can quickly switch to the other cluster when one cluster has problems, it is necessary to ensure that the library tables on both clusters are consistent and the data volume is not too different; check whether the number of copies of the library tables is 3 and whether there are unhealthy Tablet in the cluster; check the machine disk utilization, memory and other machine-level indicators, etc. Check the machine disk utilization, memory and other machine-level metrics, etc.
Summary & Outlook
JD Customer Service was introduced to Doris in early 2020, and currently has one standalone cluster and one shared cluster, and is an experienced user of JD OLAP.
In the business use, we also encountered problems such as task scheduling-related, import task configuration-related and query-related problems, which are driving the JD OLAP team to understand Doris more deeply. We plan to promote the use of materialized views to further improve the efficiency of queries; use Bitmap to support accurate de-duplication of UV and other metrics; use audit logs to make it easier to count large and slow queries; and solve the scheduling problem of real-time import tasks to make them more efficient and stable. In addition, we also plan to optimize table building, create high-quality Rollup or materialized views to improve the smoothness of the application, and accelerate more businesses to the OLAP platform to improve the impact of the application.