获取 Profile
背景
我们时常遇到对应 SQL 执行时间不及预期的情况,为了优化 SQL 达到预期查询时延,通过 Profile 我们能够看出可以做哪些优化。现在说明在不同环境下应该如何拿到对应 Query 的 Profile。
请求
HTTP://FE_IP:HTTP_PORT
GET /API/Profile
Doris 集群能够正常访问外网
-
开启 Profile 上报参数 enable_profile
该参数开启的是 session 变量,此变量不建议全局开启。
--开启变量
mysql> set enable_profile=true;
Query OK, 0 rows affected (0.00 sec)

--确认变量是否正常开启
mysql> show variables like '%profile%';
+----------------+-------+---------------+---------+
| Variable_name  | Value | Default_Value | Changed |
+----------------+-------+---------------+---------+
| enable_profile | true  | false         | 1       |
+----------------+-------+---------------+---------+
1 row in set (0.00 sec) -
执行对应 Query
集群在多个 FE 的情况下,需要到开启 Profile 上报参数的 FE 上执行对应 Query, 参数并没有全局生效。
--开启变量
mysql> set enable_profile=true;
Query OK, 0 rows affected (0.00 sec)
--确认变量是否正常开启
mysql> show variables like '%profile%';
+----------------+-------+---------------+---------+
| Variable_name  | Value | Default_Value | Changed |
+----------------+-------+---------------+---------+
| enable_profile | true  | false         | 1       |
+----------------+-------+---------------+---------+
1 row in set (0.00 sec)

--执行对应 Query
mysql> select id,name from test.test where name like "%RuO%";
+---------------------------+-----------------------------------------------------------------------------------------------------------------------------+
| id                        | name                                                                                                                        |
+---------------------------+-----------------------------------------------------------------------------------------------------------------------------+
| 1ZWXYGbb8nr5Pi29J4cEMyEMb | ZN1nqzBRSl1rTrr99rnX1aplxhRuOUTLw6so7rzjlRQ317gTPxh0dHljmrARDJjH7FjRkJW9c7YuUBmWikq7eNgmFKJPreWirDrGrFzUYH4eP6kDtSA3UTnNIIj |
+---------------------------+-----------------------------------------------------------------------------------------------------------------------------+
1 row in set (0.01 sec) -
获取 Profile
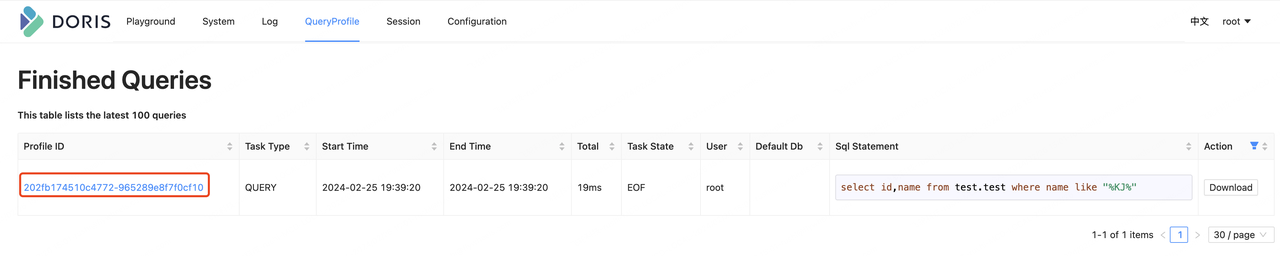
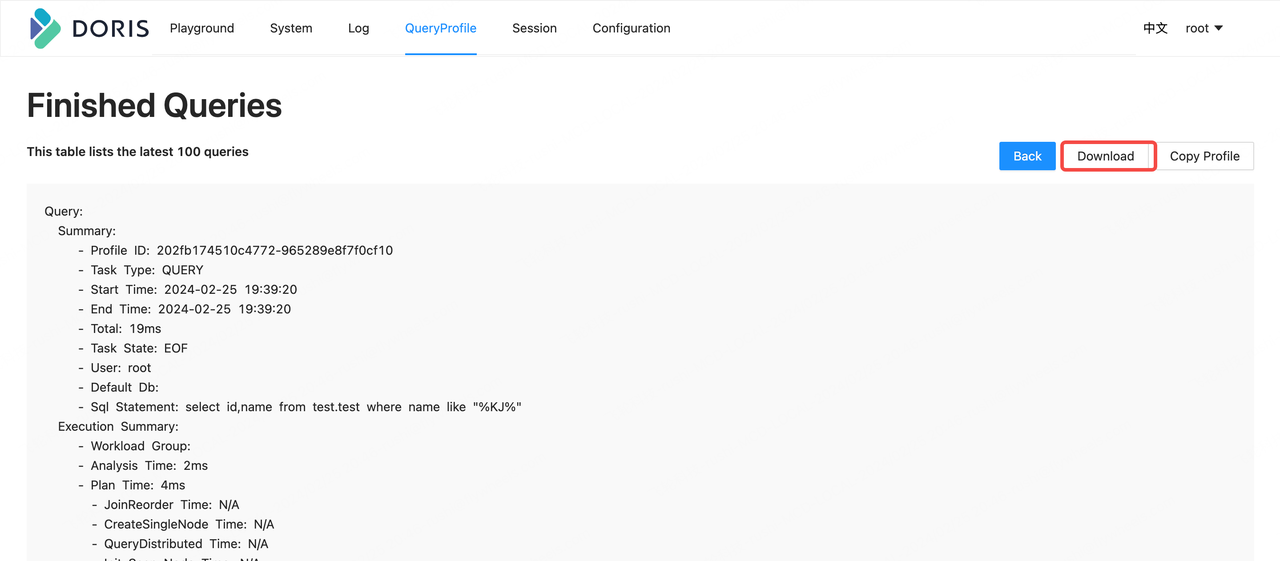
集群在多个 FE 的情况下,需要访问执行对应 Query 的 FE HTTP 界面 ( HTTP://FE_IP:HTTP_PORT ) 的 QueryProfile 页面,点击对应 Profile ID 查看对应 Profile,还可以在 Profile 界面下载对应 Profile。
Doris 集群访问外网受到限制
集群不能正常访问外网时,需要通过 API 的方式拿到对应 Profile (HTTP://FE_IP:HTTP_PORT/API/Profile?Query_ID=),IP 和端口是指执行对应 Query 的 FE 对应 IP 和端口。此时获取对应 Query 的 Profile 步骤前两步和正常访问外网时是一样的,第三步获取 Profile 时会有差别。
获取 Porfile
-
找到对应 Query ID
--根据对应 Query 找到 Profile ID
mysql> show query profile "/";
+-----------------------------------+-----------+---------------------+---------------------+-------+------------+------+------------+-------------------------------------------------------+
| Profile ID                        | Task Type | Start Time          | End Time            | Total | Task State | User | Default Db | Sql Statement                                         |
+-----------------------------------+-----------+---------------------+---------------------+-------+------------+------+------------+-------------------------------------------------------+
| 1b0bb22689734d30-bbe56e17c2ff21dc | QUERY     | 2024-02-28 11:00:17 | 2024-02-28 11:00:17 | 7ms   | EOF        | root |            | select id,name from test.test where name like "%RuO%" |
| 202fb174510c4772-965289e8f7f0cf10 | QUERY     | 2024-02-25 19:39:20 | 2024-02-25 19:39:20 | 19ms  | EOF        | root |            | select id,name from test.test where name like "%KJ%"  |
+-----------------------------------+-----------+---------------------+---------------------+-------+------------+------+------------+-------------------------------------------------------+
2 rows in set (0.00 sec) -
查询 Profile 并将 Profile 重定向到一个文本中
模板:CURL -X GET -u user:password http://fe_ip:http_port/api/profile?query_id=1b0bb22689734d30-bbe56e17c2ff21dc > test.profile

[user@VM-10-6-centos profile]$ curl -X GET -u root:root http://127.0.0.1:8030/api/profile?query_id=1b0bb22689734d30-bbe56e17c2ff21dc > test.profile
  % Total    % Received % Xferd  Average Speed   Time    Time     Time  Current
                                 Dload  Upload   Total   Spent    Left  Speed
100 1211 0 1211 0 0 168k 0 --:--:-- --:--:-- --:--:-- 168k -
返回的 Profile 换行符为 \ \n 分析起来很不方便,可以在文本编辑工具中将 \ \n 替换为 \n
[user@VM-10-6-centos profile]$ cat test.profile
{"msg":"success","code":0,"data":{"profile":"Query:\n  Summary:\n
- Profile ID: 1b0bb22689734d30-bbe56e17c2ff21dc\n     - Task Type: QUERY\n
- Start Time: 2024-02-28 11:00:17\n     - End Time: 2024-02-28 11:00:17\n
- Total: 7ms\n     - Task State: EOF\n     - User: root\n     - Default Db: \n
- Sql Statement: select id,name from test.test where name like \"%RuO%\"\n  Execution Summary:\n
- Workload Group: \n     - Analysis Time: 1ms\n
- Plan Time: 2ms\n       - JoinReorder Time: N/A\n
- CreateSingleNode Time: N/A\n       - QueryDistributed Time: N/A\n
- Init Scan Node Time: N/A\n       - Finalize Scan Node Time: N/A\n
- Get Splits Time: N/A\n           - Get PARTITIONS Time: N/A\n
- Get PARTITION FILES Time: N/A\n         - Create Scan Range Time: N/A\n
- Schedule Time: N/A\n     - Fetch Result Time: 0ms\n     - Write Result Time: 0ms\n
- Wait and Fetch Result Time: N/A\n     - Doris Version: doris-2.0.4-rc06-003a815b63\n
- Is Nereids: Yes\n     - Is Pipeline: Yes\n     - Is Cached: Yes\n
- Total Instances Num: 0\n     - Instances Num Per BE: \n
- Parallel Fragment Exec Instance Num: 48\n - Trace ID: \n"},"count":0} -
替换后的效果如下
{"msg":"success","code":0,"data":{"profile":"Query:
  Summary:
     - Profile ID: 1b0bb22689734d30-bbe56e17c2ff21dc
     - Task Type: QUERY
     - Start Time: 2024-02-28 11:00:17
     - End Time: 2024-02-28 11:00:17
     - Total: 7ms
     - Task State: EOF
     - User: root
     - Default Db:
     - Sql Statement: select id,name from test.test where name like \"%RuO%\"
  Execution Summary:
     - Workload Group:
     - Analysis Time: 1ms
     - Plan Time: 2ms
       - JoinReorder Time: N/A
       - CreateSingleNode Time: N/A
       - QueryDistributed Time: N/A
       - Init Scan Node Time: N/A
       - Finalize Scan Node Time: N/A
         - Get Splits Time: N/A
           - Get PARTITIONS Time: N/A
           - Get PARTITION FILES Time: N/A
         - Create Scan Range Time: N/A
     - Schedule Time: N/A
     - Fetch Result Time: 0ms
     - Write Result Time: 0ms
     - Wait and Fetch Result Time: N/A
     - Doris Version: doris-2.0.4-rc06-003a815b63
     - Is Nereids: Yes
     - Is Pipeline: Yes
     - Is Cached: Yes
     - Total Instances Num: 0
     - Instances Num Per BE:
     - Parallel Fragment Exec Instance Num: 48
     - Trace ID:
"},"count":0}