慢 SQL 诊断工具:审计日志和审计表
性能诊断工具用于快速定位有问题的业务 SQL,是保障数据库 SLA 的关键。Doris 默认将执行时间超过 5 秒的 SQL 认定为慢 SQL,阈值可通过 config.qe_slow_log_ms 配置。
开始前 Checklist:
- 是否已知慢 SQL 阈值(默认 5000 ms)。
- 是否可访问 FE 节点的
fe/log/fe.audit.log文件。 - 是否使用 Doris 2.1 及以上版本(系统表方式所需)。
- 是否部署了 Doris Manager(可选,用于 UI 化筛选)。
三种诊断渠道对比:
| 工具 | 适用场景 | 访问方式 | 是否需 Manager | 版本要求 |
|---|---|---|---|---|
| Doris Manager 日志 | UI 化筛选慢 SQL | Manager 控制台 | 是 | 全版本 |
Audit Log(fe.audit.log) | 原始日志直查、文本筛选 | FE 节点文件 | 否 | 全版本 |
audit_log 系统表 | SQL 化统计与聚合分析 | MySQL 客户端查询 | 否 | 2.1+ |
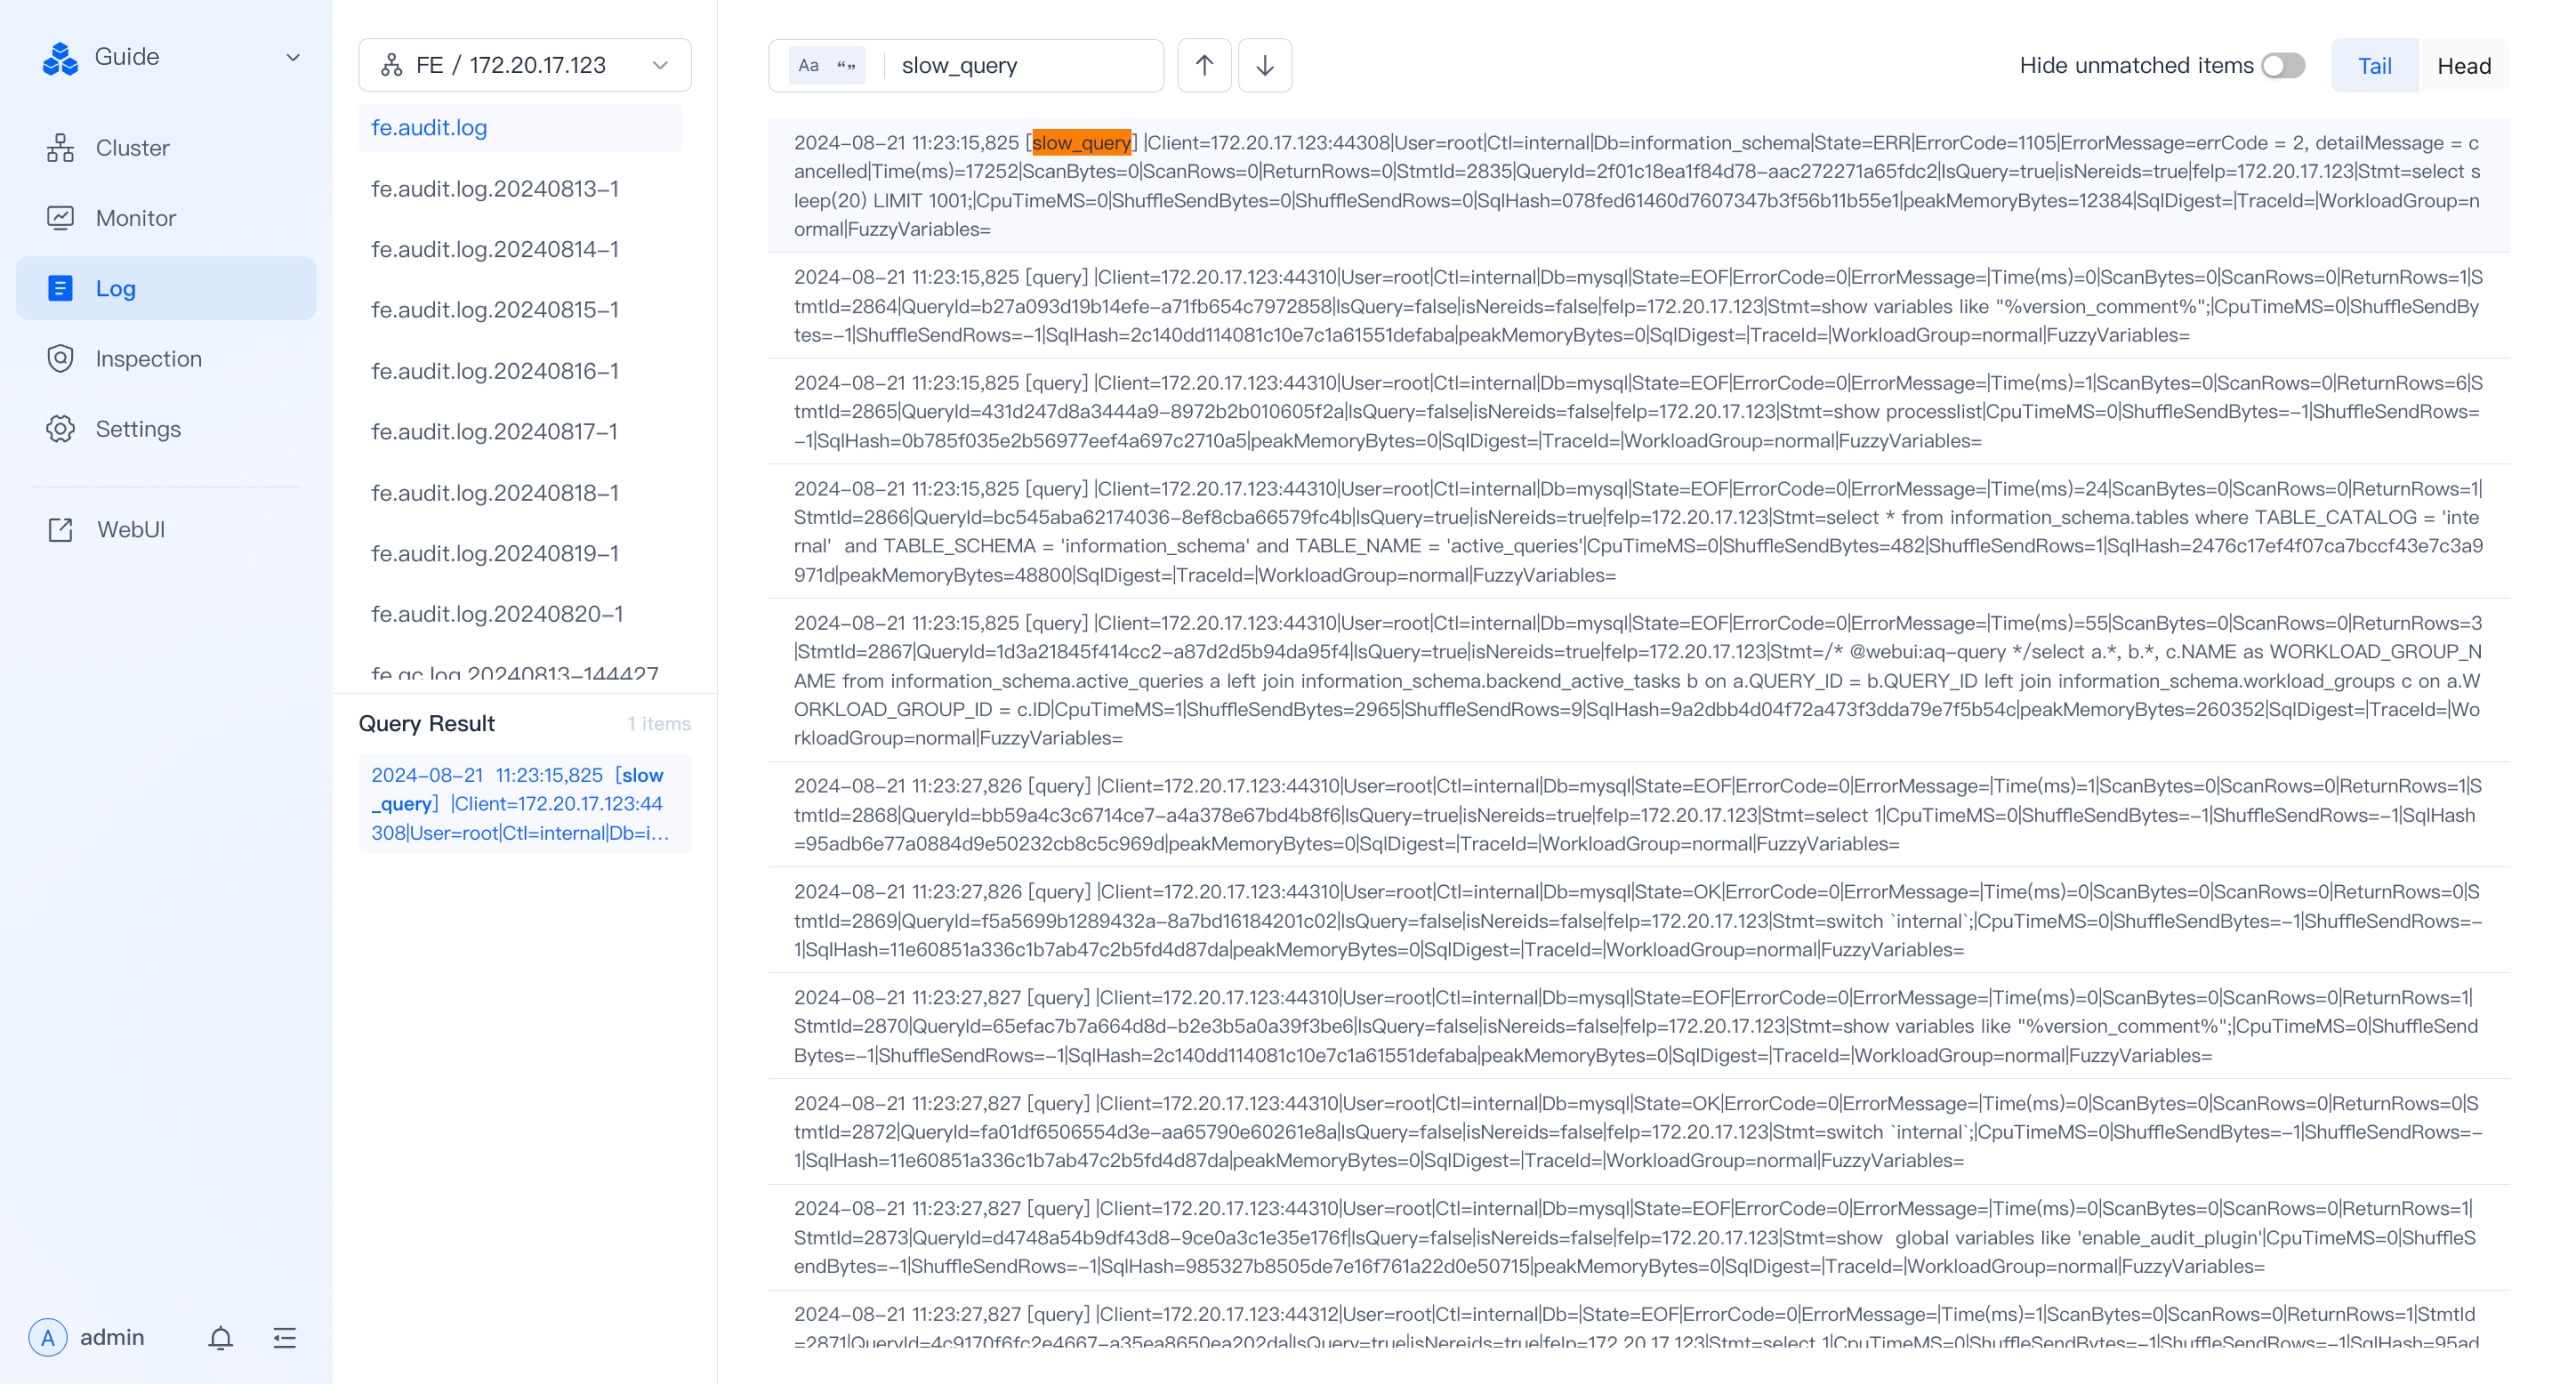
Doris Manager 日志
Doris Manager 的日志模块提供慢 SQL 筛选能力。
操作步骤:
- 目的:查看历史慢 SQL。
- 命令:在日志页面选择特定 FE 节点的
fe.audit.log。 - 说明:搜索框输入
slow_query,即可在页面上查看慢 SQL 列表。
Audit Log
Audit Log 是 Doris FE 输出的审计日志。除可在 Doris Manager 日志页面查看外,也可直接访问 FE 节点的 fe/log/fe.audit.log 文件。
Audit Log 类型:
| 类型 | 说明 |
|---|---|
slow_query | 执行时间超过阈值的慢查询 |
query | 普通查询 |
load | 导入任务 |
stream_load | Stream Load 导入 |
直查 fe.audit.log 筛选慢查询
通过 fe.audit.log 中的 slow_query 标签可快速筛选慢查询。示例日志:
2024-07-18 11:23:13,042 [slow_query] |Client=127.0.0.1:63510|User=root|Ctl=internal|Db=tpch_sf1000|State=EOF|ErrorCode=0|ErrorMessage=|Time(ms)=11603|ScanBytes=236667379712|ScanRows=13649979418|ReturnRows=100|StmtId=1689|QueryId=91ff336304f14182-9ca537eee75b3856|IsQuery=true|isNereids=true|feIp=172.21.0.10|Stmt=select     c_name,     c_custkey,     o_orderkey,     o_orderdate,     o_totalprice,     sum(l_quantity) from     customer,     orders,     lineitem where     o_orderkey  in  (         select             l_orderkey         from             lineitem         group  by             l_orderkey  having                 sum(l_quantity)  >  300     )     and  c_custkey  =  o_custkey     and  o_orderkey  =  l_orderkey group  by     c_name,     c_custkey,     o_orderkey,     o_orderdate,     o_totalprice order  by     o_totalprice  desc,     o_orderdate limit  100|CpuTimeMS=918556|ShuffleSendBytes=3267419|ShuffleSendRows=89668|SqlHash=b4e1de9f251214a30188180f37907f7d|peakMemoryBytes=38720935552|SqlDigest=f23c7a7ecff61da33f537b2699e9b053|cloudClusterName=UNKNOWN|TraceId=|WorkloadGroup=normal|FuzzyVariables=|scanBytesFromLocalStorage=0|scanBytesFromRemoteStorage=0
2024-07-18 11:23:33,043 [slow_query] |Client=127.0.0.1:26672|User=root|Ctl=internal|Db=tpch_sf1000|State=EOF|ErrorCode=0|ErrorMessage=|Time(ms)=8978|ScanBytes=334985555968|ScanRows=10717654374|ReturnRows=100|StmtId=1815|QueryId=6e1fae453cb04d9a-b1e5f94d9cea1885|IsQuery=true|isNereids=true|feIp=172.21.0.10|Stmt=select     s_name,     count(*) as numwait from     supplier,     lineitem l1,     orders,     nation where     s_suppkey = l1.l_suppkey     and o_orderkey = l1.l_orderkey     and o_orderstatus = 'F'     and l1.l_receiptdate > l1.l_commitdate     and exists (         select             *         from             lineitem l2         where                 l2.l_orderkey = l1.l_orderkey           and l2.l_suppkey <> l1.l_suppkey     )     and not exists (         select             *         from             lineitem l3         where                 l3.l_orderkey = l1.l_orderkey           and l3.l_suppkey <> l1.l_suppkey           and l3.l_receiptdate > l3.l_commitdate     )     and s_nationkey = n_nationkey     and n_name = 'SAUDI ARABIA' group by     s_name order by     numwait desc,     s_name limit 100|CpuTimeMS=990127|ShuffleSendBytes=59208164|ShuffleSendRows=3651504|SqlHash=f8a30e4182d72cce3eff6cb385005b1f|peakMemoryBytes=10495660672|SqlDigest=fec5a7136f9375aa968a4de971b994da|cloudClusterName=UNKNOWN|TraceId=|WorkloadGroup=normal|FuzzyVariables=|scanBytesFromLocalStorage=0|scanBytesFromRemoteStorage=0
2024-07-18 11:23:41,044 [slow_query] |Client=127.0.0.1:26684|User=root|Ctl=internal|Db=tpch_sf1000|State=EOF|ErrorCode=0|ErrorMessage=|Time(ms)=8514|ScanBytes=334986551296|ScanRows=10717654374|ReturnRows=100|StmtId=1833|QueryId=4f91483464ce4aa8-beeed7dcb8675bc8|IsQuery=true|isNereids=true|feIp=172.21.0.10|Stmt=select     s_name,     count(*) as numwait from     supplier,     lineitem l1,     orders,     nation where     s_suppkey = l1.l_suppkey     and o_orderkey = l1.l_orderkey     and o_orderstatus = 'F'     and l1.l_receiptdate > l1.l_commitdate     and exists (         select             *         from             lineitem l2         where                 l2.l_orderkey = l1.l_orderkey           and l2.l_suppkey <> l1.l_suppkey     )     and not exists (         select             *         from             lineitem l3         where                 l3.l_orderkey = l1.l_orderkey           and l3.l_suppkey <> l1.l_suppkey           and l3.l_receiptdate > l3.l_commitdate     )     and s_nationkey = n_nationkey     and n_name = 'SAUDI ARABIA' group by     s_name order by     numwait desc,     s_name limit 100|CpuTimeMS=925841|ShuffleSendBytes=59223190|ShuffleSendRows=3651602|SqlHash=f8a30e4182d72cce3eff6cb385005b1f|peakMemoryBytes=10505123104|SqlDigest=fec5a7136f9375aa968a4de971b994da|cloudClusterName=UNKNOWN|TraceId=|WorkloadGroup=normal|FuzzyVariables=|scanBytesFromLocalStorage=0|scanBytesFromRemoteStorage=0
2024-07-18 11:23:49,044 [slow_query] |Client=127.0.0.1:10748|User=root|Ctl=internal|Db=tpch_sf1000|State=EOF|ErrorCode=0|ErrorMessage=|Time(ms)=8660|ScanBytes=334987673600|ScanRows=10717654374|ReturnRows=100|StmtId=1851|QueryId=4599cb1bab204f80-ac430dd78b45e3da|IsQuery=true|isNereids=true|feIp=172.21.0.10|Stmt=select     s_name,     count(*) as numwait from     supplier,     lineitem l1,     orders,     nation where     s_suppkey = l1.l_suppkey     and o_orderkey = l1.l_orderkey     and o_orderstatus = 'F'     and l1.l_receiptdate > l1.l_commitdate     and exists (         select             *         from             lineitem l2         where                 l2.l_orderkey = l1.l_orderkey           and l2.l_suppkey <> l1.l_suppkey     )     and not exists (         select             *         from             lineitem l3         where                 l3.l_orderkey = l1.l_orderkey           and l3.l_suppkey <> l1.l_suppkey           and l3.l_receiptdate > l3.l_commitdate     )     and s_nationkey = n_nationkey     and n_name = 'SAUDI ARABIA' group by     s_name order by     numwait desc,     s_name limit 100|CpuTimeMS=932664|ShuffleSendBytes=59223178|ShuffleSendRows=3651991|SqlHash=f8a30e4182d72cce3eff6cb385005b1f|peakMemoryBytes=10505123104|SqlDigest=fec5a7136f9375aa968a4de971b994da|cloudClusterName=UNKNOWN|TraceId=|WorkloadGroup=normal|FuzzyVariables=|scanBytesFromLocalStorage=0|scanBytesFromRemoteStorage=0
通过 fe.audit.log 可获取慢 SQL 的执行时间、扫描行数、返回行数、SQL 语句等关键信息,为后续重现与优化奠定基础。
关键字段速查
| 字段 | 含义 |
|---|---|
Time(ms) | 查询执行耗时(毫秒) |
ScanBytes / ScanRows | 扫描的数据量与行数 |
ReturnRows | 返回客户端的行数 |
QueryId | 查询唯一 ID,可用于关联 Profile |
Stmt | 完整的 SQL 语句 |
SqlDigest | SQL 结构哈希,用于聚合同模式 SQL |
CpuTimeMS | CPU 总耗时(毫秒) |
peakMemoryBytes | 峰值内存占用 |
WorkloadGroup | 所属 Workload Group |
使用 SqlDigest 做模式聚合
SqlDigest 是基于 SQL 结构生成的哈希值(去除具体参数)。结构相同的 SQL,SqlDigest 一致;据此可聚合分析慢 SQL 模式。
基于 SqlDigest,可统计哪类 SQL 模式频率最高或总耗时最长,并优先优化这些模式。该方法显著提升优化效率,避免逐条分析。
注意:SqlDigest 仅是哈希,无法直接阅读。确定要优化的模式后,需结合 Stmt 字段获取实际 SQL,并通过 QueryId 关联 Profile 做深度分析(Profile 在后续章节介绍)。
慢查询分析示例
以上述 4 条慢查询日志为例:
- 第 1 条(
Time(ms)=11603)的SqlDigest为f23c7a7ecff61da33f537b2699e9b053。 - 后 3 条(
Time(ms)=8978/8514/8660)的SqlDigest均为fec5a7136f9375aa968a4de971b994da。
后 3 条虽执行细节不同,但属于同一种 SQL 模式(结构相同)。
实际优化中,若某 SqlDigest(如 fec5a7136f9375aa968a4de971b994da)反复出现或累计耗时占比高,应优先关注。
优化步骤:
-
定位业务逻辑:通过该模式下任意一条日志的
Stmt字段确定业务 SQL:select s_name, count(*) as numwait from supplier, lineitem l1, orders, nation where ... -
深度分析:使用
QueryId(如6e1fae453cb04d9a-b1e5f94d9cea1885)查找对应的 Query Profile。结合 Profile 判断瓶颈点(扫描数据量过大、Join 耗时过长等),制定优化策略(增加索引、改写 SQL、调整表结构等)。
解决该模式问题后,所有同模式慢查询都会受益。
audit_log 系统表
Doris 2.1 及以上版本在 __internal_schema 数据库下提供 audit_log 系统表,用于通过 SQL 方式查询审计信息。
启用步骤
| 步骤 | 命令 | 说明 |
|---|---|---|
| 1. 启用插件 | set global enable_audit_plugin=true; | 全局开启 audit 插件,默认关闭 |
| 2. 切换库 | use __internal_schema; | 进入内部 schema |
| 3. 查看表 | show tables; | 确认 audit_log 表存在 |
验证示例
mysql> use __internal_schema;
Reading table information for completion of table and column names
You can turn off this feature to get a quicker startup with -A

Database changed
mysql> show tables;
+-----------------------------+
| Tables_in___internal_schema |
+-----------------------------+
| audit_log                   |
| column_statistics           |
| histogram_statistics        |
| partition_statistics        |
+-----------------------------+
4 rows in set (0.00 sec)

mysql> desc audit_log;
+-------------------+--------------+------+-------+---------+-------+
| Field             | Type         | Null | Key   | Default | Extra |
+-------------------+--------------+------+-------+---------+-------+
| query_id          | varchar(48)  | Yes  | true  | NULL    |       |
| time              | datetime     | Yes  | true  | NULL    |       |
| client_ip         | varchar(128) | Yes  | true  | NULL    |       |
| user              | varchar(128) | Yes  | false | NULL    | NONE  |
| catalog           | varchar(128) | Yes  | false | NULL    | NONE  |
| db                | varchar(128) | Yes  | false | NULL    | NONE  |
| state             | varchar(128) | Yes  | false | NULL    | NONE  |
| error_code        | int          | Yes  | false | NULL    | NONE  |
| error_message     | text         | Yes  | false | NULL    | NONE  |
| query_time        | bigint       | Yes  | false | NULL    | NONE  |
| scan_bytes        | bigint       | Yes  | false | NULL    | NONE  |
| scan_rows         | bigint       | Yes  | false | NULL    | NONE  |
| return_rows       | bigint       | Yes  | false | NULL    | NONE  |
| stmt_id           | bigint       | Yes  | false | NULL    | NONE  |
| is_query          | tinyint      | Yes  | false | NULL    | NONE  |
| frontend_ip       | varchar(128) | Yes  | false | NULL    | NONE  |
| cpu_time_ms       | bigint       | Yes  | false | NULL    | NONE  |
| sql_hash          | varchar(128) | Yes  | false | NULL    | NONE  |
| sql_digest        | varchar(128) | Yes  | false | NULL    | NONE  |
| peak_memory_bytes | bigint       | Yes  | false | NULL    | NONE  |
| stmt              | text         | Yes  | false | NULL    | NONE  |
+-------------------+--------------+------+-------+---------+-------+
通过 audit_log 内部表,可使用 SQL 查询详细执行信息,做慢查询筛选与统计分析。
常见问题
Q1:为什么 fe.audit.log 中看不到 slow_query 记录?
- 原因:SQL 执行时间未达到阈值(默认 5000 ms)。
- 解决:通过
config.qe_slow_log_ms调整阈值。
Q2:为什么查询 audit_log 表无数据?
- 原因:
enable_audit_plugin默认关闭。 - 解决:执行
set global enable_audit_plugin=true;。
Q3:SqlDigest 完全相同,但 SQL 字面值不同正常吗?
- 是。
SqlDigest基于结构生成,去除参数值;同一模式下不同参数的 SQL 哈希一致。
Q4:在哪里能找到 audit_log 表?
- 位于
__internal_schema数据库下,需 Doris 2.1 及以上版本。
Q5:如何关联 Profile 做深度分析?
- 通过 Audit Log 中的
QueryId字段在 Profile 系统中查询对应执行计划。
总结
Doris 提供 Doris Manager 日志、fe.audit.log 与 audit_log 系统表三种慢 SQL 诊断渠道,覆盖 UI 筛选、文本直查与 SQL 化统计三类使用场景。结合 SqlDigest 聚合分析与 QueryId 关联 Profile,可系统性地定位并优化性能瓶颈。