Get Profile
Background
We often encounter situations where the execution time of the corresponding SQL is less than expected. In order to optimize the SQL to achieve the expected Query delay, through the Profile we can see what optimizations can be done. Now we will explain how to get the Profile corresponding to the Query in different environments.
Request
HTTP://FE_IP:HTTP_PORT
GET /API/Profile
The Doris cluster can normally access the external network
Enable profile reporting parameters enable_profile
This parameter turns on the session variable. It is not recommended to turn this variable on globally.
--open variable
mysql> set enable_profile=true;
Query OK, 0 rows affected (0.00 sec)

--Confirm whether the variable is opened normally
mysql> show variables like '%profile%';
+----------------+-------+---------------+---------+
| Variable_name  | Value | Default_Value | Changed |
+----------------+-------+---------------+---------+
| enable_profile | true  | false         | 1       |
+----------------+-------+---------------+---------+
1 row in set (0.00 sec)
Execute the corresponding query
In the case of a cluster with multiple fes, you need to execute the corresponding query on the fes that enable profile reporting parameters. The parameters do not take effect globally.
--open variable
mysql> set enable_profile=true;
Query OK, 0 rows affected (0.00 sec)
--Confirm whether the variable is opened normally
mysql> show variables like '%profile%';
+----------------+-------+---------------+---------+
| Variable_name  | Value | Default_Value | Changed |
+----------------+-------+---------------+---------+
| enable_profile | true  | false         | 1       |
+----------------+-------+---------------+---------+
1 row in set (0.00 sec)

--Execute the corresponding Query
mysql> select id,name from test.test where name like "%RuO%";
+---------------------------+-----------------------------------------------------------------------------------------------------------------------------+
| id                        | name                                                                                                                        |
+---------------------------+-----------------------------------------------------------------------------------------------------------------------------+
| 1ZWXYGbb8nr5Pi29J4cEMyEMb | ZN1nqzBRSl1rTrr99rnX1aplxhRuOUTLw6so7rzjlRQ317gTPxh0dHljmrARDJjH7FjRkJW9c7YuUBmWikq7eNgmFKJPreWirDrGrFzUYH4eP6kDtSA3UTnNIIj |
+---------------------------+-----------------------------------------------------------------------------------------------------------------------------+
1 row in set (0.01 sec)
Get Profile
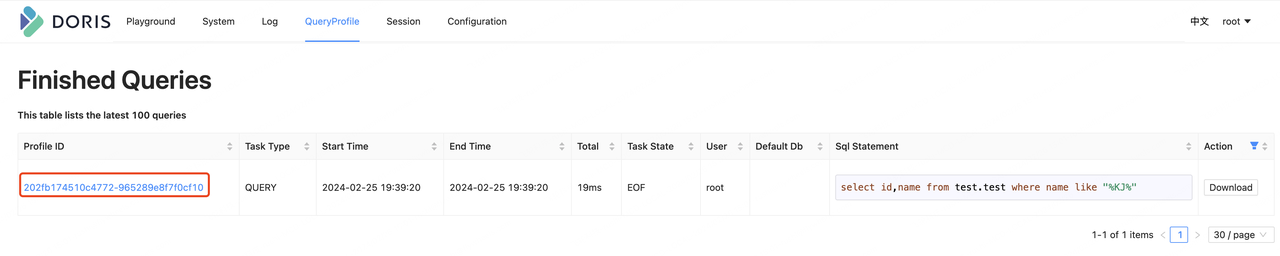
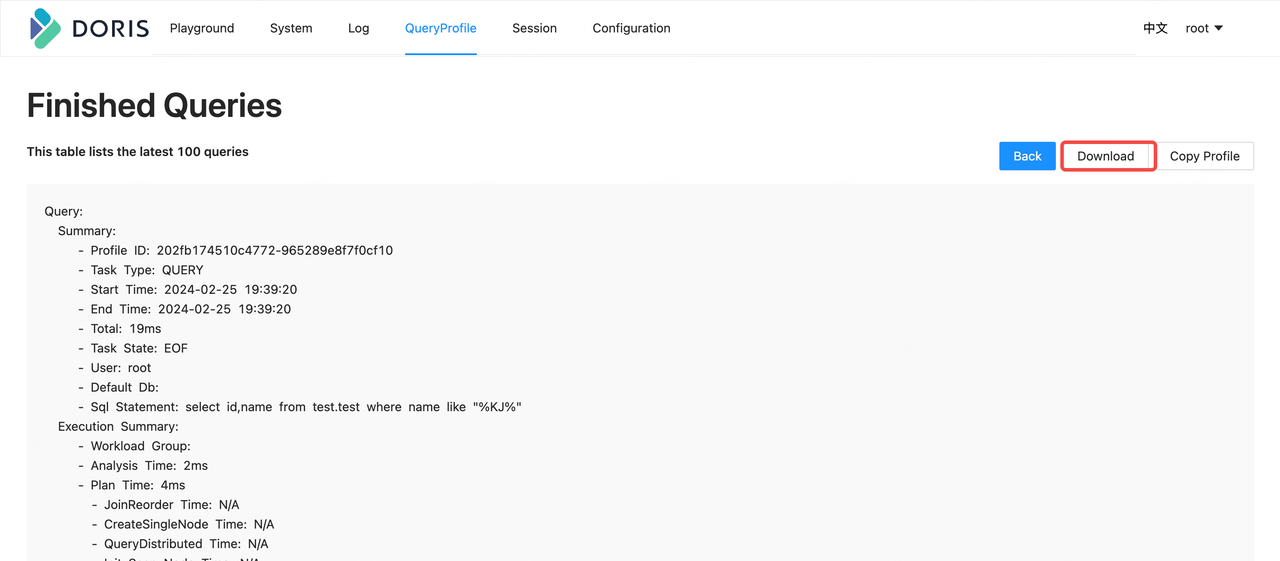
When the cluster has multiple fes, you need to access the QueryProfile page of the FE HTTP interface (HTTP://FE_IP:HTTP_PORT) that executes the corresponding query. Click the corresponding Profile ID to view the corresponding Profile. You can also download the corresponding Profile in the Profile interface.
Doris cluster’s access to the external network is restricted
When the cluster cannot access the external network normally, it needs to obtain the corresponding profile through the API (HTTP://FE_IP:HTTP_PORT/API/Profile?Query_ID=). The IP and PORT refer to the IP and PORT corresponding to FE that executes the corresponding Query. At this time, the first two steps of obtaining the Profile corresponding to the Query are the same as when accessing the external network normally. There will be a difference in the third step of obtaining the Profile.
Get Profile
Find the corresponding Profile ID
--Find the Profile ID according to the corresponding query
mysql> show query profile "/";
+-----------------------------------+-----------+---------------------+---------------------+-------+------------+------+------------+-------------------------------------------------------+
| Profile ID                        | Task Type | Start Time          | End Time            | Total | Task State | User | Default Db | Sql Statement                                         |
+-----------------------------------+-----------+---------------------+---------------------+-------+------------+------+------------+-------------------------------------------------------+
| 1b0bb22689734d30-bbe56e17c2ff21dc | QUERY     | 2024-02-28 11:00:17 | 2024-02-28 11:00:17 | 7ms   | EOF        | root |            | select id,name from test.test where name like "%RuO%" |
| 202fb174510c4772-965289e8f7f0cf10 | QUERY     | 2024-02-25 19:39:20 | 2024-02-25 19:39:20 | 19ms  | EOF        | root |            | select id,name from test.test where name like "%KJ%"  |
+-----------------------------------+-----------+---------------------+---------------------+-------+------------+------+------------+-------------------------------------------------------+
2 rows in set (0.00 sec)
Query Profile and redirect Profile to a text
template: curl -X GET -u user:password http://fe_ip:http_port/api/profile?query_id=1b0bb22689734d30-bbe56e17c2ff21dc > test.profile

[user@VM-10-6-centos profile]$ curl -X GET -u root:root http://127.0.0.1:8030/api/profile?query_id=1b0bb22689734d30-bbe56e17c2ff21dc > test.profile
  % Total    % Received % Xferd  Average Speed   Time    Time     Time  Current
                                 Dload  Upload   Total   Spent    Left  Speed
100  1211    0  1211    0     0   168k      0 --:--:-- --:--:-- --:--:--  168k
The returned Profile line break is \ \n, which is inconvenient to analyze. You can replace \ \n with \n in a text editing tool.
[user@VM-10-6-centos profile]$ cat test.profile
{"msg":"success","code":0,"data":{"profile":"Query:\n  Summary:\n
- Profile ID: 1b0bb22689734d30-bbe56e17c2ff21dc\n     - Task Type: QUERY\n
- Start Time: 2024-02-28 11:00:17\n     - End Time: 2024-02-28 11:00:17\n
- Total: 7ms\n     - Task State: EOF\n     - User: root\n     - Default Db: \n
- Sql Statement: select id,name from test.test where name like \"%RuO%\"\n  Execution Summary:\n
- Workload Group: \n     - Analysis Time: 1ms\n
- Plan Time: 2ms\n       - JoinReorder Time: N/A\n
- CreateSingleNode Time: N/A\n       - QueryDistributed Time: N/A\n
- Init Scan Node Time: N/A\n       - Finalize Scan Node Time: N/A\n
- Get Splits Time: N/A\n           - Get PARTITIONS Time: N/A\n
- Get PARTITION FILES Time: N/A\n         - Create Scan Range Time: N/A\n
- Schedule Time: N/A\n     - Fetch Result Time: 0ms\n     - Write Result Time: 0ms\n
- Wait and Fetch Result Time: N/A\n     - Doris Version: doris-2.0.4-rc06-003a815b63\n
- Is Nereids: Yes\n     - Is Pipeline: Yes\n     - Is Cached: Yes\n
- Total Instances Num: 0\n     - Instances Num Per BE: \n
- Parallel Fragment Exec Instance Num: 48\n     - Trace ID: \n"},"count":0}
The effect after replacement is as follows
{"msg":"success","code":0,"data":{"profile":"Query:
  Summary:
     - Profile ID: 1b0bb22689734d30-bbe56e17c2ff21dc
     - Task Type: QUERY
     - Start Time: 2024-02-28 11:00:17
     - End Time: 2024-02-28 11:00:17
     - Total: 7ms
     - Task State: EOF
     - User: root
     - Default Db:
     - Sql Statement: select id,name from test.test where name like \"%RuO%\"
  Execution Summary:
     - Workload Group:
     - Analysis Time: 1ms
     - Plan Time: 2ms
       - JoinReorder Time: N/A
       - CreateSingleNode Time: N/A
       - QueryDistributed Time: N/A
       - Init Scan Node Time: N/A
       - Finalize Scan Node Time: N/A
         - Get Splits Time: N/A
           - Get PARTITIONS Time: N/A
           - Get PARTITION FILES Time: N/A
         - Create Scan Range Time: N/A
     - Schedule Time: N/A
     - Fetch Result Time: 0ms
     - Write Result Time: 0ms
     - Wait and Fetch Result Time: N/A
     - Doris Version: doris-2.0.4-rc06-003a815b63
     - Is Nereids: Yes
     - Is Pipeline: Yes
     - Is Cached: Yes
     - Total Instances Num: 0
     - Instances Num Per BE:
     - Parallel Fragment Exec Instance Num: 48
     - Trace ID:
"},"count":0}
